Figures & data
Figure 1. Schematic illustration of the regulatory network controlling photosynthesis (PS) gene expression, modified from Mank et al.Citation6 PrrA activates the expression of PS genes and PcrZ at low oxygen tension, whereas PcrZ counteracts the activation of PS genes. PcrZ also reduces, directly or indirectly, the amount of AppA, leading to a stronger repression of PS genes by PpsR.
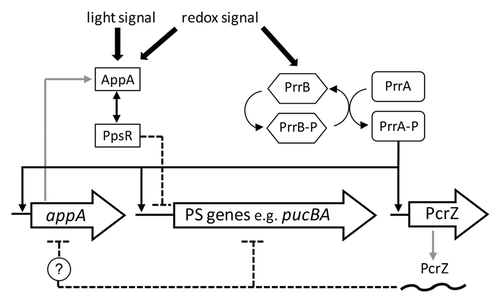
Figure 2. (A and C) Structure and regulatory output of incoherent and coherent FFL motifs. Four different types (I1-I4 and C1-C4) are depicted, where X and Y refer to transcription factors (black boxes) and small RNAs (gray boxes), respectively. Z reflects target genes of X and Y, modified from Mangan and Alon.Citation9 In the case of the RNAIII FFL, Rot stands on one hand for the rot mRNA, repressed by RNAIII, on the other hand for the Rot protein, repressing hla. (B) Schematic picture of the PrrA/PcrZ, RpoE/RybB and PhoP/AmgR mixed incoherent FFLs in R. sphaeroides, E. coli and S. enterica, respectively. (D) Schematic picture of mixed coherent FFLs. The OmpR-based and RNAIII-based FFLs from E. coli and S. aureus, respectively, are depicted.
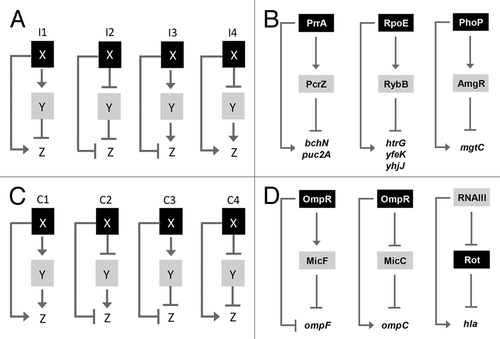
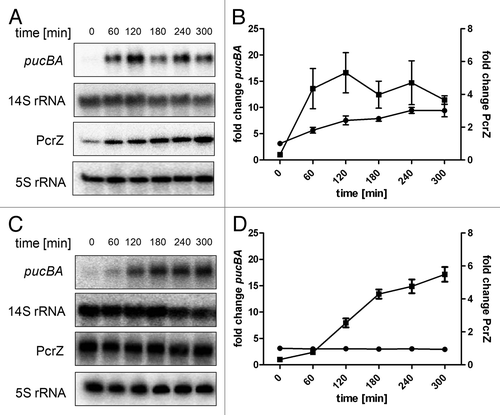
Figure 3. Representative northern blots for pucBA and PcrZ expression kinetics after drop of oxygen tension at time point 0. R. sphaeroides 2.4.1 wild-type (A) and R. sphaeroides PcrZ overexpression strain (pRKPcrZ) (C) pre-cultures were grown overnight under high oxygen conditions (8 mg/L soluble O2) to an OD660nm of 0.6–0.8 (t0). Samples were collected at indicated time points after a shift to low oxygen conditions (0.5 mg/L soluble O2). Fifteen µg of total RNA were separated on 1% agarose gels containing 2.2 M formaldehyde. For pucBA detection, a specific DNA fragment was radioactively labeled with (α-32P)-dCTP using the NEBlot kit (New England Biolabs). A 14S rRNA-specific oligonucleotide was end-labeled with (γ-32P)-ATP and served as loading control. In R. sphaeroides, 23S rRNA is processed to 16S, 14S and 5.8S rRNA fragments by RNase III.Citation46,Citation47 For PcrZ and 5S rRNA, 7.5 µg of total RNA was separated on 10% polyacrylamide gels containing 7 M urea. PcrZ and 5S rRNA-specific oligonucleotides were radioactively end-labeled with (γ-32P)-ATP and were used for detection. 5S rRNA served as loading control. (B) Quantification of northern blot signals for wild-type (A). (D) Quantification of northern blot signals for pRKPcrZ (C). The mean and the standard error are based on three independent biological experiments. The Y axis to the left shows the fold change of pucBA (black squares), the Y axis to the right displays the fold change of PcrZ (black circles).