1,001
Views
10
CrossRef citations to date
0
Altmetric
Technical Paper

Identification of RNA partners of viral proteins in infected cells

, , , , , , , , & show all
Pages 943-956 | Received 11 Jan 2013, Accepted 26 Mar 2013, Published online: 01 Apr 2013

Figures & data

Figure 1. Validation of recombinant MV expressing 1-STrEP-tagged MV-N and the protocol used to purify specific RNA partners of MV-N. (A) Schematic representation of rMV2/N-STrEP and rMV2/CH-STrEP recombinant viruses and summary of the protocol used to purify MV-N and associated RNA molecules from infected cells. The MV genome is displayed with the six genes indicated by italicized capital letters. The position of One-STrEP-tagged MV-N or CH protein insertion is shown. The black oval represents the One-STrEP-tag sequence. MV leader (Le) and trailer (Tr) regions are shown as gray and dark rectangles, respectively. (B) Analysis of MV-N viral protein-partners within an infected cell. Actin and CH proteins served as negative controls to see the specificity of the MV-N complexes after modified tandem affinity purification.Citation11 WB analysis using anti-N, anti-P, anti-V and anti-actin antibodies. (C) Ultracentrifugation through 30% sucrose followed by western blot analysis shows efficient incorporation of the N-STrEP protein within the viral nucleocapsid. Viruses used for infection are indicated above each lane. One-STrEP-tagged proteins were detected using Streptavidin-HRP.
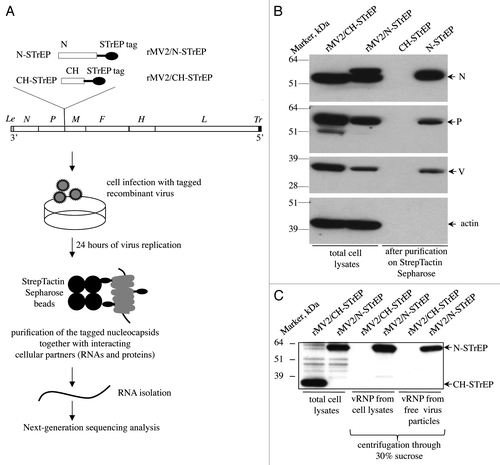
Figure 1. Validation of recombinant MV expressing 1-STrEP-tagged MV-N and the protocol used to purify specific RNA partners of MV-N. (A) Schematic representation of rMV2/N-STrEP and rMV2/CH-STrEP recombinant viruses and summary of the protocol used to purify MV-N and associated RNA molecules from infected cells. The MV genome is displayed with the six genes indicated by italicized capital letters. The position of One-STrEP-tagged MV-N or CH protein insertion is shown. The black oval represents the One-STrEP-tag sequence. MV leader (Le) and trailer (Tr) regions are shown as gray and dark rectangles, respectively. (B) Analysis of MV-N viral protein-partners within an infected cell. Actin and CH proteins served as negative controls to see the specificity of the MV-N complexes after modified tandem affinity purification.Citation11 WB analysis using anti-N, anti-P, anti-V and anti-actin antibodies. (C) Ultracentrifugation through 30% sucrose followed by western blot analysis shows efficient incorporation of the N-STrEP protein within the viral nucleocapsid. Viruses used for infection are indicated above each lane. One-STrEP-tagged proteins were detected using Streptavidin-HRP.

Figure 2. Analysis of purified MV-N RNA partners. (A) Agilent eukaryotic total RNA assay of MV-N/RNA samples reveals a distinct band slightly above 1,000 nucleotides. Total RNA purified from cells infected with rMV2/CH-STrEP or rMV2/N-STrEP viruses or RNA samples after purification on StrepTactin Sepharose beads. (B) Comparison of number of sequences that mapped to MV or human genomes for CH/RNA, and MV-N/RNA samples. MV-N/RNA*sample illustrates the data obtained when the X RNA fragment was excised from the polyacrylamide gel before deep sequencing analysis. (C) High-throughput sequencing analysis of MV-N-associated RNA from MV-infected cells. MV-N/RNA and CH/RNA from MV-infected cells (red and yellow, respectively) were subjected to Illumina high-throughput sequencing. Sequencing reads were mapped to the virus genome and only the first nucleotide was retained. The Y-axis shows in logarithmic scale the number of reads that begin at a particular position. (D) Comparison of the number of sequences that map to the X RNA fragment of the MV genome and to the rest of the MV genome for the MV-N/RNA and MV-N/RNA* samples.
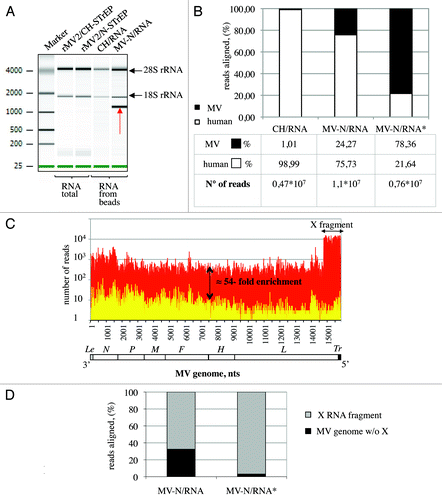
Figure 2. Analysis of purified MV-N RNA partners. (A) Agilent eukaryotic total RNA assay of MV-N/RNA samples reveals a distinct band slightly above 1,000 nucleotides. Total RNA purified from cells infected with rMV2/CH-STrEP or rMV2/N-STrEP viruses or RNA samples after purification on StrepTactin Sepharose beads. (B) Comparison of number of sequences that mapped to MV or human genomes for CH/RNA, and MV-N/RNA samples. MV-N/RNA*sample illustrates the data obtained when the X RNA fragment was excised from the polyacrylamide gel before deep sequencing analysis. (C) High-throughput sequencing analysis of MV-N-associated RNA from MV-infected cells. MV-N/RNA and CH/RNA from MV-infected cells (red and yellow, respectively) were subjected to Illumina high-throughput sequencing. Sequencing reads were mapped to the virus genome and only the first nucleotide was retained. The Y-axis shows in logarithmic scale the number of reads that begin at a particular position. (D) Comparison of the number of sequences that map to the X RNA fragment of the MV genome and to the rest of the MV genome for the MV-N/RNA and MV-N/RNA* samples.

Figure 3. Characterization of the 5′ copy-back RNA molecule interacting with MV-N. (A) Model for the origin of the 1,212 nucleotide-long DI-RNA of MV. Following premature termination of (-) strand synthesis, the polymerase, with the nascent strand attached, resumes synthesis at a specific internal site and forms the complementary “stem” structure. Anti-leader (Le’) and anti-trailer (Tr’) sequences are shown as light gray and dark gray rectangles, respectively, and trail sequence (Tr), as a black rectangle. “P” stands for the viral polymerase complex. Positions and directions of A, B and C primers are shown. (B) RT-PCR amplification of the 5′ copy-back DI-RNA or the MV genome fragment from the MV-N/RNA complex and CH/RNA control. RT-PCRs were performed using DI-RNA-specific primers (A and C) or standard genome-specific primers (A and B) (see Materials and Methods and ref. Citation9). (C) Exact sequence of the 5′ copy-back 1,212 nucleotide-long DI genome of MV. Nucleotides at the position where viral polymerase resumes synthesis to transcribe the complementary “stem” structure are indicated and shown in bold. (D) Agilent eukaryotic total RNA analysis of MV-N/RNA samples shows protection by MV-N protein of a bulk of the 5′ copy-back DI-RNA from digestion by RNase A and RNase T1. MV-N and CH RNA samples after purification on StrepTactin Sepharose beads were incubated with serial dilutions of RNase A/T1 mix before RNA extraction. The table above the figure shows RNase A and T1 concentrations in each sample.
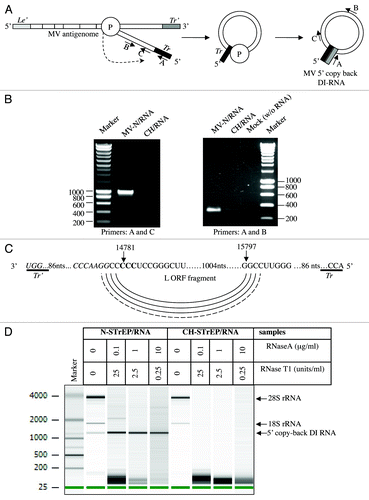
Figure 3. Characterization of the 5′ copy-back RNA molecule interacting with MV-N. (A) Model for the origin of the 1,212 nucleotide-long DI-RNA of MV. Following premature termination of (-) strand synthesis, the polymerase, with the nascent strand attached, resumes synthesis at a specific internal site and forms the complementary “stem” structure. Anti-leader (Le’) and anti-trailer (Tr’) sequences are shown as light gray and dark gray rectangles, respectively, and trail sequence (Tr), as a black rectangle. “P” stands for the viral polymerase complex. Positions and directions of A, B and C primers are shown. (B) RT-PCR amplification of the 5′ copy-back DI-RNA or the MV genome fragment from the MV-N/RNA complex and CH/RNA control. RT-PCRs were performed using DI-RNA-specific primers (A and C) or standard genome-specific primers (A and B) (see Materials and Methods and ref. Citation9). (C) Exact sequence of the 5′ copy-back 1,212 nucleotide-long DI genome of MV. Nucleotides at the position where viral polymerase resumes synthesis to transcribe the complementary “stem” structure are indicated and shown in bold. (D) Agilent eukaryotic total RNA analysis of MV-N/RNA samples shows protection by MV-N protein of a bulk of the 5′ copy-back DI-RNA from digestion by RNase A and RNase T1. MV-N and CH RNA samples after purification on StrepTactin Sepharose beads were incubated with serial dilutions of RNase A/T1 mix before RNA extraction. The table above the figure shows RNase A and T1 concentrations in each sample.

Figure 4. In spite of strong enhancement of the MV DI-RNA production due to the insertion of the second copy of the N protein within the MV genome, the 5′ copy-back DI-RNA specifically interacts with the MV nucleocapsid. (A) Efficient production of the 1,212 nucleotide-long 5′ copy-back MV DI-RNA by rMV2/N-STrEP in four different cell lines. Total RNA (20 ng) was analyzed by RT-qPCR. Absolute quantification of DI-RNA was performed using serial dilutions of in vitro transcribed MV DI-RNA. Samples were analyzed in triplicates, with standard deviation represented on the figure, and two biological replicates were performed each time. (B) Production of the 1,212 nucleotide DI genome and the full-length genome by recombinant MV expressing the second copy of MV-N. 293T cells were infected with either rMV2/N-STrEP, or a low-passage Schwarz vaccine strain of MV, or a Schwarz vaccine strain grown for five consecutive passages at a MOI of 1. Total RNA was purified and 1 μg of each RNA sample was analyzed by RT-qPCR against either the 1,212 nucleotide-long DI-RNA or the full-length MV genome. Absolute quantification was performed using serial dilutions of the in vitro transcribed MV DI-RNA or the MV genome RNA fragment. Samples were analyzed in triplicates, with standard deviation represented on the figure, and two biological replicates were performed each time. (C) Affinity chromatography of 1-STrEP tagged viral proteins form infected cells is an efficient and specific approach to purify RNA partners of viral proteins. Results of RT-qPCR against the 1,212 nucleotide-long DI-RNA on 10 ng of RNA purified complexed with the MV-N protein were compared with data obtained for 10 ng of total RNA (before purification). Absolute quantification was performed as described in (A). As negative control one-step RT-qPCR against the β-actin mRNA was performed with absolute quantification using serial dilutions of in vitro transcribed RNA fragments encompassing the β-actin sequence. Samples were analyzed in triplicates and two biological replicates were performed.
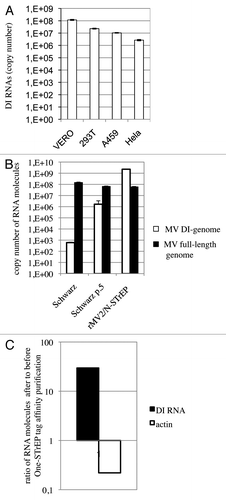
Figure 4. In spite of strong enhancement of the MV DI-RNA production due to the insertion of the second copy of the N protein within the MV genome, the 5′ copy-back DI-RNA specifically interacts with the MV nucleocapsid. (A) Efficient production of the 1,212 nucleotide-long 5′ copy-back MV DI-RNA by rMV2/N-STrEP in four different cell lines. Total RNA (20 ng) was analyzed by RT-qPCR. Absolute quantification of DI-RNA was performed using serial dilutions of in vitro transcribed MV DI-RNA. Samples were analyzed in triplicates, with standard deviation represented on the figure, and two biological replicates were performed each time. (B) Production of the 1,212 nucleotide DI genome and the full-length genome by recombinant MV expressing the second copy of MV-N. 293T cells were infected with either rMV2/N-STrEP, or a low-passage Schwarz vaccine strain of MV, or a Schwarz vaccine strain grown for five consecutive passages at a MOI of 1. Total RNA was purified and 1 μg of each RNA sample was analyzed by RT-qPCR against either the 1,212 nucleotide-long DI-RNA or the full-length MV genome. Absolute quantification was performed using serial dilutions of the in vitro transcribed MV DI-RNA or the MV genome RNA fragment. Samples were analyzed in triplicates, with standard deviation represented on the figure, and two biological replicates were performed each time. (C) Affinity chromatography of 1-STrEP tagged viral proteins form infected cells is an efficient and specific approach to purify RNA partners of viral proteins. Results of RT-qPCR against the 1,212 nucleotide-long DI-RNA on 10 ng of RNA purified complexed with the MV-N protein were compared with data obtained for 10 ng of total RNA (before purification). Absolute quantification was performed as described in (A). As negative control one-step RT-qPCR against the β-actin mRNA was performed with absolute quantification using serial dilutions of in vitro transcribed RNA fragments encompassing the β-actin sequence. Samples were analyzed in triplicates and two biological replicates were performed.

Figure 5. The 1,212 nucleotide-long 5′ copy-back MV DI-RNA triggers efficient IFN type I production via RIG-I. (A) Immunostimulatory activity of RNA from MV-N upon transfection into STING-37 cells. MV-N affinity chromatography-purified RNAs were compared with RNAs purified from negative control (CH)-tagged protein. Samples were analyzed in triplicates with standard deviation represented on the figure, and two biological replicates were performed. (B) The 1,212 nucleotide-long DI genome of MV induces RIG-I mediated type-I IFN signaling. STING-37 reporter cells were transfected with siRNA targeting RIG-I, MDA-5, MAVS or TPR (negative control) or mock transfected. Second transfection of the cells was performed 48 h later with either 1,212 nucleotide-long MV DI-RNA, poly(IC) or 5′PPP-bearing short RNA. Luciferase induction fold is expressed as the ratio of luciferase measured within stimulated by second RNA transfection cells to the ratio of luciferase in cells left without the second transfection. Samples were analyzed in triplicates and two biological replicates were performed. The SEMs are shown in the figure.
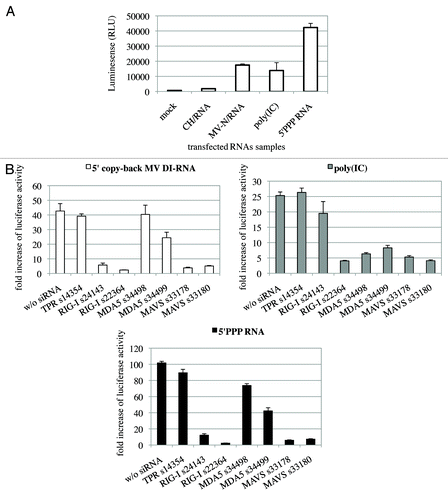
Figure 5. The 1,212 nucleotide-long 5′ copy-back MV DI-RNA triggers efficient IFN type I production via RIG-I. (A) Immunostimulatory activity of RNA from MV-N upon transfection into STING-37 cells. MV-N affinity chromatography-purified RNAs were compared with RNAs purified from negative control (CH)-tagged protein. Samples were analyzed in triplicates with standard deviation represented on the figure, and two biological replicates were performed. (B) The 1,212 nucleotide-long DI genome of MV induces RIG-I mediated type-I IFN signaling. STING-37 reporter cells were transfected with siRNA targeting RIG-I, MDA-5, MAVS or TPR (negative control) or mock transfected. Second transfection of the cells was performed 48 h later with either 1,212 nucleotide-long MV DI-RNA, poly(IC) or 5′PPP-bearing short RNA. Luciferase induction fold is expressed as the ratio of luciferase measured within stimulated by second RNA transfection cells to the ratio of luciferase in cells left without the second transfection. Samples were analyzed in triplicates and two biological replicates were performed. The SEMs are shown in the figure.

Figure 6. RIG-I, MDA5 and MAVS mRNA levels in knockdown STING-37 cells. Total RNA was extracted from cells previously transfected with siRIG-I, siMDA5 or siMAVS STING-37 cell line, and the levels of RIG-I, MDA5 and MAVS mRNA were quantified by one-step RT-qPCR. The data were normalized to the GAPDH mRNA levels and expressed as relative levels of mRNA compared with cells without siRNA transfection (siCTRL). The mean value in STING-37 cells mock-transfected with siRNA was set at 100% of gene expression.
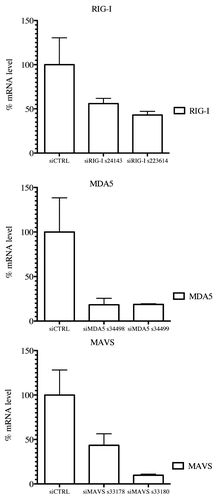
Figure 6. RIG-I, MDA5 and MAVS mRNA levels in knockdown STING-37 cells. Total RNA was extracted from cells previously transfected with siRIG-I, siMDA5 or siMAVS STING-37 cell line, and the levels of RIG-I, MDA5 and MAVS mRNA were quantified by one-step RT-qPCR. The data were normalized to the GAPDH mRNA levels and expressed as relative levels of mRNA compared with cells without siRNA transfection (siCTRL). The mean value in STING-37 cells mock-transfected with siRNA was set at 100% of gene expression.
Supplemental material

Additional material

Download Zip (3 MB)

Reprints and Corporate Permissions

Please note: Selecting permissions does not provide access to the full text of the article, please see our help page How do I view content?

To request a reprint or corporate permissions for this article, please click on the relevant link below:

Academic Permissions

Please note: Selecting permissions does not provide access to the full text of the article, please see our help page How do I view content?

Obtain permissions instantly via Rightslink by clicking on the button below:

If you are unable to obtain permissions via Rightslink, please complete and submit this Permissions form. For more information, please visit our Permissions help page.