Figures & data
Figure 1. svtRNA2-1a expression in different brain regions from control individuals and PD cases stages 4 and 5 (motor stages of PD). svtRNA2-1a levels are shown in the amygdala (A), substantia nigra (B), frontal cortex (C) and cerebellum (D). svtRNA2_1 expression levels are referred to a control sample, for relative quantification (RQ). Plots show individual and mean RQ ± SEM (*, p < 0.05; **, p < 0.01; *** using a linear mixed effects model, LMM).
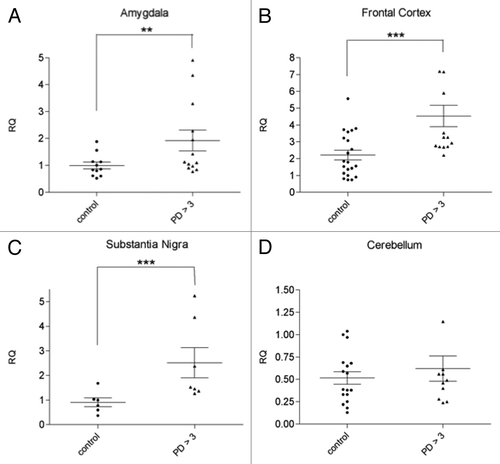
Figure 2. svtRNA2-1a expression in brain samples of pre-motor PD cases (stages 1–3) svtRNA2-1a expression levels in control, pre-motor PD (stages 1, 2 and 3) and clinical PD (stages 4 and 5) in the amygdala (A) and frontal cortex (B). Expression levels are referred to a control sample, for relative quantification (RQ). Plots show individual and mean RQ ± SEM (*, p < 0.05; **, p < 0.01 using a linear mixed effects model).
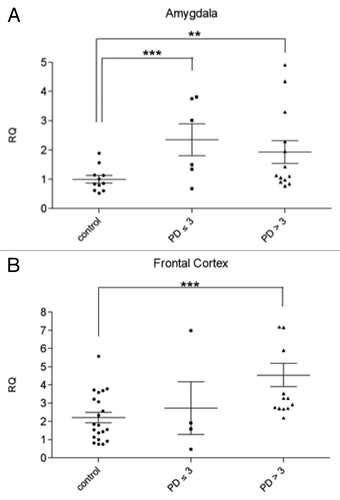
Figure 3. svtRNA2-1a biogenesis is dependent on Dicer. (A) Plots show relative expression of Dicer and Drosha assessed by rRT-PCR. Mean fold change ± SEM, 24 and 48 h after transfection of specific siRNAs against Dicer (DCR), Drosha (Dsh) or a scrambled siRNA (scr); all values are referred to lipofectamine-only treated (n = 4; *, p value < 0.05, using LMM). (B) Plots show relative expression of svtRNA2-1a assessed by rRT-PCR. Mean fold change ± SEM 24 h after transfection of specific siRNAs against Dicer (DCR), Drosha (Dsh) or a scrambled siRNA (scr), lipofectamine only treated cells were used as the reference (n = 4; *, p value < 0.05 using LMM). Graphs show mean fold change (n = 4) 24 h after either Dicer or Drosha depletion. (C) Fold-changes in miRBase miRNAs after Dicer silencing in MCF-7 cell line, measured by high-throughput sequencing. The line indicates the reduction fold change for svtRNA2-1a. (D) VTRNA2-1 structure and putative biogenesis of svtRNA2-1a by Dicer cropping. SvtRNA2-1 sequencing reads alignment to vtRNA2-1 precursor, in a 34 d old small RNA sequencing data set, of the human brain. VTRNA2-1 secondary structure is shown and the different regions that define a typical miRNA precursor are highlighted in colors. The major strand (svtRNA2-1a) is shown in red, the minor strand in purple (svtRNA2-1a*) and the intervening loop in yellow. The density plot shows the distribution of sequencing reads. Below, the positions of individual sequences are shown. The column labeled “reads” indicate how many times the sequence was detected.
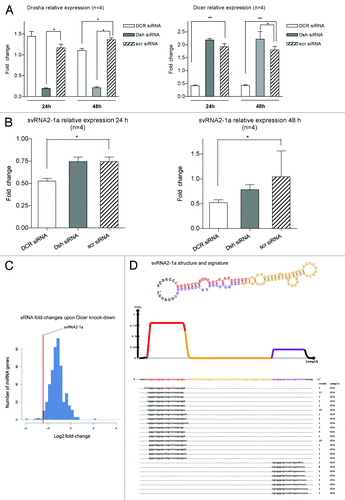
Figure 4. svtRNA2-1a is enriched in Ago complexes. (A and B) Expression of svtRNA2-1a in Ago2 immunocomplexes in SH-SY5Y cells. Plot shows mean Log RQ (relative quantity) ± SEM, for svtRNA2-1a (A) and miR-16 (B) assessed by rRT-PCR in Ago2-immunoprecipitates or control-immunoprecipitates in three independent immunoprecipitation experiments (**, p < 0.01). (C) svtRNA2-1a distribution in different Ago proteins. The expression of svtRNA2-1a was determined in immunoprecipitated Ago1, Ago2 and Ago3 complexes and total cell extracts from monocytic THP-1 human cells, using public sncRNA sequencing data. Norm frequency indicates the normalized frequency calculated as freq. svtRNA2-1a/freq. miRNAs * 10E6.
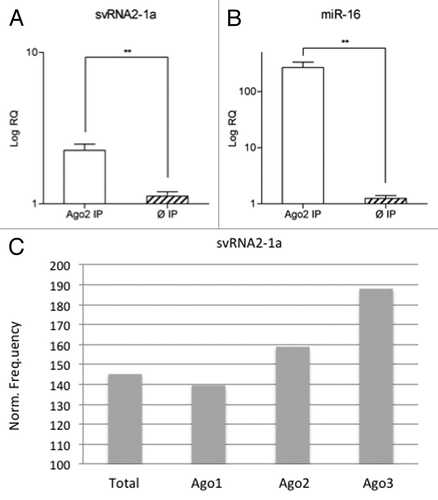
Table 1. Deregulated protein-coding transcripts upon svRNA2-1a overexpression (in bold selected for rRT-PCR validation)
Table 2. Deregulated linc-RNAs upon svRNA2-1a overexpression
Table 3. rRT-PCR validation of selected protein-coding transcripts deregulation upon svRNA2-1a overexpression
Figure 5. svtRNA2-1a expression in human brain development and aging. svtRNA2-1a expression in the human brain detected by sncRNA sequencing. The time points are: 2 d after birth, 4 d, 34 d, 204 d, 8 y, 13 y, 25 y, 53 d, 66 y, 88 y and 98 y. Expression has been normalized to the number of miRNA sequencing reads.
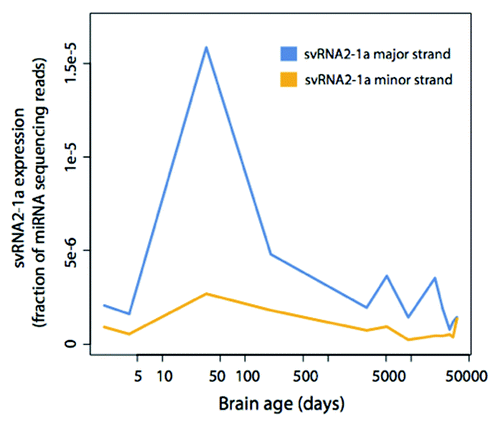
Figure 6. svtRNA2-1a overexpression reduces neuronal basal viability. Plot shows relative cell viability assessed with MTT assays at 24, 48 and 72 h after transfection of either svtRNA2-1a mimic or a scrambled miRNA mimic (SCR), using lipofectamine only (Ø) treated cells as negative control and reference. Data represent mean basal viability ± SEM [n = 6; (**, p < 0.01, ***, p < 0.001 using t-test)].
![Figure 6. svtRNA2-1a overexpression reduces neuronal basal viability. Plot shows relative cell viability assessed with MTT assays at 24, 48 and 72 h after transfection of either svtRNA2-1a mimic or a scrambled miRNA mimic (SCR), using lipofectamine only (Ø) treated cells as negative control and reference. Data represent mean basal viability ± SEM [n = 6; (**, p < 0.01, ***, p < 0.001 using t-test)].](/cms/asset/cd97e7d6-d741-45ba-aad3-400ab0188d29/krnb_a_10924813_f0006.gif)