1,141
Views
40
CrossRef citations to date
0
Altmetric
Research Paper

miR-25 and miR-92a regulate insulin I biosynthesis in rats

, , , &
Pages 1365-1378 | Received 25 Apr 2013, Accepted 26 Jun 2013, Published online: 27 Jun 2013

Figures & data

Table 1. miRNAs predicted to target the 3′UTR rat insulin I

Figure 1. Sequence of rat insulin I mRNA. (A) The complete sequence of rat insulin I mRNA (463 nucleotides long) was obtained from NCBI (NM_019129.3). The 3′UTR region is located between 391–463 nucleotides (underlined). The seed region of the miR-25/32/363/92a/92b family is highlighted in gray. Sequence of specific primers used to amplify the 3′UTR region is shown in bold italics. Core binding region of PTBP1 is shown in a box. (B) miR-25 and miR-92a consensus binding sequence in rat and mouse. Binding of miR-25 and miR-92a at the 3′UTR of rat and mouse insulin are predicted by either miRWalk or miRanda or both. Although the programs did not include prediction for rat insulin II, the seed region of miR-25 and miR-92a is conserved in rat and mouse for both insulin I and II. The PTBP1 binding site is underlined. The sequences corresponding to human insulin and the partially overlapping seed region and PTBP1 binding site are also shown.
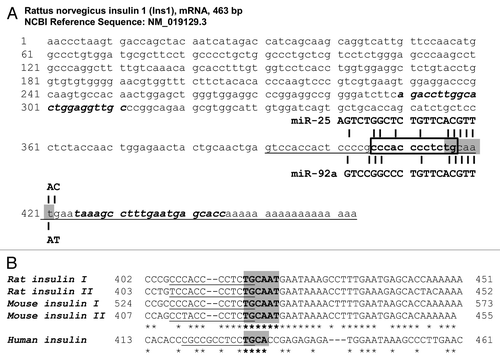
Figure 1. Sequence of rat insulin I mRNA. (A) The complete sequence of rat insulin I mRNA (463 nucleotides long) was obtained from NCBI (NM_019129.3). The 3′UTR region is located between 391–463 nucleotides (underlined). The seed region of the miR-25/32/363/92a/92b family is highlighted in gray. Sequence of specific primers used to amplify the 3′UTR region is shown in bold italics. Core binding region of PTBP1 is shown in a box. (B) miR-25 and miR-92a consensus binding sequence in rat and mouse. Binding of miR-25 and miR-92a at the 3′UTR of rat and mouse insulin are predicted by either miRWalk or miRanda or both. Although the programs did not include prediction for rat insulin II, the seed region of miR-25 and miR-92a is conserved in rat and mouse for both insulin I and II. The PTBP1 binding site is underlined. The sequences corresponding to human insulin and the partially overlapping seed region and PTBP1 binding site are also shown.

Table 2. Expression of selected miRNAs in the rat pancreatic tissue and islets

Figure 2A–B. Direct inhibitory effect of miR-25 and miR-92a on Ins1. (A) Dual-Luciferase ® reporter assay quantitation of the effects of anti- or pre-miR-25 or miR-92a interaction with the wild-type and mutated 3′ UTR of Ins1. For the mutated construct, the target sequence 5′-TGCAAT-3′ for the miRNA seed region was mutated to 5′-GCGCCG-3′. The plasmid constructs together with anti or pre miR-25 or miR-92a were co-transfected independently into INS-1 cells. Relative luminescence for luciferase gene activity in treated samples were obtained 48 h post-transfection by normalizing the values against control plasmids transfected with corresponding anti- or pre-scrambled miRNAs. The luminescence for luciferase activity of the controls is considered to be 100%. All transfections of miRNAs were done at 30 nM concentration. Data are presented as mean ± SEM (n = 3) against control. Statistically significant differences are tested using t-test at *p < 0.05 significance. (B) Fold change in the expression of preproinsulin, miR-25 and miR-92a in pancreatic islets and INS-1 cells subjected to increasing glucose concentration (G10, 15, and 20 mM). Data presented as mean ± SEM (n = 3) against control at 5 mM glucose concentration. Statistically significant differences are tested using t-test at p < 0.05 significance. *p < 0.05, **p < 0.01.
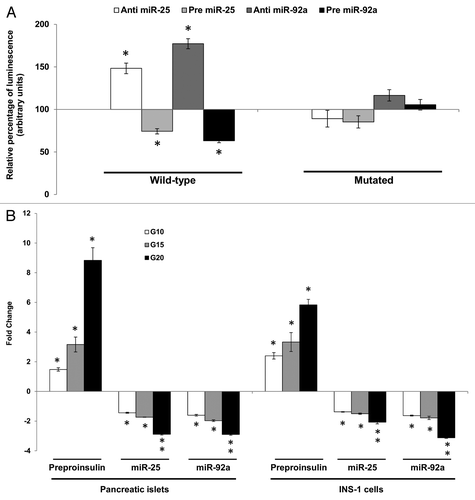
Figure 2A–B. Direct inhibitory effect of miR-25 and miR-92a on Ins1. (A) Dual-Luciferase ® reporter assay quantitation of the effects of anti- or pre-miR-25 or miR-92a interaction with the wild-type and mutated 3′ UTR of Ins1. For the mutated construct, the target sequence 5′-TGCAAT-3′ for the miRNA seed region was mutated to 5′-GCGCCG-3′. The plasmid constructs together with anti or pre miR-25 or miR-92a were co-transfected independently into INS-1 cells. Relative luminescence for luciferase gene activity in treated samples were obtained 48 h post-transfection by normalizing the values against control plasmids transfected with corresponding anti- or pre-scrambled miRNAs. The luminescence for luciferase activity of the controls is considered to be 100%. All transfections of miRNAs were done at 30 nM concentration. Data are presented as mean ± SEM (n = 3) against control. Statistically significant differences are tested using t-test at *p < 0.05 significance. (B) Fold change in the expression of preproinsulin, miR-25 and miR-92a in pancreatic islets and INS-1 cells subjected to increasing glucose concentration (G10, 15, and 20 mM). Data presented as mean ± SEM (n = 3) against control at 5 mM glucose concentration. Statistically significant differences are tested using t-test at p < 0.05 significance. *p < 0.05, **p < 0.01.

Table 3. Changes in expression of miR-25, miR-92a and Ins1 mRNA

Figure 2C–D. (C) Changes in insulin protein in INS-1 cells. INS-1 cells were subjected to increasing glucose concentration (G10, 15, and 20 mM) to study relative changes in insulin protein (left panel). Data presented as mean ± SEM (n = 3) against control at 5 mM glucose concentration. Intracellular insulin content (in white bar) and secreted insulin (in black bar) are normalized to total protein content. Further, the effects of miR-25 and miR-92a on insulin protein were determined by modulating the expression of miRNAs independently (right panel). Following transfections, cells were subjected to high glucose (20 mM). Cells transfected with scrambled miRNAs (anti or pre) followed by the same high glucose (20 mM) treatment were used as corresponding controls. All transfections of miRNAs were done at 30 nM concentration. Data presented as mean ± SEM (n = 3) against control at 20 mM glucose concentration. Intracellular insulin content (in white bar) and secreted insulin (in black bar) are normalized to total protein content. Statistically significant differences are tested using t-test at p < 0.05 significance. *p < 0.05, **p < 0.01. (D) Insulin I immunoreactives in INS-1 cells transfected with either anti or pre miR-25 or miR-92a. The cells were fixed and immunolabeled with insulin I antibody (green) and nuclear stain Hoechst 33342 (blue). The data presented here is a representative of three independent experiments. Fluorescence signal quantitation was performed according to Su et al.Citation60 using Varioskan® Flash (Thermo Scientific), whereby FITC fluorescence is measured at excitation 490 nm and emission 525 nm. Each signal is normalized to the number of cells by Hoechst 33342 fluorescence measured at excitation 346 nm and emission 460 nm. Relative fluorescence were obtained 48 h post-transfection by normalizing the values against cells transfected with corresponding anti- or pre-scrambled miRNAs. The fluorescence of the controls is considered to be 100%. All transfections of miRNAs were done at 30nM concentration. Data are presented as mean ± SEM (n = 3) against control. Statistically significant differences are tested using t-test at *p < 0.05 significance.
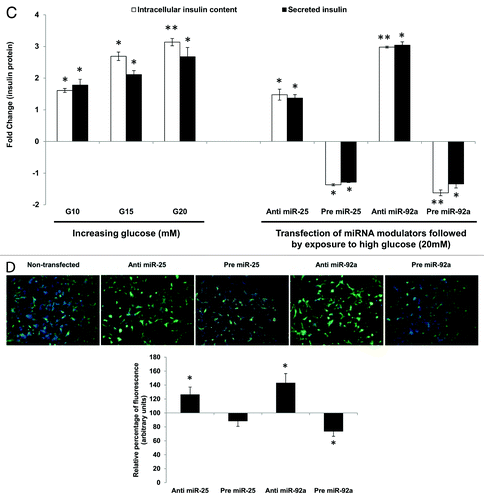
Figure 2C–D. (C) Changes in insulin protein in INS-1 cells. INS-1 cells were subjected to increasing glucose concentration (G10, 15, and 20 mM) to study relative changes in insulin protein (left panel). Data presented as mean ± SEM (n = 3) against control at 5 mM glucose concentration. Intracellular insulin content (in white bar) and secreted insulin (in black bar) are normalized to total protein content. Further, the effects of miR-25 and miR-92a on insulin protein were determined by modulating the expression of miRNAs independently (right panel). Following transfections, cells were subjected to high glucose (20 mM). Cells transfected with scrambled miRNAs (anti or pre) followed by the same high glucose (20 mM) treatment were used as corresponding controls. All transfections of miRNAs were done at 30 nM concentration. Data presented as mean ± SEM (n = 3) against control at 20 mM glucose concentration. Intracellular insulin content (in white bar) and secreted insulin (in black bar) are normalized to total protein content. Statistically significant differences are tested using t-test at p < 0.05 significance. *p < 0.05, **p < 0.01. (D) Insulin I immunoreactives in INS-1 cells transfected with either anti or pre miR-25 or miR-92a. The cells were fixed and immunolabeled with insulin I antibody (green) and nuclear stain Hoechst 33342 (blue). The data presented here is a representative of three independent experiments. Fluorescence signal quantitation was performed according to Su et al.Citation60 using Varioskan® Flash (Thermo Scientific), whereby FITC fluorescence is measured at excitation 490 nm and emission 525 nm. Each signal is normalized to the number of cells by Hoechst 33342 fluorescence measured at excitation 346 nm and emission 460 nm. Relative fluorescence were obtained 48 h post-transfection by normalizing the values against cells transfected with corresponding anti- or pre-scrambled miRNAs. The fluorescence of the controls is considered to be 100%. All transfections of miRNAs were done at 30nM concentration. Data are presented as mean ± SEM (n = 3) against control. Statistically significant differences are tested using t-test at *p < 0.05 significance.

Figure 3. Regulatory effects of miR-25 and miR-92a on insulin synthesis overrides that of miR-9 in the downstream insulin secretion. Changes in insulin protein in INS-1 cells with the corresponding transfection as shown above followed by high glucose treatment (20 mM). In the left panel, cells were first transfected with anti-miR-9 followed by independent transfection of anti or pre miR-25 or miR-92a . Cells transfected with anti-miR-9 and corresponding scrambled miRNAs (anti or pre) followed by the same high glucose (20 mM) treatment were used as controls). In the right panel, cells were first transfected with pre miR-9 followed by independent transfection of anti or pre miR-25 or miR-92a. Cells transfected with pre miR-9 and corresponding scrambled miRNAs (anti or pre) followed by the same high glucose (20 mM) treatment were used as controls. All transfections of miRNAs were done at 30 nM concentration. Positive sign (+) indicates presence of corresponding anti- or pre-miRNAs while negative sign (–) indicates absence. Data presented as mean ± SEM (n = 3) against corresponding controls. Intracellular insulin content (in white bar) and secreted insulin (in black bar) are normalized to total protein content. Statistically significant differences are tested using t-test at *p < 0.05 significance.
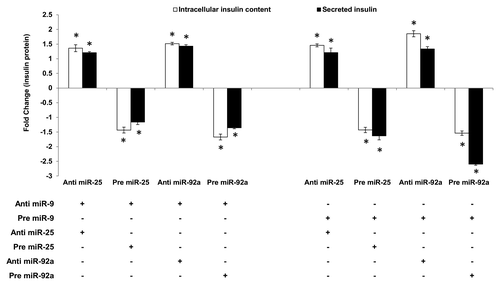
Figure 3. Regulatory effects of miR-25 and miR-92a on insulin synthesis overrides that of miR-9 in the downstream insulin secretion. Changes in insulin protein in INS-1 cells with the corresponding transfection as shown above followed by high glucose treatment (20 mM). In the left panel, cells were first transfected with anti-miR-9 followed by independent transfection of anti or pre miR-25 or miR-92a . Cells transfected with anti-miR-9 and corresponding scrambled miRNAs (anti or pre) followed by the same high glucose (20 mM) treatment were used as controls). In the right panel, cells were first transfected with pre miR-9 followed by independent transfection of anti or pre miR-25 or miR-92a. Cells transfected with pre miR-9 and corresponding scrambled miRNAs (anti or pre) followed by the same high glucose (20 mM) treatment were used as controls. All transfections of miRNAs were done at 30 nM concentration. Positive sign (+) indicates presence of corresponding anti- or pre-miRNAs while negative sign (–) indicates absence. Data presented as mean ± SEM (n = 3) against corresponding controls. Intracellular insulin content (in white bar) and secreted insulin (in black bar) are normalized to total protein content. Statistically significant differences are tested using t-test at *p < 0.05 significance.

Figure 4. Altered expression of miR-25, miR-92a and preproinsulin in diabetic rat pancreas. Total RNA was isolated from pancreatic tissue of diabetic rat model. Expression of miR-25, miR-92a, and insulin I was measured by qPCR relative to healthy control rats. Data are presented as mean ± SEM with n = 6. Statistically significant differences are tested using t-test at *p < 0.05 significance.
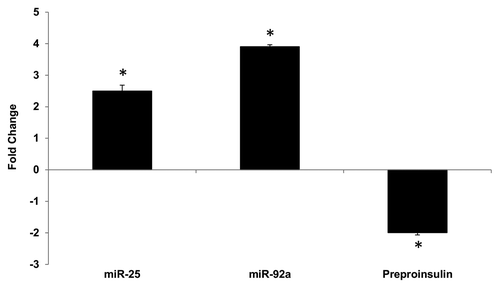
Figure 4. Altered expression of miR-25, miR-92a and preproinsulin in diabetic rat pancreas. Total RNA was isolated from pancreatic tissue of diabetic rat model. Expression of miR-25, miR-92a, and insulin I was measured by qPCR relative to healthy control rats. Data are presented as mean ± SEM with n = 6. Statistically significant differences are tested using t-test at *p < 0.05 significance.

Figure 5. Regulatory effects of miR-25 and miR-92a occur independent of PTBP1 binding. (A) Wild-type and mutated PTBP1 core binding site in 3′UTR of rat insulin I were constructed into luciferase vector (Table S4). Dual luciferase assay (48 h post- transfection) was performed to study the effects of anti or pre miR-25 or miR-92a or miR-133a interaction with the 3′ UTR of Ins1. The plasmid constructs together with anti or pre miR-25 or miR-92a or miR-133a were co-transfected independently into INS-1 cells. Relative luminescence was obtained by normalizing the values against control plasmids transfected with corresponding anti or pre scrambled miRNAs. pMIR-REPORTTM without any 3′UTR insert. The luminescence for luciferase activity of the controls is considered to be 100%. All transfections of miRNAs were done at 30 nM concentration Data presented as mean ± SEM with n = 3. Statistically significant differences are tested using t-test at *p < 0.05 significance. (B) Relative expression of PTBP1 in the pancreas of diabetic rats. Expression of Ptbp1 mRNA was measured in the pancreas of diabetic rats relative to normal rats. Western blot analysis of PTBP1 protein in the pancreatic tissue of normal and diabetic rats is also shown (see insert). The data presented here is a representative of six independent experiments (n = 12, six normal rats and six diabetic rats). Statistically significant differences are tested using t-test at *p < 0.05 significance.
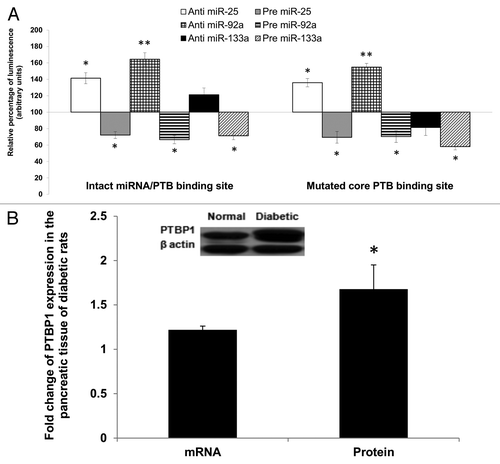
Figure 5. Regulatory effects of miR-25 and miR-92a occur independent of PTBP1 binding. (A) Wild-type and mutated PTBP1 core binding site in 3′UTR of rat insulin I were constructed into luciferase vector (Table S4). Dual luciferase assay (48 h post- transfection) was performed to study the effects of anti or pre miR-25 or miR-92a or miR-133a interaction with the 3′ UTR of Ins1. The plasmid constructs together with anti or pre miR-25 or miR-92a or miR-133a were co-transfected independently into INS-1 cells. Relative luminescence was obtained by normalizing the values against control plasmids transfected with corresponding anti or pre scrambled miRNAs. pMIR-REPORTTM without any 3′UTR insert. The luminescence for luciferase activity of the controls is considered to be 100%. All transfections of miRNAs were done at 30 nM concentration Data presented as mean ± SEM with n = 3. Statistically significant differences are tested using t-test at *p < 0.05 significance. (B) Relative expression of PTBP1 in the pancreas of diabetic rats. Expression of Ptbp1 mRNA was measured in the pancreas of diabetic rats relative to normal rats. Western blot analysis of PTBP1 protein in the pancreatic tissue of normal and diabetic rats is also shown (see insert). The data presented here is a representative of six independent experiments (n = 12, six normal rats and six diabetic rats). Statistically significant differences are tested using t-test at *p < 0.05 significance.

Figure 6. A proposed mechanism for the concerted regulatory function of miR-25 and miR-92a in insulin biosynthesis. miR-25 and miR-92a are direct negative regulators of insulin I expression. In a healthy condition, glucose stimulation promotes downregulation of miR-25 and miR-92a. In a diabetic condition, upregulation of miR-25 and miR-92a suppresses insulin expression by binding to the 3′UTR. Consequently, this results in reduced insulin synthesis as well as insulin secretion.
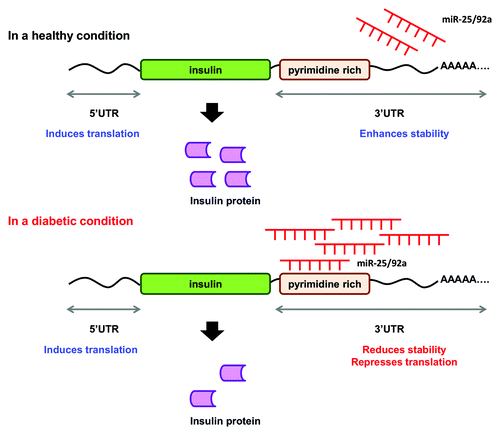
Figure 6. A proposed mechanism for the concerted regulatory function of miR-25 and miR-92a in insulin biosynthesis. miR-25 and miR-92a are direct negative regulators of insulin I expression. In a healthy condition, glucose stimulation promotes downregulation of miR-25 and miR-92a. In a diabetic condition, upregulation of miR-25 and miR-92a suppresses insulin expression by binding to the 3′UTR. Consequently, this results in reduced insulin synthesis as well as insulin secretion.
Supplemental material

Additional material

Download Zip (410.7 KB)

Reprints and Corporate Permissions

Please note: Selecting permissions does not provide access to the full text of the article, please see our help page How do I view content?

To request a reprint or corporate permissions for this article, please click on the relevant link below:

Academic Permissions

Please note: Selecting permissions does not provide access to the full text of the article, please see our help page How do I view content?

Obtain permissions instantly via Rightslink by clicking on the button below:

If you are unable to obtain permissions via Rightslink, please complete and submit this Permissions form. For more information, please visit our Permissions help page.