Figures & data
Figure 1. (A) 3D structure of the DAse ribozyme bound to a Diels-Alder product (adapted from PDB: 1YKV). The 3′ end of the DAse was labeled with Cy5. (B) Labeling on the DAse does not hamper its catalytic activity where DAse-3′-Cy5 (red line) had similar activity compared to unlabeled DAse (blue line). The activity was measured by a fluorescence assay using 1-AB (5 µM) and NPM (500 µM) as substrates (DAse: 0.67 µM). The increase in fluorescence (Ex: 460 nm Em: 510 nm) is due to disruption of the anthracene π-system, which quenched BODIPY fluorescence due to photoinduced electron transfer (PeT). Uncatalyzed background reaction (kapp,background = [0.036 ± 0.008] 10−5 s−1 - black line) and photoreaction (kapp,photo = [0.03 ± 0.01] 10−5 s−1 - green line) were significantly slow compared to the catalyzed reactions.
![Figure 1. (A) 3D structure of the DAse ribozyme bound to a Diels-Alder product (adapted from PDB: 1YKV). The 3′ end of the DAse was labeled with Cy5. (B) Labeling on the DAse does not hamper its catalytic activity where DAse-3′-Cy5 (red line) had similar activity compared to unlabeled DAse (blue line). The activity was measured by a fluorescence assay using 1-AB (5 µM) and NPM (500 µM) as substrates (DAse: 0.67 µM). The increase in fluorescence (Ex: 460 nm Em: 510 nm) is due to disruption of the anthracene π-system, which quenched BODIPY fluorescence due to photoinduced electron transfer (PeT). Uncatalyzed background reaction (kapp,background = [0.036 ± 0.008] 10−5 s−1 - black line) and photoreaction (kapp,photo = [0.03 ± 0.01] 10−5 s−1 - green line) were significantly slow compared to the catalyzed reactions.](/cms/asset/ba897881-c849-41a6-85fe-310a8dd32c89/krnb_a_10927101_f0001.gif)
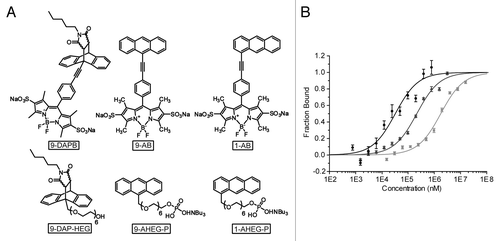
Figure 2. Comparison of substrates and product of the DAse used in FCS and MST measurements. (A) Fluorescent BODIPY molecules used for FCS measurements,Citation12 first row, and non-fluorescent analogs for MST measurements, second row (B) MST analysis of DAse-3′-Cy5 (50 nM) binding to 9-DAP-HEG (black circles), 1-AHEG-P (dark gray triangles), and 9-AHEG-P (light gray squares). The solid curves are the fit of the data points to the Hill equation (n = 1). The error bars represent the standard error in triplicate measurements.

Table 1. Comparison of dissociation constants determined by FCS and MST techniques
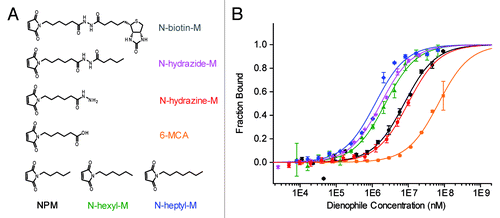
Figure 3. (A) Reactive maleimide dienophile substrates. (B) Binding of maleimide dienophiles to 50 nM DAse-3′-Cy5 (N-heptyl-M, blue diamonds; N-hydrazide-M, magenta stars; N-hexyl-M, green triangles; NPM, black circles; N-hydrazine-M, red pentagons; 6-MCA, orange squares) The solid curves are the fits of the data points to the Hill equation (n = 1). The orange and red solid curves are only to guide the eye since a plateau could not be reached due to solubility limit of 6-MCA and N-hydrazine-M. Error bars represent the standard error in triplicate measurements.

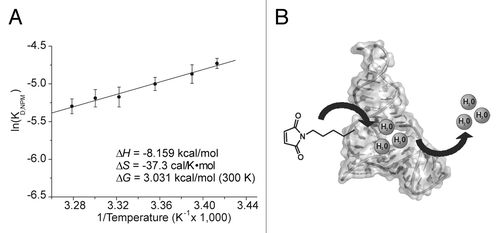
Figure 4. (A) van’t Hoff Plot of NPM dissociation from DAse-3′-Cy5. The dependence of the dissociation constant of NPM to DAse-3′-Cy5 was plotted at different temperatures according to eq 1. The linear fit of the eq 1 (black solid line) yielded a slope of -∆H/R and an intercept at ∆S. The error bars represent the standard deviation in triplicate measurements. (B) Proposed mechanism for NPM binding supported by thermodynamic measurements. The dissociation of water from the catalytic site is the energetic driving force for the dienophile binding.

Figure 5. (A) Binding of NPM (black circles), and NPM in the presence of saturating concentrations of 9-ACA (1.1 mM, gray triangles) to 50 nM DAse-3′-Cy5. (B) The binding of 9-ACA (black pentagons), and 9-ACA in the presence of saturating concentrations of NPM (92 mM, gray squares) to 50 nM DAse-3′-Cy5. For both (A and B), gray and black solid curves are the fits of the data points to the Hill equation (n = 1). The error bars represent the standard error in triplicate measurements. (C) The binding scheme for NPM to the DAse (1), 9-ACA to the DAse (2), NPM to DAse-9-ACA complex (DAse•9-ACA) (3), and 9-ACA to DAse-NPM complex (DAse•NPM) (4). 1–4 are the dissociation constants.
