1,316
Views
14
CrossRef citations to date
0
Altmetric
Research Paper

Regulation of Dscam exon 17 alternative splicing by steric hindrance in combination with RNA secondary structures

, , , , , , & show all
Pages 1822-1833 | Received 03 Apr 2013, Accepted 12 Nov 2013, Published online: 21 Nov 2013

Figures & data

Figure 1. Splicing of exons 17.1 and 17.2 is blocked by the proximity of the branch point to the exon 17.1 splice-donor site in Drosophila. (A) Schematic showing the genomic region of Dscam exons 16–18. A schematic diagram of the partial pre-mRNA with constitutive exons depicted as black boxes, alternative exons as blue boxes, and introns as lines with the spacing indicated (means ± SD). (B) The size of the intervening intron between alternative exons 17.1 and 17.2 across insect species. Cladogram of taxa in this study: Diptera (Drosophila, Culicidae), Lepidoptera, Coleoptera, Hymenoptera, Hemiptera, and Phthiraptera. The correlation of intron size with evolutionary distance between D. melanogaster and other species is shown in the inset. (C) BP mapping in D. melanogaster. Diagram of the primer pair (P1 and P2) for PCR and sequencing. Two arrows represent the position and orientation of the primers used for PCR, with the PCR product shown on the right. The arrows are not drawn to scale. Electropherogram of the sequence containing the branch point (arrow), followed by the alternative 5′-splice site (arrow) in the lariat exons. (D) A sequence alignment of the PCR fragment (blue) and the Dscam gene (black) in D. melanogaster. The end of the alternative 5′-splice site (GT) is covalently linked to an A (the branch point) by a 5′-2' phosphodiester, which is located upstream from the alternative 3′-splice site (AG).
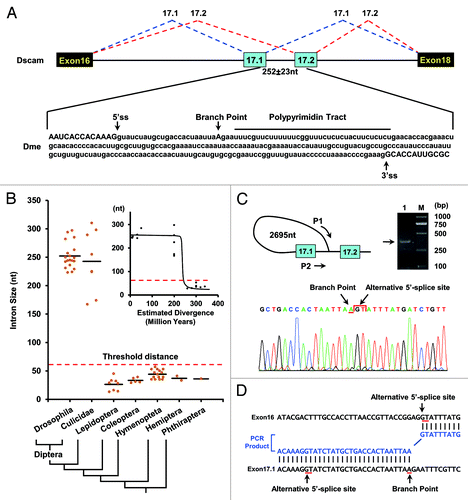
Figure 1. Splicing of exons 17.1 and 17.2 is blocked by the proximity of the branch point to the exon 17.1 splice-donor site in Drosophila. (A) Schematic showing the genomic region of Dscam exons 16–18. A schematic diagram of the partial pre-mRNA with constitutive exons depicted as black boxes, alternative exons as blue boxes, and introns as lines with the spacing indicated (means ± SD). (B) The size of the intervening intron between alternative exons 17.1 and 17.2 across insect species. Cladogram of taxa in this study: Diptera (Drosophila, Culicidae), Lepidoptera, Coleoptera, Hymenoptera, Hemiptera, and Phthiraptera. The correlation of intron size with evolutionary distance between D. melanogaster and other species is shown in the inset. (C) BP mapping in D. melanogaster. Diagram of the primer pair (P1 and P2) for PCR and sequencing. Two arrows represent the position and orientation of the primers used for PCR, with the PCR product shown on the right. The arrows are not drawn to scale. Electropherogram of the sequence containing the branch point (arrow), followed by the alternative 5′-splice site (arrow) in the lariat exons. (D) A sequence alignment of the PCR fragment (blue) and the Dscam gene (black) in D. melanogaster. The end of the alternative 5′-splice site (GT) is covalently linked to an A (the branch point) by a 5′-2' phosphodiester, which is located upstream from the alternative 3′-splice site (AG).

Figure 2. Phylogenetic arrangement of cis intronic elements within the alternative exon 17 cluster of insect Dscam. A schematic diagram of the partial pre-mRNA with constitutive exons depicted as black boxes, alternative exons as blue boxes, and introns as lines. These organisms represent species from four major orders of Insecta: Diptera (Culicidae), Lepidoptera, Coleoptera, and Hymenoptera. Above are sequences of taxonomically restricted consensus elements (IE) of various species (see Table S1 for abbreviations). The most identical nucleotides at each position are indicated by different colors. The conserved intronic elements could pair with an intron-exon boundary sequence of exon 17.1, although their primary sequences diverged. Nucleotide covariations that maintain the structural integrity of the dsRNA are shaded in red. Pictogram of the sequences of the dsRNA stem core in each order are shown on the right.
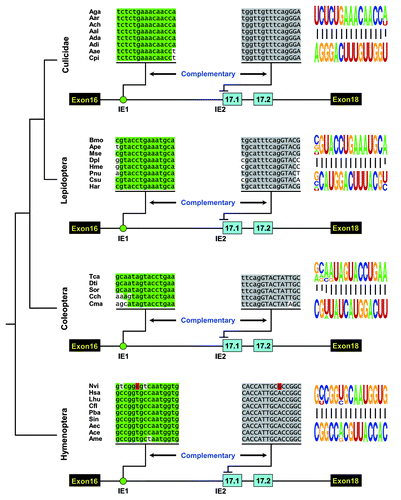
Figure 2. Phylogenetic arrangement of cis intronic elements within the alternative exon 17 cluster of insect Dscam. A schematic diagram of the partial pre-mRNA with constitutive exons depicted as black boxes, alternative exons as blue boxes, and introns as lines. These organisms represent species from four major orders of Insecta: Diptera (Culicidae), Lepidoptera, Coleoptera, and Hymenoptera. Above are sequences of taxonomically restricted consensus elements (IE) of various species (see Table S1 for abbreviations). The most identical nucleotides at each position are indicated by different colors. The conserved intronic elements could pair with an intron-exon boundary sequence of exon 17.1, although their primary sequences diverged. Nucleotide covariations that maintain the structural integrity of the dsRNA are shaded in red. Pictogram of the sequences of the dsRNA stem core in each order are shown on the right.

Figure 3. Intron-exon duplex controls the switching of mutually exclusive exons in the B. mori Dscam exon cluster 17. (A) Genomic organization of B. mori (Bmo) Dscam exon cluster 17. Constitutive exons (in black boxes), Alternative exons (in blue boxes), conserved elements IE1 and IE2 and intron (line) shown. IE1 could pair with IE2. (B) Predicted intron-exon RNA pairing of B. mori pre-mRNA. Disruptive mutations (M1, M2) and compensatory double mutations (M12) were designed to assess the effect of mutation on exon 17 inclusion. Mutations introduced into dsRNA are indicated above or below mutated sequences (M1, M2). (C) Effects of mutations on exon 17 inclusion are indicated for disruptive mutations (M1, M2) and compensatory double mutations (M12). WT, wild type. The RNA was used as an RT-PCR template, and isoform-specific restriction digestion was performed to evaluate the frequency of exon 17.1 utilization. (D) Effects of mutations on exon 17.1 and exon 17.2 selection. (E) Predicted RNA pairing for the wild type and a series of mutants (Mu1-Mu6, point mutations are shown in blue), with the estimated equilibrium of free energy (given in kcal/mol). (F) The strength of RNA pairing modulated exon 17 selection by mutated analysis. (G) Quantitation of the data in panel F. Data are expressed as percentages of the mean ± SD from three independent experiments. Exon 17.1 selection was negatively correlated with the strength of RNA pairing.
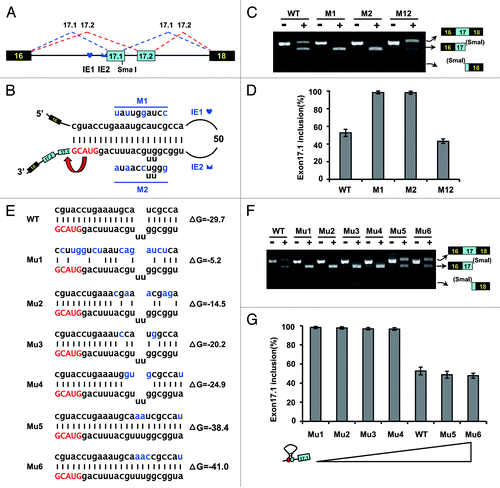
Figure 3. Intron-exon duplex controls the switching of mutually exclusive exons in the B. mori Dscam exon cluster 17. (A) Genomic organization of B. mori (Bmo) Dscam exon cluster 17. Constitutive exons (in black boxes), Alternative exons (in blue boxes), conserved elements IE1 and IE2 and intron (line) shown. IE1 could pair with IE2. (B) Predicted intron-exon RNA pairing of B. mori pre-mRNA. Disruptive mutations (M1, M2) and compensatory double mutations (M12) were designed to assess the effect of mutation on exon 17 inclusion. Mutations introduced into dsRNA are indicated above or below mutated sequences (M1, M2). (C) Effects of mutations on exon 17 inclusion are indicated for disruptive mutations (M1, M2) and compensatory double mutations (M12). WT, wild type. The RNA was used as an RT-PCR template, and isoform-specific restriction digestion was performed to evaluate the frequency of exon 17.1 utilization. (D) Effects of mutations on exon 17.1 and exon 17.2 selection. (E) Predicted RNA pairing for the wild type and a series of mutants (Mu1-Mu6, point mutations are shown in blue), with the estimated equilibrium of free energy (given in kcal/mol). (F) The strength of RNA pairing modulated exon 17 selection by mutated analysis. (G) Quantitation of the data in panel F. Data are expressed as percentages of the mean ± SD from three independent experiments. Exon 17.1 selection was negatively correlated with the strength of RNA pairing.

Figure 4. Effect of predicted RNA structures on Dscam exon 17 splicing in Drosophila. (A) Conserved cis intronic elements within the Dscam exon 17 cluster. A schematic diagram of the partial pre-mRNA with constitutive exons depicted as black boxes, alternative exons as blue boxes, and introns as lines. Above are sequences of consensus intronic elements (for abbreviations, see Table S1). Sequences in an identical color indicate that upstream intronic elements could pair with downstream intronic sequences. (B) The predicted RNA pairings in D. melanogaster. Mutations introduced into dsRNA are indicated above or below mutated sequences (M1-M6). (C) Effect of predicted RNA structures in Dscam exon 17 splicing were tested using disruptive mutations (M1-M6) and compensatory double mutations (M12, M34, and M56). WT, wild-type. (D) Quantitation of the data in panel C. Data are expressed as percentages of the mean ± SD from three independent experiments.
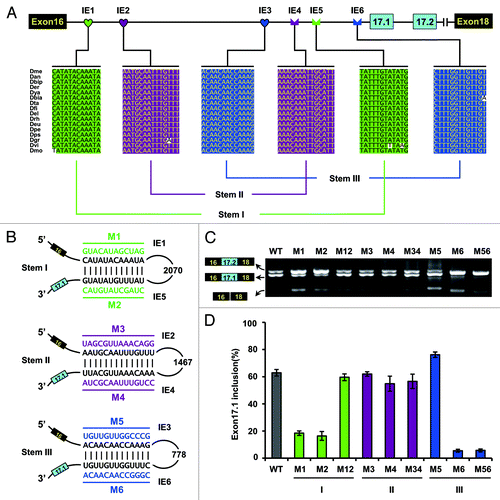
Figure 4. Effect of predicted RNA structures on Dscam exon 17 splicing in Drosophila. (A) Conserved cis intronic elements within the Dscam exon 17 cluster. A schematic diagram of the partial pre-mRNA with constitutive exons depicted as black boxes, alternative exons as blue boxes, and introns as lines. Above are sequences of consensus intronic elements (for abbreviations, see Table S1). Sequences in an identical color indicate that upstream intronic elements could pair with downstream intronic sequences. (B) The predicted RNA pairings in D. melanogaster. Mutations introduced into dsRNA are indicated above or below mutated sequences (M1-M6). (C) Effect of predicted RNA structures in Dscam exon 17 splicing were tested using disruptive mutations (M1-M6) and compensatory double mutations (M12, M34, and M56). WT, wild-type. (D) Quantitation of the data in panel C. Data are expressed as percentages of the mean ± SD from three independent experiments.

Figure 5. Intronic RNA pairing interaction functions through approximating splice sites in D. melanogaster. (A) Schematic diagrams of the minigene constructs used to test the importance of approximating. A red cross in IE1 or IE5 denotes a disrupting mutation. IE1–6 elements are indicated as in the legend to . (B) Effects of a series of deletions and mutations on exon 17.1 selection. Quantitative data are shown and expressed as percentages of the mean ± SD from three independent experiments.
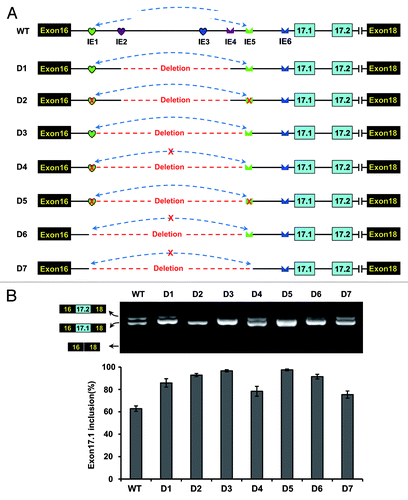
Figure 5. Intronic RNA pairing interaction functions through approximating splice sites in D. melanogaster. (A) Schematic diagrams of the minigene constructs used to test the importance of approximating. A red cross in IE1 or IE5 denotes a disrupting mutation. IE1–6 elements are indicated as in the legend to Figure 4. (B) Effects of a series of deletions and mutations on exon 17.1 selection. Quantitative data are shown and expressed as percentages of the mean ± SD from three independent experiments.

Figure 6. IE6 affects exon 17.1 selection in both structural- and sequence-dependent mode in D. melanogaster. (A) Schematic diagrams of minigene constructs used to assess the role of IE6 in splicing. The branch-point sequence (BPS), polypyrimidine tract (PPT), and the invariant AG at the 3′ ss are shown. M1, mutating IE3 abolished the IE3-IE6 pairing (indicated by the red cross); M2 and M3, mutating IE3 increased the IE3-IE6 pairing strength (indicated by the green arrow), whereas pairing strength was stronger in M3 than in M2. (B) Effects of mutations on the exon 17 selection. Data are expressed as percentages of the mean ± SD from three independent experiments. (C) Exon 17.1 frequency was negatively correlated with the strength of RNA pairing. (D) A refined model for alternative splicing regulation of Dscam exon 17 in Drosophila. The green and red arrows indicate the activation and suppression of exon 17.1.
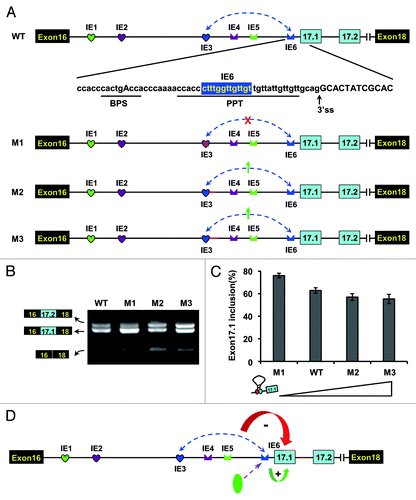
Figure 6. IE6 affects exon 17.1 selection in both structural- and sequence-dependent mode in D. melanogaster. (A) Schematic diagrams of minigene constructs used to assess the role of IE6 in splicing. The branch-point sequence (BPS), polypyrimidine tract (PPT), and the invariant AG at the 3′ ss are shown. M1, mutating IE3 abolished the IE3-IE6 pairing (indicated by the red cross); M2 and M3, mutating IE3 increased the IE3-IE6 pairing strength (indicated by the green arrow), whereas pairing strength was stronger in M3 than in M2. (B) Effects of mutations on the exon 17 selection. Data are expressed as percentages of the mean ± SD from three independent experiments. (C) Exon 17.1 frequency was negatively correlated with the strength of RNA pairing. (D) A refined model for alternative splicing regulation of Dscam exon 17 in Drosophila. The green and red arrows indicate the activation and suppression of exon 17.1.

Figure 7. Regulatory phylogeny of Dscam exon 17 alternative splicing by steric hindrance in combination with the dynamic RNA structure. Partial pre-mRNA structures and proposed ancestor molecules are shown associated with a cladogram of the phylogenetic relationships determined in this study.Citation38 RNA structures in D. melanogaster (Dme) were confirmed in Drosophila S2 cells ( and ), and RNA structures in B. mori (Bmo) were confirmed in BmN cells (). Nodes denoting the ancestral origins of particular exon duplication events are indicated by solid circles. Constitutive Dscam mRNAs are depicted as unstructured (black). Inset shows the emergence of control elements relative to the ancestor.
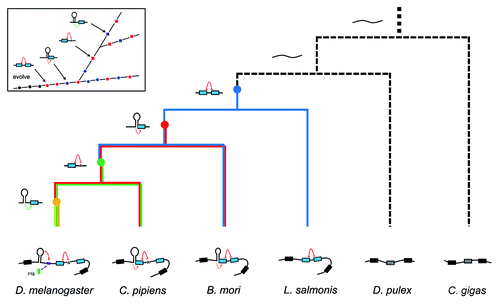
Figure 7. Regulatory phylogeny of Dscam exon 17 alternative splicing by steric hindrance in combination with the dynamic RNA structure. Partial pre-mRNA structures and proposed ancestor molecules are shown associated with a cladogram of the phylogenetic relationships determined in this study.Citation38 RNA structures in D. melanogaster (Dme) were confirmed in Drosophila S2 cells (Figs. 4 and 5), and RNA structures in B. mori (Bmo) were confirmed in BmN cells (Fig. 3). Nodes denoting the ancestral origins of particular exon duplication events are indicated by solid circles. Constitutive Dscam mRNAs are depicted as unstructured (black). Inset shows the emergence of control elements relative to the ancestor.
Supplemental material

Additional material

Download Zip (720.7 KB)

Reprints and Corporate Permissions

Please note: Selecting permissions does not provide access to the full text of the article, please see our help page How do I view content?

To request a reprint or corporate permissions for this article, please click on the relevant link below:

Academic Permissions

Please note: Selecting permissions does not provide access to the full text of the article, please see our help page How do I view content?

Obtain permissions instantly via Rightslink by clicking on the button below:

If you are unable to obtain permissions via Rightslink, please complete and submit this Permissions form. For more information, please visit our Permissions help page.