552
Views
22
CrossRef citations to date
0
Altmetric
Research Paper

N. meningitidis 1681 is a member of the FinO family of RNA chaperones

, , , , , , & show all
Pages 812-819 | Published online: 01 Nov 2010

Figures & data

Figure 1 X-ray crystal structure of NMB1681 reveals structural similarity to FinO. (A) Stereo view of an alignment of the six NMB1681 polypeptide chains in the crystallographic asymmetric unit. Alpha helices are numbered in accordance with the FinO numbering system. (B) Comparison of the structures of FinO (orange ribbon) and NMB1681 (blue ribbon) from two different orientations. Images in the top part are in the same orientation as in (A) whereas those in the bottom part are related to those in the top by a 180° rotation about the vertical axis. In each part, the left image shows a structural alignment of NMB1681 with FinO. Chain termini and secondary structure elements are labeled, as is residue 45 in FinO. Truncation of the region N-terminal to residue 45 does not reduce RNA binding activity but abolishes RNA strand exchange and duplexing activities. The middle and right images show the electrostatic surfaces of FinO (middle) and NMB1681 (right). (C) Structure-based sequence alignment of FinO, ProQ and NMB1681 with secondary structures indicated. Identical residues or residues with conserved charge are highlighted (orange, identical hydrophobic residues; red, conserved negatively charged residues; blue, conserved positively charged residues; green, identical hydrophilic residues).
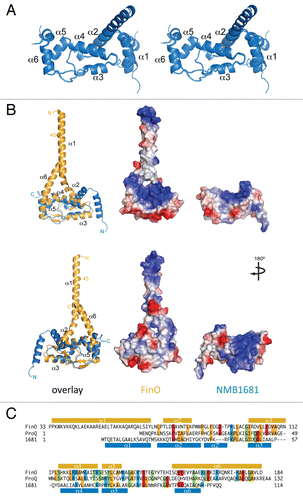
Figure 1 X-ray crystal structure of NMB1681 reveals structural similarity to FinO. (A) Stereo view of an alignment of the six NMB1681 polypeptide chains in the crystallographic asymmetric unit. Alpha helices are numbered in accordance with the FinO numbering system. (B) Comparison of the structures of FinO (orange ribbon) and NMB1681 (blue ribbon) from two different orientations. Images in the top part are in the same orientation as in (A) whereas those in the bottom part are related to those in the top by a 180° rotation about the vertical axis. In each part, the left image shows a structural alignment of NMB1681 with FinO. Chain termini and secondary structure elements are labeled, as is residue 45 in FinO. Truncation of the region N-terminal to residue 45 does not reduce RNA binding activity but abolishes RNA strand exchange and duplexing activities. The middle and right images show the electrostatic surfaces of FinO (middle) and NMB1681 (right). (C) Structure-based sequence alignment of FinO, ProQ and NMB1681 with secondary structures indicated. Identical residues or residues with conserved charge are highlighted (orange, identical hydrophobic residues; red, conserved negatively charged residues; blue, conserved positively charged residues; green, identical hydrophilic residues).

Figure 2 RNA binding activity of NMB1681. (A) Electrophoretic gel mobility shift assays (EMSA) were used to assess interactions between NMB1681 and a double stranded RNA (SIIA/B, left part) or a single-stranded RNA (SIIA, right part). (B) Quantitation of EMSA results for the binding of NMB1681 to double stranded RNA (dsRNA). Fitting of the binding curves suggest NMB1681 binds dsRNA with a Kd of 36 ± 4 nM.
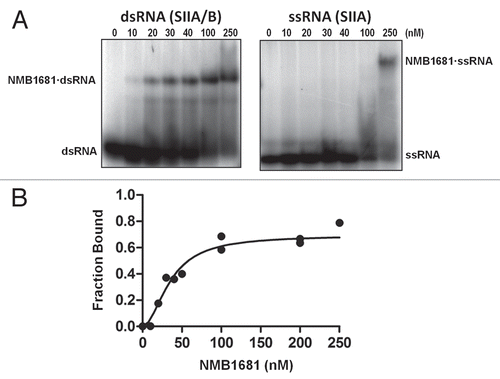
Figure 2 RNA binding activity of NMB1681. (A) Electrophoretic gel mobility shift assays (EMSA) were used to assess interactions between NMB1681 and a double stranded RNA (SIIA/B, left part) or a single-stranded RNA (SIIA, right part). (B) Quantitation of EMSA results for the binding of NMB1681 to double stranded RNA (dsRNA). Fitting of the binding curves suggest NMB1681 binds dsRNA with a Kd of 36 ± 4 nM.

Figure 3 RNA strand exchange activity of NMB1681. (A) Schematic diagram of the strand exchange assay. A two-stranded mimic of FinP SLII (SIIA/B) in which the (A) strand is labeled with 32P (*), is challenged with an excess of unlabeled SIIA. Exchange of the labeled SIIA from duplex to single strand is monitored by gel electrophoresis. (B) Strand exchange of NMB1681 was compared to FinO or a no protein control over a 180 min. time course utilizing continuous native gel electrophoresis. The positions of the duplex and single stranded species are indicated, as well as degradation species (*). (C) Using data from (B) (averaged from two independent experiments), the fraction of exchanged (released) SIIA was fit to a first order exponential giving rates of strand exchange of 0.032 ± 0.007 min−1 and 0.011 ± 0.004 min−1 for FinO and NMB1681 respectively.
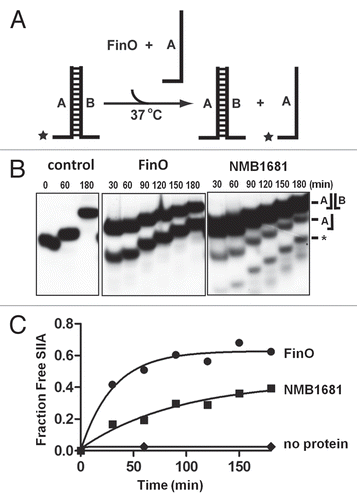
Figure 3 RNA strand exchange activity of NMB1681. (A) Schematic diagram of the strand exchange assay. A two-stranded mimic of FinP SLII (SIIA/B) in which the (A) strand is labeled with 32P (*), is challenged with an excess of unlabeled SIIA. Exchange of the labeled SIIA from duplex to single strand is monitored by gel electrophoresis. (B) Strand exchange of NMB1681 was compared to FinO or a no protein control over a 180 min. time course utilizing continuous native gel electrophoresis. The positions of the duplex and single stranded species are indicated, as well as degradation species (*). (C) Using data from (B) (averaged from two independent experiments), the fraction of exchanged (released) SIIA was fit to a first order exponential giving rates of strand exchange of 0.032 ± 0.007 min−1 and 0.011 ± 0.004 min−1 for FinO and NMB1681 respectively.

Figure 4 RNA annealing activity of NMB1681. (A) Schematic diagram of the RNA duplexing assay. Stem-loop II from FinP (SLII) is labeled with 32P (*) was incubated with an excess of unlabeled, complementary SLIIc from traJ mRNA. Duplex formation between these RNAs is monitored as a function of time by native gel electrophoresis. (B) Duplex formation between SLII and SLIIc RNAs is monitored over a 120 min. time course by continuous native gel electrophoresis, catalyzed by NMB1681, FinO or no protein control, as indicated. The positions of the hairpin and duplex forms of the RNAs are indicated as well as the position of an RNA degradation product (*). (C) Using data from (B) (from two independent experiments), the fraction of duplex formed was fit to a first order exponential giving rates of duplexing of 0.13 ± 0.03 min−1 and 0.21 ± 0.05 min−1 for FinO and NMB1681 respectively.
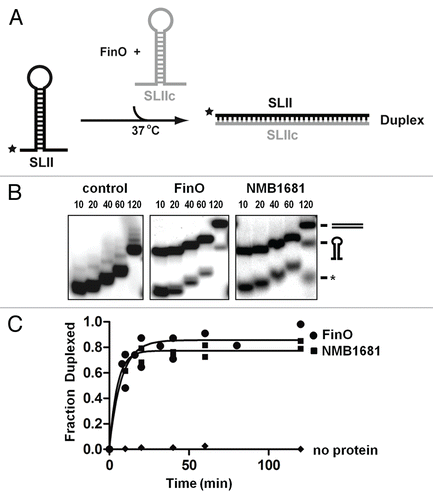
Figure 4 RNA annealing activity of NMB1681. (A) Schematic diagram of the RNA duplexing assay. Stem-loop II from FinP (SLII) is labeled with 32P (*) was incubated with an excess of unlabeled, complementary SLIIc from traJ mRNA. Duplex formation between these RNAs is monitored as a function of time by native gel electrophoresis. (B) Duplex formation between SLII and SLIIc RNAs is monitored over a 120 min. time course by continuous native gel electrophoresis, catalyzed by NMB1681, FinO or no protein control, as indicated. The positions of the hairpin and duplex forms of the RNAs are indicated as well as the position of an RNA degradation product (*). (C) Using data from (B) (from two independent experiments), the fraction of duplex formed was fit to a first order exponential giving rates of duplexing of 0.13 ± 0.03 min−1 and 0.21 ± 0.05 min−1 for FinO and NMB1681 respectively.

Figure 5 NMB1681 exhibits weak protection of FinP in vivo. FinP stability in E. coli cells was assessed at 0 and 120 min. following rifampicin treatment by northern blot analysis. FinP stabilities were compared between cells expressing either NMB1681, the N-terminal deletion mutant, NMB1681Δ, full length FinO or two N-terminal deletion mutants (FinO26–186 and FinO45–186), the control protein, TraD or the pBAD24 vector. The fraction of FinP protected at 120 min. post-rifampicin compared to the 0 min. time point was calculated after normalization to the tRNASer loading control.

Figure 5 NMB1681 exhibits weak protection of FinP in vivo. FinP stability in E. coli cells was assessed at 0 and 120 min. following rifampicin treatment by northern blot analysis. FinP stabilities were compared between cells expressing either NMB1681, the N-terminal deletion mutant, NMB1681Δ, full length FinO or two N-terminal deletion mutants (FinO26–186 and FinO45–186), the control protein, TraD or the pBAD24 vector. The fraction of FinP protected at 120 min. post-rifampicin compared to the 0 min. time point was calculated after normalization to the tRNASer loading control.

Table 1 Crystallographic statistics

Table 2 Fertility inhibition of the F plasmid (pOX38-Km) by FinO or NMB1681 constructs

Reprints and Corporate Permissions

Please note: Selecting permissions does not provide access to the full text of the article, please see our help page How do I view content?

To request a reprint or corporate permissions for this article, please click on the relevant link below:

Academic Permissions

Please note: Selecting permissions does not provide access to the full text of the article, please see our help page How do I view content?

Obtain permissions instantly via Rightslink by clicking on the button below:

If you are unable to obtain permissions via Rightslink, please complete and submit this Permissions form. For more information, please visit our Permissions help page.