800
Views
39
CrossRef citations to date
0
Altmetric
Report

Actin-binding protein drebrin E is involved in junction dynamics during spermatogenesis

, , , , , , , & show all
Pages 123-136 | Received 11 Apr 2011, Accepted 07 May 2011, Published online: 30 Jun 2011

Figures & data

Figure 1 Drebrin E is expressed stage-specifically in the seminiferous epithelium of adult rat testes. (A) Using immunoblot analysis with ∼50 µg total protein per sample, only the drebrin E isoform was found to be expressed in the testis while both drebrin A and E isoforms were detected in brain lysate. Drebrin E was predominantly expressed by Sertoli cells (SC) in the seminiferous tubule and virtually no drebrin E was found in total germ cells (GC) isolated from adult rat testes. Actin served as the protein loading control. (B) The specificity of the antidrebrin E antibody was illustrated by immunoblotting using lysates of Sertoli cells (∼50 µg protein) since only a prominent immunoreactive band corresponding to the apparent Mr of drebrin E at 110 kDa was detected. These results also support the staining shown in (C and D) was specific for drebrin E. A study using immunohistochemistry (C) and immunofluorescence microscopy (D; drebrin E, red fluorescence; cell nuclei were visualized by DAPI in blue, 4′,6-diamidino-2-phenylindole, staining) showed that drebrin E localized near the basement membrane in the basal compartment, consistent with its localization at the bloodtestis barrier (BTB), and drebrin E also localized at the apical ectoplasmic specialization (apical ES). The expression of drebrin E at the BTB is most prominent at stage V of the seminiferous cycle using both staining techniques (C and D), which diminished gradually thereafter and was almost non-visible at the BTB by stages VIII–XIV. In (C), the boxed areas enclosed by a “solid-line” rectangle notes an area of the epithelium that was magnified; this is shown in the same micrograph but enclosed within a “broken-line” rectangle. Ctrl illustrates sections that were stained with normal rabbit IgG which was substituted in place of the anti-drebrin E antibody, confirming the reddish-brown immunoreactive drebrin E shown in (C) was specific for drebrin E. Drebrin E was localized at the apical ES, surrounding the entire head of the elongating spermatid at stages IV and V (C). However, the localization of drebrin E shifted and localized predominantly to the concave side of the head of elongating/elongated spermatids at stage VII (see also the magnified images in C), but its level was drastically reduced at stage VIII and these observations were consistent using either immunohistochemistry (C) or immunofluorescence microscopy (D). Roman numerals denote stages of the seminiferous epithelial cycle. Bar = 50 µm in the first micrograph in (C and D), which also applies to the other micrographs; bar = 25 µm in the inset in the first micrograph in (C), which also applies to the other insets in (C). These micrographs are representative results from a single set of experiments, which were repeated at least 3 times using different sets of sections from different rats and similar results were obtained.
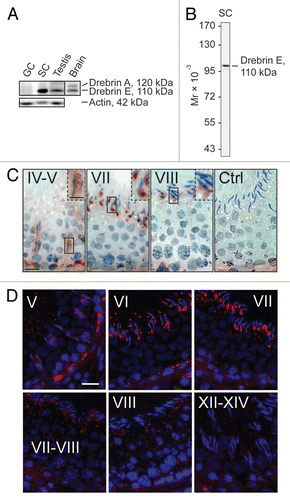
Figure 1 Drebrin E is expressed stage-specifically in the seminiferous epithelium of adult rat testes. (A) Using immunoblot analysis with ∼50 µg total protein per sample, only the drebrin E isoform was found to be expressed in the testis while both drebrin A and E isoforms were detected in brain lysate. Drebrin E was predominantly expressed by Sertoli cells (SC) in the seminiferous tubule and virtually no drebrin E was found in total germ cells (GC) isolated from adult rat testes. Actin served as the protein loading control. (B) The specificity of the antidrebrin E antibody was illustrated by immunoblotting using lysates of Sertoli cells (∼50 µg protein) since only a prominent immunoreactive band corresponding to the apparent Mr of drebrin E at 110 kDa was detected. These results also support the staining shown in (C and D) was specific for drebrin E. A study using immunohistochemistry (C) and immunofluorescence microscopy (D; drebrin E, red fluorescence; cell nuclei were visualized by DAPI in blue, 4′,6-diamidino-2-phenylindole, staining) showed that drebrin E localized near the basement membrane in the basal compartment, consistent with its localization at the bloodtestis barrier (BTB), and drebrin E also localized at the apical ectoplasmic specialization (apical ES). The expression of drebrin E at the BTB is most prominent at stage V of the seminiferous cycle using both staining techniques (C and D), which diminished gradually thereafter and was almost non-visible at the BTB by stages VIII–XIV. In (C), the boxed areas enclosed by a “solid-line” rectangle notes an area of the epithelium that was magnified; this is shown in the same micrograph but enclosed within a “broken-line” rectangle. Ctrl illustrates sections that were stained with normal rabbit IgG which was substituted in place of the anti-drebrin E antibody, confirming the reddish-brown immunoreactive drebrin E shown in (C) was specific for drebrin E. Drebrin E was localized at the apical ES, surrounding the entire head of the elongating spermatid at stages IV and V (C). However, the localization of drebrin E shifted and localized predominantly to the concave side of the head of elongating/elongated spermatids at stage VII (see also the magnified images in C), but its level was drastically reduced at stage VIII and these observations were consistent using either immunohistochemistry (C) or immunofluorescence microscopy (D). Roman numerals denote stages of the seminiferous epithelial cycle. Bar = 50 µm in the first micrograph in (C and D), which also applies to the other micrographs; bar = 25 µm in the inset in the first micrograph in (C), which also applies to the other insets in (C). These micrographs are representative results from a single set of experiments, which were repeated at least 3 times using different sets of sections from different rats and similar results were obtained.

Figure 2 A study to examine the co-localization of drebrin E with F-actin and two other actin regulatory proteins, Eps8 and Arp3, in the seminiferous epithelium of adult rat testes. Drebrin E (red fluorescence) and F-actin (green fluorescence) were found to co-localize in the seminiferous epithelium of adult rat testes (orange-yellow fluorescence; see merged images on the right), consistent with their localization at the BTB, mostly at stage V, and also at the apical ES. Drebrin E was found at the apical ES, surrounding the entire heads of elongating spermatids at stage V, but its localization shifted and localized mostly on the concave side of elongating spermatids at the apical ES in stage VII tubules. Drebrin E also co-localized with two other actin regulators, namely Eps8 (green fluorescence) and Arp3 (green fluorescence), which are known to be present at the apical ES at stage VII. When the actin filament network at the apical ES undergoes restructuring at stage VIII of the seminiferous cycle, a considerable decline in the expression of drebrin, Eps8 and Arp3 was detected. Cell nuclei were visualized by DAPI staining. Bar = 50 µm, which also applies to the other micrographs. These findings are representative results from a single experiment, which was repeated three times using testes from different set of rats. Each experiment yielded similar results. Stages of the seminiferous epithelial cycle are denoted as Roman numerals to the left of images.
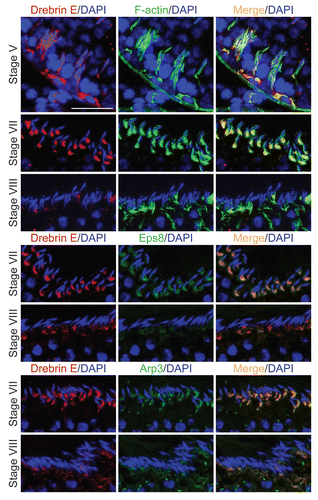
Figure 2 A study to examine the co-localization of drebrin E with F-actin and two other actin regulatory proteins, Eps8 and Arp3, in the seminiferous epithelium of adult rat testes. Drebrin E (red fluorescence) and F-actin (green fluorescence) were found to co-localize in the seminiferous epithelium of adult rat testes (orange-yellow fluorescence; see merged images on the right), consistent with their localization at the BTB, mostly at stage V, and also at the apical ES. Drebrin E was found at the apical ES, surrounding the entire heads of elongating spermatids at stage V, but its localization shifted and localized mostly on the concave side of elongating spermatids at the apical ES in stage VII tubules. Drebrin E also co-localized with two other actin regulators, namely Eps8 (green fluorescence) and Arp3 (green fluorescence), which are known to be present at the apical ES at stage VII. When the actin filament network at the apical ES undergoes restructuring at stage VIII of the seminiferous cycle, a considerable decline in the expression of drebrin, Eps8 and Arp3 was detected. Cell nuclei were visualized by DAPI staining. Bar = 50 µm, which also applies to the other micrographs. These findings are representative results from a single experiment, which was repeated three times using testes from different set of rats. Each experiment yielded similar results. Stages of the seminiferous epithelial cycle are denoted as Roman numerals to the left of images.

Figure 3 Apical ES disruption induced by adjudin is accompanied by a considerable reduction of drebrin E at the apical ES, but not at the BTB. (A) By immunoblotting, following adjudin treatment in adult rats (50 mg/kg b.w., one dose, by gavage) to induce premature loss of germ cells, a decline in the steady-state level of drebrin E was detected in the testis, beginning from 1 d (day) post-treatment and almost non-detectable by 4 d when virtually all elongating/elongated spermatids were depleted from the epithelium. Actin served as loading control against which the drebrin E was normalized. Histogram is shown on the right part which summarized immunoblotting data shown on the left part with each bar = mean ± SD from n = 3 rats. The steady-state level of drebrin E in control rats was arbitrarily set at 1. *p < 0.05; **p < 0.01. n.d., not detectable. (B) In the control testis, drebrin E (red fluorescence) was detected at the concave side of elongating/elongated spermatid heads in stage VI and VII tubules, but F-actin (green fluorescence) was found surrounding the entire apical ES. Cell nuclei (blue) were visualized by DAPI staining. At about 7 h (hour) post-adjudin treatment when premature loss of elongating/elongated spermatids began to occur, a lowered and also truncated protein expression of drebrin E and F-actin were detected at the apical ES in non-stage VIII tubules when examined by immunofluorescence microscopy in which the staining of drebrin E and actin appeared to be “broken” and “defragmented.” Furthermore, many elongating spermatids in adjudin-treated rats were found to be mis-oriented with their heads no longer pointing toward the basement membrane (see “white” arrowheads). In these mis-oriented elongating spermatids, drebrin E was also found to be mis-localized, which was no longer restricted to the concave side of the spermatid head; instead, it was found on the convex side of the spermatid head (see “yellow” arrowheads), perhaps binding to the Arp2/3 complex to induce protein nucleation and to cause disruption of actin filament bundles, thereby causing actin branching. The net result of these changes induces “premature” apical ES disruption, thereby leading to germ cell depletion from the seminiferous epithelium. While the level of expression of drebrin E and F-actin at the basal ES at the BTB in stage VI and VII tubules by 7 h after adjudin treatment remained relatively similar to control (normal) rats, the drebrin E level was found to be enhanced considerably in stage VII in adjudin treated rats vs. control. Bar = 100 µm, which also applies to all other micrographs.
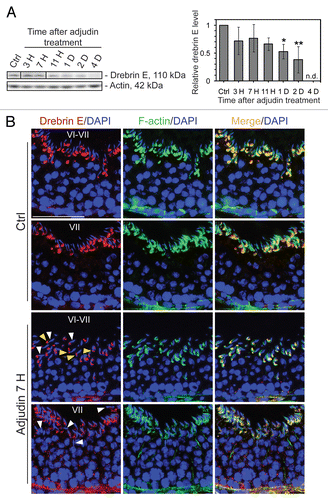
Figure 3 Apical ES disruption induced by adjudin is accompanied by a considerable reduction of drebrin E at the apical ES, but not at the BTB. (A) By immunoblotting, following adjudin treatment in adult rats (50 mg/kg b.w., one dose, by gavage) to induce premature loss of germ cells, a decline in the steady-state level of drebrin E was detected in the testis, beginning from 1 d (day) post-treatment and almost non-detectable by 4 d when virtually all elongating/elongated spermatids were depleted from the epithelium. Actin served as loading control against which the drebrin E was normalized. Histogram is shown on the right part which summarized immunoblotting data shown on the left part with each bar = mean ± SD from n = 3 rats. The steady-state level of drebrin E in control rats was arbitrarily set at 1. *p < 0.05; **p < 0.01. n.d., not detectable. (B) In the control testis, drebrin E (red fluorescence) was detected at the concave side of elongating/elongated spermatid heads in stage VI and VII tubules, but F-actin (green fluorescence) was found surrounding the entire apical ES. Cell nuclei (blue) were visualized by DAPI staining. At about 7 h (hour) post-adjudin treatment when premature loss of elongating/elongated spermatids began to occur, a lowered and also truncated protein expression of drebrin E and F-actin were detected at the apical ES in non-stage VIII tubules when examined by immunofluorescence microscopy in which the staining of drebrin E and actin appeared to be “broken” and “defragmented.” Furthermore, many elongating spermatids in adjudin-treated rats were found to be mis-oriented with their heads no longer pointing toward the basement membrane (see “white” arrowheads). In these mis-oriented elongating spermatids, drebrin E was also found to be mis-localized, which was no longer restricted to the concave side of the spermatid head; instead, it was found on the convex side of the spermatid head (see “yellow” arrowheads), perhaps binding to the Arp2/3 complex to induce protein nucleation and to cause disruption of actin filament bundles, thereby causing actin branching. The net result of these changes induces “premature” apical ES disruption, thereby leading to germ cell depletion from the seminiferous epithelium. While the level of expression of drebrin E and F-actin at the basal ES at the BTB in stage VI and VII tubules by 7 h after adjudin treatment remained relatively similar to control (normal) rats, the drebrin E level was found to be enhanced considerably in stage VII in adjudin treated rats vs. control. Bar = 100 µm, which also applies to all other micrographs.

Figure 4 Localization of drebrin E in Sertoli cells cultured in vitro and cytokine-induced transient decline of the drebrin E steady-state protein level in the Sertoli cell epithelium. (A) When Sertoli cells were cultured at 0.005 × 10⁶ cells/cm2 for 4 d on Matrigel-coated coverslips and stained for drebrin E (red fluorescence), drebrin E localized to the cytoplasm, as well as to the plasma membrane near the cell surface. Drebrin E, an actin regulator, also co-localized with F-actin (green fluorescence) but mostly at or near the cell surface (see inset below each micrograph, which is a magnified view of the area enclosed within the “broken-line” rectangle). Bar = 40 µm in the top micrograph, which also applies to the other micrographs; bar in inset = 15 µm in the top micrograph, which also applies to the other insets. (B and C) Sertoli cells were cultured at 0.5 × 10⁶ cells/cm2 on Matrigel-coated dishes for 4 d, forming an intact epithelium with an established TJ permeability barrier and ultrastructural features corresponding to TJs, basal ES, GJs and desmosomes, mimicking the Sertoli cell BTB in vivo.Citation41,Citation42 On day 4, Sertoli cells were treated with either TNFα (10 ng/ml) or TGFβ3 (3 ng/ml) vs. controls (no treatment) and cultures were terminated at 4 h (hr), 8–10 h and 1 d (day) thereafter. Previous studies have shown that these cytokines induced junction restructuring at the BTB, disrupting the Sertoli cell TJ-permeability barrier.Citation46,Citation47,Citation78 A transient but statistically significant decline in the steady-state protein level of drebrin E was detected at 4 h to 8–10 h after TNFα or TGFβ3 treatment vs. the control. However, this decline in drebrin E level returned to its basal level by 24 h post-treatment. While Arp3 was shown to be a binding partner of drebrin E (see ), the steady-state of Arp3 remained altered throughout the entire experimental period following treatment with cytokine vs. the control (B). Actin served as the protein loading control against which scanned data of drebrin E were normalized. The immunoblotting data shown in (B) illustrate changes in the protein level of drebrin E following cytokine treatment after images were densitometrically scanned using Multi Gauge software and shown in the histogram depicted in (C). Scanned data of Arp3 normalized against actin following cytokine treatment vs control were not shown in (C) because no significant changes were detected. Each bar = mean ± SD from six different culture experiments using different batches of Sertoli cells. 8–10 h indicates cultures were terminated at either 8 (n = 3) or 10 (n = 3) H after treatment with cytokine. The steady-state level of drebrin E at 0 h was arbitrarily set at 1. *p < 0.05.
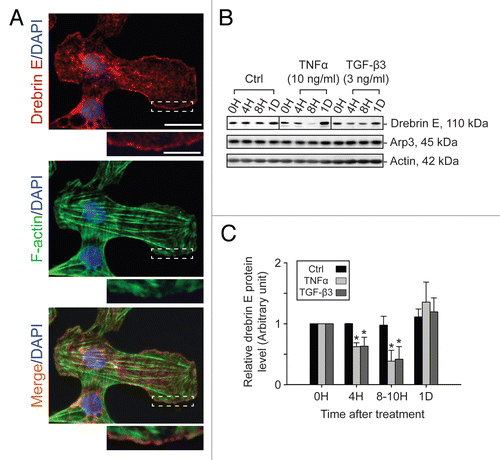
Figure 4 Localization of drebrin E in Sertoli cells cultured in vitro and cytokine-induced transient decline of the drebrin E steady-state protein level in the Sertoli cell epithelium. (A) When Sertoli cells were cultured at 0.005 × 10⁶ cells/cm2 for 4 d on Matrigel-coated coverslips and stained for drebrin E (red fluorescence), drebrin E localized to the cytoplasm, as well as to the plasma membrane near the cell surface. Drebrin E, an actin regulator, also co-localized with F-actin (green fluorescence) but mostly at or near the cell surface (see inset below each micrograph, which is a magnified view of the area enclosed within the “broken-line” rectangle). Bar = 40 µm in the top micrograph, which also applies to the other micrographs; bar in inset = 15 µm in the top micrograph, which also applies to the other insets. (B and C) Sertoli cells were cultured at 0.5 × 10⁶ cells/cm2 on Matrigel-coated dishes for 4 d, forming an intact epithelium with an established TJ permeability barrier and ultrastructural features corresponding to TJs, basal ES, GJs and desmosomes, mimicking the Sertoli cell BTB in vivo.Citation41,Citation42 On day 4, Sertoli cells were treated with either TNFα (10 ng/ml) or TGFβ3 (3 ng/ml) vs. controls (no treatment) and cultures were terminated at 4 h (hr), 8–10 h and 1 d (day) thereafter. Previous studies have shown that these cytokines induced junction restructuring at the BTB, disrupting the Sertoli cell TJ-permeability barrier.Citation46,Citation47,Citation78 A transient but statistically significant decline in the steady-state protein level of drebrin E was detected at 4 h to 8–10 h after TNFα or TGFβ3 treatment vs. the control. However, this decline in drebrin E level returned to its basal level by 24 h post-treatment. While Arp3 was shown to be a binding partner of drebrin E (see Fig. 5), the steady-state of Arp3 remained altered throughout the entire experimental period following treatment with cytokine vs. the control (B). Actin served as the protein loading control against which scanned data of drebrin E were normalized. The immunoblotting data shown in (B) illustrate changes in the protein level of drebrin E following cytokine treatment after images were densitometrically scanned using Multi Gauge software and shown in the histogram depicted in (C). Scanned data of Arp3 normalized against actin following cytokine treatment vs control were not shown in (C) because no significant changes were detected. Each bar = mean ± SD from six different culture experiments using different batches of Sertoli cells. 8–10 h indicates cultures were terminated at either 8 (n = 3) or 10 (n = 3) H after treatment with cytokine. The steady-state level of drebrin E at 0 h was arbitrarily set at 1. *p < 0.05.

Figure 5 A study by co-immunoprecipitation (Co-IP) to identify the binding partner(s) of drebrin E and changes in the interaction between drebrin E and Arp3 in the Sertoli cell epithelium following treatment with cytokines. (A) Sertoli cells were cultured at 0.5 × 10⁶ cells/cm2 for 4 d to allow the formation of a functional TJ-permeability barrier with ultrastructural features corresponding to TJs, basal ES, GJs and desmosomes when examined by electron microscopy.Citation41,Citation42,Citation76 Thereafter, lysates were obtained by using IP lysis buffer and about 250 µg protein from each sample was used for Co-IP. The column on the left is positive control using Sertoli cell lysates (25 µg protein) per lane alone without Co-IP. Negative control (-ve Ctrl) was prepared using normal rabbit IgG instead of the anti-drebrin E IgG for Co-IP. It was found that drebrin E associated with Apr3, but not Eps8, β-catenin, occludin, FAK or Src family kinases as demonstrated in this representative experiment which was repeated three times using lysates from different batches of Sertoli cell cultures. (B and C) This Co-IP experiment was performed using samples similar to those shown in . In brief, Sertoli cells cultured for 4 d were treated with either TNFα or TGFβ3 for 4 h (hr), 8 h and 1 d (day). About 250 µg total protein from each sample was used for Co-IP with an anti-drebrin E antibody and the resulting immunocomplexes were examined by immunoblotting using anti-Arp3 antibody. Actin served as the protein loading control. It was noted that while there was a significant loss of drebrin E steady-state level at 4 and 8 h by about 50% (see ), there was a ∼2- to 3-fold increase in the association between drebrin E and Arp3 following treatment with either TNFα or TGFβ3 (B). In (C), each bar = mean ± SD of n = 3 from three independent experiments. The amount of drebrin E associated with Arp3 at time 0 was arbitrarily set at 1. *p < 0.05; **p<0.01.
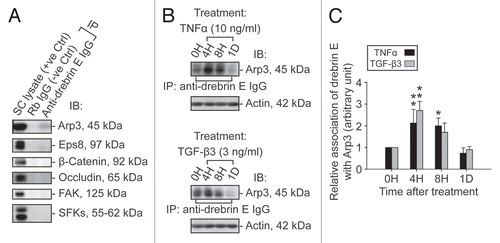
Figure 5 A study by co-immunoprecipitation (Co-IP) to identify the binding partner(s) of drebrin E and changes in the interaction between drebrin E and Arp3 in the Sertoli cell epithelium following treatment with cytokines. (A) Sertoli cells were cultured at 0.5 × 10⁶ cells/cm2 for 4 d to allow the formation of a functional TJ-permeability barrier with ultrastructural features corresponding to TJs, basal ES, GJs and desmosomes when examined by electron microscopy.Citation41,Citation42,Citation76 Thereafter, lysates were obtained by using IP lysis buffer and about 250 µg protein from each sample was used for Co-IP. The column on the left is positive control using Sertoli cell lysates (25 µg protein) per lane alone without Co-IP. Negative control (-ve Ctrl) was prepared using normal rabbit IgG instead of the anti-drebrin E IgG for Co-IP. It was found that drebrin E associated with Apr3, but not Eps8, β-catenin, occludin, FAK or Src family kinases as demonstrated in this representative experiment which was repeated three times using lysates from different batches of Sertoli cell cultures. (B and C) This Co-IP experiment was performed using samples similar to those shown in Figure 4B. In brief, Sertoli cells cultured for 4 d were treated with either TNFα or TGFβ3 for 4 h (hr), 8 h and 1 d (day). About 250 µg total protein from each sample was used for Co-IP with an anti-drebrin E antibody and the resulting immunocomplexes were examined by immunoblotting using anti-Arp3 antibody. Actin served as the protein loading control. It was noted that while there was a significant loss of drebrin E steady-state level at 4 and 8 h by about 50% (see Fig. 4B and C), there was a ∼2- to 3-fold increase in the association between drebrin E and Arp3 following treatment with either TNFα or TGFβ3 (B). In (C), each bar = mean ± SD of n = 3 from three independent experiments. The amount of drebrin E associated with Arp3 at time 0 was arbitrarily set at 1. *p < 0.05; **p<0.01.

Figure 6 A study by dual-labeled immunofluorescence analysis to assess the effects of cytokines on the actin filament cytoskeleton and the distribution of drebrin E in Sertoli cells. Sertoli cells were cultured at 0.0125 × 10⁶ cells/cm2 on Matrigel-coated coverslips in F12/DMEM for 4 d at 35°C with 5% CO2/95% air (v/v) in a humidified atmosphere prior to treatment. This cell density was selected to ensure that Sertoli cell nuclei would be evenly distributed and changes in drebrin E (red fluorescence) and F-actin (green fluorescence) filament distribution at the Sertoli-Sertoli cell interface and cell cytosol would be readily visible. Also, at this cell density, ultrastructures of TJ, basal ES, desmosome, and GJ were detected at the Sertoli-Sertoli cell interface under electron microscopy, illustrating functional junctions were established in these cell epithelia as detailed elsewhere.Citation38,Citation54,Citation77 It was noted that in the control Sertoli cells, F-actin formed an extensive network of filaments, which was used to maintain proper cell shape. Drebrin E was detected at the Sertoli-Sertoli cell interface (see “yellow” arrowheads in middle column) and in the cell cytosol. Co-localization of drebrin E was detected in the cell cytosol, surrounding the cell nucleus, as well as at the cell-cell interface. These findings are also consistent with findings shown in . However, following treatment of Sertoli cells with either TNFα or TGFβ3 for 4 h (hr), actin filaments were found to become truncated and appeared defragmented with some actin filaments being disrupted (see “white” arrowheads). Additionally, actin filaments at the cell-cell interface appeared to move away from the cell-cell interface, forming actin bundles at the cell periphery (see “red” arrowheads) after treatment of the Sertoli cell epithelium with cytokines for 1D (day). Also, drebrin E no longer co-localized with F-actin at the cell-cell interface (see merged images in both treatment groups vs. control group) and drebrin E was localized mostly in Sertoli cell cytosol. Sertoli cell nuclei were visualized by DAPI staining (blue). These micrographs are representative findings from one experiment, but this experiment was repeated three times using different batches of Sertoli cells, which yielded similar results. Bar = 30 µm, which applies to all micrographs.
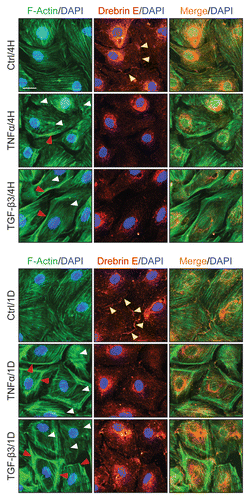
Figure 6 A study by dual-labeled immunofluorescence analysis to assess the effects of cytokines on the actin filament cytoskeleton and the distribution of drebrin E in Sertoli cells. Sertoli cells were cultured at 0.0125 × 10⁶ cells/cm2 on Matrigel-coated coverslips in F12/DMEM for 4 d at 35°C with 5% CO2/95% air (v/v) in a humidified atmosphere prior to treatment. This cell density was selected to ensure that Sertoli cell nuclei would be evenly distributed and changes in drebrin E (red fluorescence) and F-actin (green fluorescence) filament distribution at the Sertoli-Sertoli cell interface and cell cytosol would be readily visible. Also, at this cell density, ultrastructures of TJ, basal ES, desmosome, and GJ were detected at the Sertoli-Sertoli cell interface under electron microscopy, illustrating functional junctions were established in these cell epithelia as detailed elsewhere.Citation38,Citation54,Citation77 It was noted that in the control Sertoli cells, F-actin formed an extensive network of filaments, which was used to maintain proper cell shape. Drebrin E was detected at the Sertoli-Sertoli cell interface (see “yellow” arrowheads in middle column) and in the cell cytosol. Co-localization of drebrin E was detected in the cell cytosol, surrounding the cell nucleus, as well as at the cell-cell interface. These findings are also consistent with findings shown in Figure 4A. However, following treatment of Sertoli cells with either TNFα or TGFβ3 for 4 h (hr), actin filaments were found to become truncated and appeared defragmented with some actin filaments being disrupted (see “white” arrowheads). Additionally, actin filaments at the cell-cell interface appeared to move away from the cell-cell interface, forming actin bundles at the cell periphery (see “red” arrowheads) after treatment of the Sertoli cell epithelium with cytokines for 1D (day). Also, drebrin E no longer co-localized with F-actin at the cell-cell interface (see merged images in both treatment groups vs. control group) and drebrin E was localized mostly in Sertoli cell cytosol. Sertoli cell nuclei were visualized by DAPI staining (blue). These micrographs are representative findings from one experiment, but this experiment was repeated three times using different batches of Sertoli cells, which yielded similar results. Bar = 30 µm, which applies to all micrographs.

Figure 7 A study by dual-labeled immunofluorescence analysis to assess the effects of cytokines on the distribution of Arp3 and drebrin E in Sertoli cells. Sertoli cells cultured alone at 0.0125 × 10⁶ cells/cm2 on Matrigel-coated coverslips in F12/DMEM for 4 d, forming an epithelium. Thereafter, cells were treated with either TNFα or TGFβ3 for 4 h (hr) including control (Ctrl, no treatment) and terminated for dual-labeled immunofluorescence analysis. Consistent with findings shown in and , drebrin E (red fluorescence) was found at the Sertoli-Sertoli cell interface and in the cell cytosol, similar to Arp3 (green fluorescence) and some co-localization (see orange-yellow fluorescence in merged images) was found between Arp3 and drebrin E (see yellow arrowheads at the cell-cell interface), consistent with Co-IP data (). After cytokine treatment, drebrin E was found to undergo re-distribution, moving closer to cell nuclei and Arp3 also displayed a similar pattern of protein redistribution. Additionally, an increase in the co-localization of drebrin E and Arp3 was detected (see red arrowheads), consistent with findings of which showed that an increase in protein-protein interactions between Arp3 and drebrin E was detected by 4 H following either TNFα or TGFβ3 treatment using the technique of Co-IP. Sertoli cell nuclei were visualized by DAPI staining (blue). Bar = 20 µm, which also applies to all other micrographs.
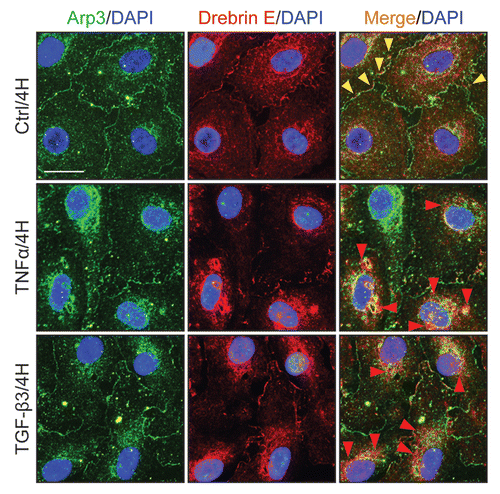
Figure 7 A study by dual-labeled immunofluorescence analysis to assess the effects of cytokines on the distribution of Arp3 and drebrin E in Sertoli cells. Sertoli cells cultured alone at 0.0125 × 10⁶ cells/cm2 on Matrigel-coated coverslips in F12/DMEM for 4 d, forming an epithelium. Thereafter, cells were treated with either TNFα or TGFβ3 for 4 h (hr) including control (Ctrl, no treatment) and terminated for dual-labeled immunofluorescence analysis. Consistent with findings shown in Figures 4 and 6, drebrin E (red fluorescence) was found at the Sertoli-Sertoli cell interface and in the cell cytosol, similar to Arp3 (green fluorescence) and some co-localization (see orange-yellow fluorescence in merged images) was found between Arp3 and drebrin E (see yellow arrowheads at the cell-cell interface), consistent with Co-IP data (Fig. 4). After cytokine treatment, drebrin E was found to undergo re-distribution, moving closer to cell nuclei and Arp3 also displayed a similar pattern of protein redistribution. Additionally, an increase in the co-localization of drebrin E and Arp3 was detected (see red arrowheads), consistent with findings of Figure 4 which showed that an increase in protein-protein interactions between Arp3 and drebrin E was detected by 4 H following either TNFα or TGFβ3 treatment using the technique of Co-IP. Sertoli cell nuclei were visualized by DAPI staining (blue). Bar = 20 µm, which also applies to all other micrographs.

Table 1 Source and working dilutions of antibodies used for various experiments in this reportTable Footnote*