494
Views
8
CrossRef citations to date
0
Altmetric
Report

A network of spectrin and plectin surrounds the actin cuffs of apical tubulobulbar complexes in the rat

, , &
Article: e25733 | Received 23 May 2013, Accepted 11 Jul 2013, Published online: 19 Jul 2013

Figures & data

Figure 1. Spectrin distribution in the seminiferous epithelium. (A) Shown here is a section of stage VII seminiferous epithelium labeled with probes for spectrin, actin, and DNA. Although the spectrin antibody reacts generally throughout the epithelium, it is most concentrated adjacent to the concave face of the hook-shaped late spermatids at the apex of the epithelium (arrows). These regions contain tubulobulbar complexes that also label for actin. The pattern of staining with the spectrin antibody (B) is absent when the primary antibody is replaced with normal mouse IgG (NMIgG) (C), when the primary antibody is replaced with buffer alone (D), or when both the primary and the secondary antibodies are replaced with buffer alone (E). Bar = 20.0 μm.

Figure 1. Spectrin distribution in the seminiferous epithelium. (A) Shown here is a section of stage VII seminiferous epithelium labeled with probes for spectrin, actin, and DNA. Although the spectrin antibody reacts generally throughout the epithelium, it is most concentrated adjacent to the concave face of the hook-shaped late spermatids at the apex of the epithelium (arrows). These regions contain tubulobulbar complexes that also label for actin. The pattern of staining with the spectrin antibody (B) is absent when the primary antibody is replaced with normal mouse IgG (NMIgG) (C), when the primary antibody is replaced with buffer alone (D), or when both the primary and the secondary antibodies are replaced with buffer alone (E). Bar = 20.0 μm.

Figure 2. Western blot of testis and seminiferous epithelium lysates labeled with the spectrin antibody and with normal mouse IgG. A single band at the appropriate molecular weight for spectrin (asterisk) is present in material labeled with the spectrin antibody that is not present in material labeled with normal mouse IgG. To control for protein loading, bots were stripped and re-probed for calnexin.
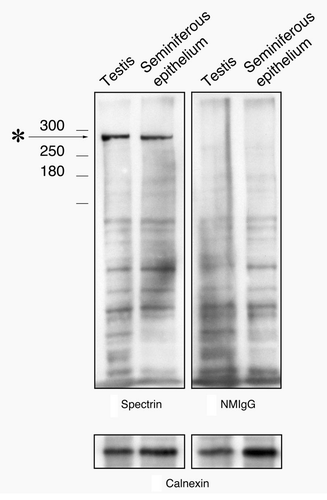
Figure 2. Western blot of testis and seminiferous epithelium lysates labeled with the spectrin antibody and with normal mouse IgG. A single band at the appropriate molecular weight for spectrin (asterisk) is present in material labeled with the spectrin antibody that is not present in material labeled with normal mouse IgG. To control for protein loading, bots were stripped and re-probed for calnexin.

Figure 3. Localization of spectrin in a Sertoli cell apical process containing a late spermatid when analyzed using conventional fluorescence microscopy. The position of the spermatid head is clearly evident in the phase image (A) and when labeled with DAPI for DNA (B). Although the probe for spectrin generally labels in a diffuse pattern in the area adjacent to the concave face of the spermatid head, there are periodic linear tracts where the staining is more intense (arrowheads). These linear tracts appear similar to the labeling pattern for the actin networks of tubulobulbar complexes (arrows) (D); however, when the spectin and actin channels are merged, it is clear that the linear tracts of spectrin concentration actually appear between the actin networks of adjacent tubulobulbar complexes (E). No staining pattern similar to labeling with the spectrin antibody is present when the primary antibody is replaced with normal mouse IgG (F). Bars = 5.0 μm.
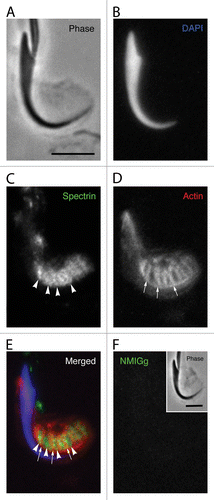
Figure 3. Localization of spectrin in a Sertoli cell apical process containing a late spermatid when analyzed using conventional fluorescence microscopy. The position of the spermatid head is clearly evident in the phase image (A) and when labeled with DAPI for DNA (B). Although the probe for spectrin generally labels in a diffuse pattern in the area adjacent to the concave face of the spermatid head, there are periodic linear tracts where the staining is more intense (arrowheads). These linear tracts appear similar to the labeling pattern for the actin networks of tubulobulbar complexes (arrows) (D); however, when the spectin and actin channels are merged, it is clear that the linear tracts of spectrin concentration actually appear between the actin networks of adjacent tubulobulbar complexes (E). No staining pattern similar to labeling with the spectrin antibody is present when the primary antibody is replaced with normal mouse IgG (F). Bars = 5.0 μm.

Figure 4. Localization of spectrin in a Sertoli cell apical process containing a late spermatid when analyzed using confocal microscopy. Shown here are projections of an apical process labeled for spectrin (A), actin (B), and DNA (C). The spectrin antibody labels linear tracts (arrowheads in A) that reflect the adjacent positions of actin networks of tubulobulbar complexes (arrow in B). When the projections of the channels are merged, the probe for spectrin is concentrated between the actin networks of adjacent tubulobulbar complexes (D). This is particularly evident when the Z-stacks are analyzed in 3D using Velocity software. A single snapshot of the 3D reconstruction is shown in panel (E). Bars = 5.0 μm.
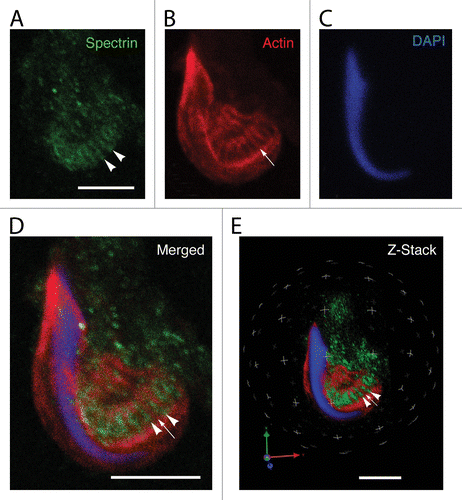
Figure 4. Localization of spectrin in a Sertoli cell apical process containing a late spermatid when analyzed using confocal microscopy. Shown here are projections of an apical process labeled for spectrin (A), actin (B), and DNA (C). The spectrin antibody labels linear tracts (arrowheads in A) that reflect the adjacent positions of actin networks of tubulobulbar complexes (arrow in B). When the projections of the channels are merged, the probe for spectrin is concentrated between the actin networks of adjacent tubulobulbar complexes (D). This is particularly evident when the Z-stacks are analyzed in 3D using Velocity software. A single snapshot of the 3D reconstruction is shown in panel (E). Bars = 5.0 μm.

Figure 5. Localization of EPB41 in a Sertoli cell apical process containing a late spermatid when analyzed using confocal microscopy. Shown here are projections of an apical process labeled for EPB41 (A), actin (B), and DNA (C). As with spectrin, EPB41 is present in linear tracts (arrowheads in A) that reflect the positions of actin networks in adjacent tubulobulbar complexes (arrows in B). When the projections of the channels are merged (D) or when the Z-stacks are analyzed in 3D using Velocity software (E), it is evident that the probe for EPB41 is concentrated between adjacent actin networks of tubulobulbar complexes. The staining pattern for EPB41 (F) is absent when normal rabbit IgG is used to replace the primary antibody for EPB41 (G). (H) Western blot of testis and seminiferous epithelium lysates labeled with the EPB41 antibody and with normal rabbit IgG. A prominent band (asterisk) within the molecular weight for EPB41 is present in material labeled with the antibody that is not present in material labeled with normal mouse IgG, as are a couple of weaker bands at a higher molecular weight. Bars = 5.0 μm. To control for protein loading, bots were stripped and re-probed for calnexin.
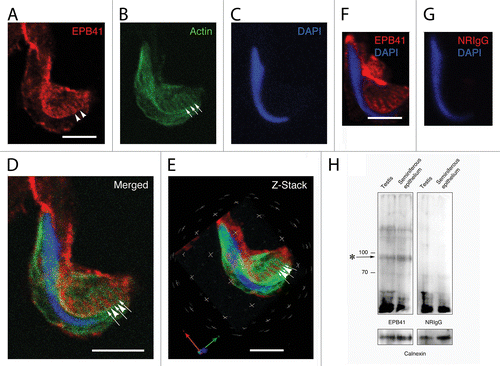
Figure 5. Localization of EPB41 in a Sertoli cell apical process containing a late spermatid when analyzed using confocal microscopy. Shown here are projections of an apical process labeled for EPB41 (A), actin (B), and DNA (C). As with spectrin, EPB41 is present in linear tracts (arrowheads in A) that reflect the positions of actin networks in adjacent tubulobulbar complexes (arrows in B). When the projections of the channels are merged (D) or when the Z-stacks are analyzed in 3D using Velocity software (E), it is evident that the probe for EPB41 is concentrated between adjacent actin networks of tubulobulbar complexes. The staining pattern for EPB41 (F) is absent when normal rabbit IgG is used to replace the primary antibody for EPB41 (G). (H) Western blot of testis and seminiferous epithelium lysates labeled with the EPB41 antibody and with normal rabbit IgG. A prominent band (asterisk) within the molecular weight for EPB41 is present in material labeled with the antibody that is not present in material labeled with normal mouse IgG, as are a couple of weaker bands at a higher molecular weight. Bars = 5.0 μm. To control for protein loading, bots were stripped and re-probed for calnexin.

Figure 6. Plectin localization in apical Sertoli cell processes. The position of the spermatid head in the apical process is visible in the phase image (A) and when the DNA is labeled with DAPI (B). The probe for plectin reacts with material in the apical process that appears to form a network adjacent to the concave face of the spermatid head (C). Visible within this network are more concentrated bars of staining (arrowheads in C) that appear to lie between the tubulobulbar complexes as indicated by the actin probe (arrows in D). This alternating actin and plectin pattern is evident when the channels are merged (E). A staining pattern similar to that in material treated with the probe for plectin is absent when the primary antibody is replaced with normal mouse IgG (F). Bars = 5.0 μm.
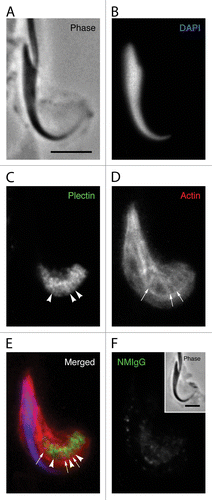
Figure 6. Plectin localization in apical Sertoli cell processes. The position of the spermatid head in the apical process is visible in the phase image (A) and when the DNA is labeled with DAPI (B). The probe for plectin reacts with material in the apical process that appears to form a network adjacent to the concave face of the spermatid head (C). Visible within this network are more concentrated bars of staining (arrowheads in C) that appear to lie between the tubulobulbar complexes as indicated by the actin probe (arrows in D). This alternating actin and plectin pattern is evident when the channels are merged (E). A staining pattern similar to that in material treated with the probe for plectin is absent when the primary antibody is replaced with normal mouse IgG (F). Bars = 5.0 μm.

Figure 7. Immunoelectron microscopy of sections labeled for plectin and spectrin. (A) In conventional electron micrographs, the actin network surrounding the central plasma membrane elements (arrows) of tubulobulbar complexes is clearly evident as a dense cuff. (B) This image is the same as in (A), but with the actin rich cuffs circled by the black lines in three of the five complexes. (C) The upper two images are of tubulobulbar complexes labeled for plectin, and the lower image is of the specificity control labeled with normal mouse IgG (NMIgG). The arrows indicate the central membrane elements of each complex. Notice that the gold particles are excluded from the actin cores in material labeled for plectin. (D) The upper two images are of tubulobulbar complexes labeled for spectrin, and the lower image is of the specificity control labeled with normal mouse IgG (NMIgG). The arrows indicate the central membrane elements of each complex. Gold particles are generally excluded from the actin cores. (A and B) Bar = 500 nm. (C and D) Bar = 200 nm.
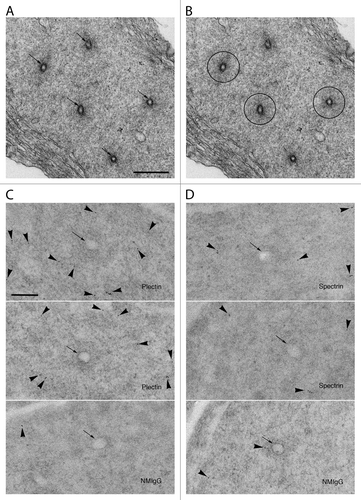
Figure 7. Immunoelectron microscopy of sections labeled for plectin and spectrin. (A) In conventional electron micrographs, the actin network surrounding the central plasma membrane elements (arrows) of tubulobulbar complexes is clearly evident as a dense cuff. (B) This image is the same as in (A), but with the actin rich cuffs circled by the black lines in three of the five complexes. (C) The upper two images are of tubulobulbar complexes labeled for plectin, and the lower image is of the specificity control labeled with normal mouse IgG (NMIgG). The arrows indicate the central membrane elements of each complex. Notice that the gold particles are excluded from the actin cores in material labeled for plectin. (D) The upper two images are of tubulobulbar complexes labeled for spectrin, and the lower image is of the specificity control labeled with normal mouse IgG (NMIgG). The arrows indicate the central membrane elements of each complex. Gold particles are generally excluded from the actin cores. (A and B) Bar = 500 nm. (C and D) Bar = 200 nm.

Figure 8. Model of the spectrin and plectin distributions around apical tubulobulbar complexes in the rat. Spectrin and plectin together form a network that is excluded from the actin-rich zones of tubulobulbar complexes; rather this network appears to surround individual tubulobulbar complexes and may link adjacent complexes together.
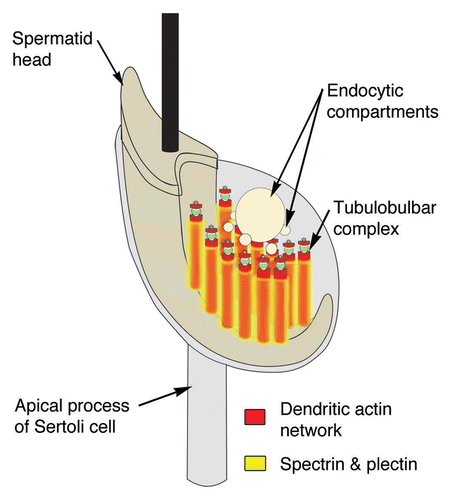
Figure 8. Model of the spectrin and plectin distributions around apical tubulobulbar complexes in the rat. Spectrin and plectin together form a network that is excluded from the actin-rich zones of tubulobulbar complexes; rather this network appears to surround individual tubulobulbar complexes and may link adjacent complexes together.