1,204
Views
11
CrossRef citations to date
0
Altmetric
Report

Germ cells contribute to the function of the Sertoli cell barrier

An in vitro study

, , , &
Article: e26460 | Received 01 Aug 2013, Accepted 11 Sep 2013, Published online: 20 Sep 2013

Figures & data

Figure 1. Effects of germ cells on the Sertoli cell permeability barrier in vitro. Sertoli cells (SC) were seeded on Matrigel™-coated culture inserts at either 0.5 × 10⁶ cells/cm2 or 1.2 × 10⁶ cells/cm2 (time 0), and the first TER measurement was recorded 24 h thereafter. On day 3 in vitro, germ cells (GC) were isolated from the testes of 25- or 90- (adult) d-old rats, added to Sertoli cells (0.5 × 10⁶ cells/cm2) at a Sertoli:germ cell ratio of 1:3 (arrow) and cocultured for an additional 3 d. Germ cells isolated from 25-d-old rat testes consisted largely of spermatogonia and primary spermatocytes with few secondary spermatocytes and round spermatids. Successive passages through glass wool removed elongating/elongated spermatids and spermatozoa from 90-d-old germ cell isolations. TER measurements continued to be recorded at least once daily after the addition of germ cells. Controls consisted of culturing Sertoli cells at 0.5 × 10⁶ cells/cm2 and 1.2 × 10⁶ cells in the absence of germ cells. Each error bar represents a mean ± SD of quadruple culture inserts. This experiment was performed four independent times using different batches of Sertoli and germ cells, with similar results obtained each time. For statistical analyses, each SC:GC coculture data point was compared with its corresponding SC culture (0.5 × 10⁶ cells/cm2) data point. *, P < 0.05; **, P < 0.01 (ANOVA followed by Tukey’s post hoc test).
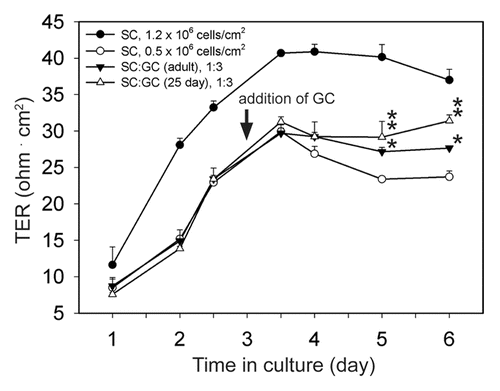
Figure 1. Effects of germ cells on the Sertoli cell permeability barrier in vitro. Sertoli cells (SC) were seeded on Matrigel™-coated culture inserts at either 0.5 × 10⁶ cells/cm2 or 1.2 × 10⁶ cells/cm2 (time 0), and the first TER measurement was recorded 24 h thereafter. On day 3 in vitro, germ cells (GC) were isolated from the testes of 25- or 90- (adult) d-old rats, added to Sertoli cells (0.5 × 10⁶ cells/cm2) at a Sertoli:germ cell ratio of 1:3 (arrow) and cocultured for an additional 3 d. Germ cells isolated from 25-d-old rat testes consisted largely of spermatogonia and primary spermatocytes with few secondary spermatocytes and round spermatids. Successive passages through glass wool removed elongating/elongated spermatids and spermatozoa from 90-d-old germ cell isolations. TER measurements continued to be recorded at least once daily after the addition of germ cells. Controls consisted of culturing Sertoli cells at 0.5 × 10⁶ cells/cm2 and 1.2 × 10⁶ cells in the absence of germ cells. Each error bar represents a mean ± SD of quadruple culture inserts. This experiment was performed four independent times using different batches of Sertoli and germ cells, with similar results obtained each time. For statistical analyses, each SC:GC coculture data point was compared with its corresponding SC culture (0.5 × 10⁶ cells/cm2) data point. *, P < 0.05; **, P < 0.01 (ANOVA followed by Tukey’s post hoc test).

Figure 2. Expression of BTB constituent genes by Sertoli and germ cells, and the testis. Germ cells (GC, n = 3) were isolated from 90-d-old rat testes and immediately harvested in either TRIzol® reagent or lysis buffer. Sertoli cells (SC, n = 2) were isolated from 20-d-old rat testes, seeded onto Matrigel™-coated 12-well plates at 0.5 × 10⁶ cells/cm2, hypotonically treated and cultured for 4 d before being harvested as described above. Testes (T, n = 2) were obtained from 90-d-old rats and used either for RNA extraction or lysate preparation. RT-PCR and immunoblotting were used to determine whether occludin (A), tricellulin (B), claudin-1 (C), claudin-5 (D), claudin-11 (E), JAM-A (F), CAR (G), FAK (H), AR (I), ZO-1 (J), and testin (K) were expressed by Sertoli and germ cells, and the testis. S-16 was used as a control in PCR experiments. and list the primers and antibodies, respectively, that were used for this experiment. M, marker; bp, base pair; IB, immunoblotting.
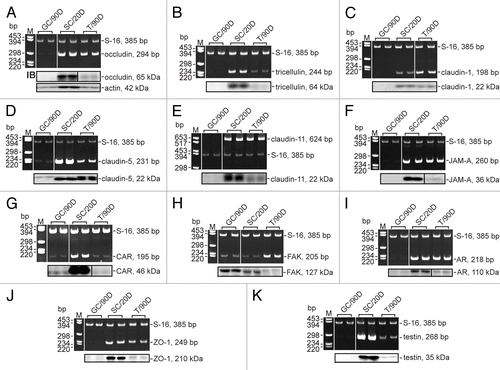
Figure 2. Expression of BTB constituent genes by Sertoli and germ cells, and the testis. Germ cells (GC, n = 3) were isolated from 90-d-old rat testes and immediately harvested in either TRIzol® reagent or lysis buffer. Sertoli cells (SC, n = 2) were isolated from 20-d-old rat testes, seeded onto Matrigel™-coated 12-well plates at 0.5 × 10⁶ cells/cm2, hypotonically treated and cultured for 4 d before being harvested as described above. Testes (T, n = 2) were obtained from 90-d-old rats and used either for RNA extraction or lysate preparation. RT-PCR and immunoblotting were used to determine whether occludin (A), tricellulin (B), claudin-1 (C), claudin-5 (D), claudin-11 (E), JAM-A (F), CAR (G), FAK (H), AR (I), ZO-1 (J), and testin (K) were expressed by Sertoli and germ cells, and the testis. S-16 was used as a control in PCR experiments. Tables 1 and 2 list the primers and antibodies, respectively, that were used for this experiment. M, marker; bp, base pair; IB, immunoblotting.

Figure 3. Steady-state TJ and ES protein levels after coculture of germ cells with Sertoli cells. Sertoli cells (SC) were isolated from the testes of 20-d-old rats and seeded onto Matrigel™-coated 12-well plates at 0.5 × 10⁶ cells/cm2. On day 3 in vitro, germ cells (GC) were isolated from the testes of 90-d-old rats, added to Sertoli cells at a Sertoli:germ cell ratio of 1:5 (time 0), and cocultured. Thereafter, cocultures (SC+GC) were terminated at different time points ranging from 0 h to 4 d. The control consisted of Sertoli cells cultured alone and terminated at identical time points. Lysates were obtained, and immunoblotting was performed as detailed in Materials and Methods and . Immunoblots assessed changes in the steady-state levels of occludin (A), tricellulin (B), claudin-5 (C), claudin-11 (D), JAM-A (E), CAR (F), FAK (G), AR (H), ZO-1 (I), N-cadherin (J), α-catenin (K), and β-catenin (L) after the addition of germ cells. To ensure equal loading of proteins, immunoblots were probed with an anti-actin antibody (A). Immunoblots were scanned to generate composite histograms (A–L). The relative protein level corresponding to Sertoli cells cultured alone at time 0 h (black bar) was arbitrarily set at 1. Each error bar represents a mean ± SD of three to five independent experiments using different batches of Sertoli and germ cells. For statistical analyses, each SC-GC coculture data point was compared with its corresponding control at 0 h (gray bar). * P < 0.05; **, P < 0.01 (Student’s t-test). lists the antibodies that were used for this experiment.
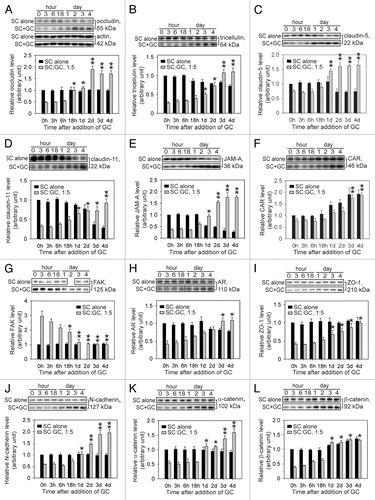
Figure 3. Steady-state TJ and ES protein levels after coculture of germ cells with Sertoli cells. Sertoli cells (SC) were isolated from the testes of 20-d-old rats and seeded onto Matrigel™-coated 12-well plates at 0.5 × 10⁶ cells/cm2. On day 3 in vitro, germ cells (GC) were isolated from the testes of 90-d-old rats, added to Sertoli cells at a Sertoli:germ cell ratio of 1:5 (time 0), and cocultured. Thereafter, cocultures (SC+GC) were terminated at different time points ranging from 0 h to 4 d. The control consisted of Sertoli cells cultured alone and terminated at identical time points. Lysates were obtained, and immunoblotting was performed as detailed in Materials and Methods and Table 2. Immunoblots assessed changes in the steady-state levels of occludin (A), tricellulin (B), claudin-5 (C), claudin-11 (D), JAM-A (E), CAR (F), FAK (G), AR (H), ZO-1 (I), N-cadherin (J), α-catenin (K), and β-catenin (L) after the addition of germ cells. To ensure equal loading of proteins, immunoblots were probed with an anti-actin antibody (A). Immunoblots were scanned to generate composite histograms (A–L). The relative protein level corresponding to Sertoli cells cultured alone at time 0 h (black bar) was arbitrarily set at 1. Each error bar represents a mean ± SD of three to five independent experiments using different batches of Sertoli and germ cells. For statistical analyses, each SC-GC coculture data point was compared with its corresponding control at 0 h (gray bar). * P < 0.05; **, P < 0.01 (Student’s t-test). Table 1 lists the antibodies that were used for this experiment.

Figure 4. Localization of occludin after coculture of germ cells with Sertoli cells. Sertoli cells (SC) were isolated from 20-d-old testes and seeded onto Matrigel™-coated glass coverslips at 0.05 × 10⁶ cells/cm2. It is important to note that functional TJs and ESs were still capable of forming at this lower Sertoli cell density. On day 3 in vitro, germ cells (GC) were isolated from 90-d-old testes, added to Sertoli cells at a Sertoli:germ cell ratio of 1:5 (time 0), and cocultured for an additional 4 d at which time cells were immunostained for occludin (red) as detailed in Materials and Methods and . Sertoli (dotted-line ovals, C and D) and germ cell nuclei were visualized by DAPI (blue) staining. Corresponding images were merged (E and F). Brackets (E and F) denote the relative thickness of the immunoreactive fluorescent signal between adjacent Sertoli cells. The localization of occludin at the Sertoli–Sertoli cell interface is in agreement with previously published reports (see main text for references). Bar in A (also corresponds to B–F) = 20 μm.
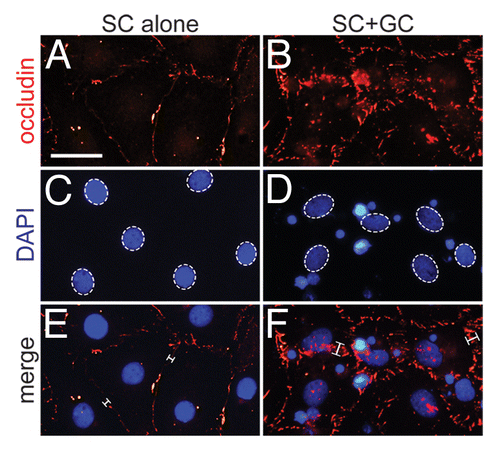
Figure 4. Localization of occludin after coculture of germ cells with Sertoli cells. Sertoli cells (SC) were isolated from 20-d-old testes and seeded onto Matrigel™-coated glass coverslips at 0.05 × 10⁶ cells/cm2. It is important to note that functional TJs and ESs were still capable of forming at this lower Sertoli cell density. On day 3 in vitro, germ cells (GC) were isolated from 90-d-old testes, added to Sertoli cells at a Sertoli:germ cell ratio of 1:5 (time 0), and cocultured for an additional 4 d at which time cells were immunostained for occludin (red) as detailed in Materials and Methods and Table 1. Sertoli (dotted-line ovals, C and D) and germ cell nuclei were visualized by DAPI (blue) staining. Corresponding images were merged (E and F). Brackets (E and F) denote the relative thickness of the immunoreactive fluorescent signal between adjacent Sertoli cells. The localization of occludin at the Sertoli–Sertoli cell interface is in agreement with previously published reports (see main text for references). Bar in A (also corresponds to B–F) = 20 μm.

Table 1. Primary antibodies used for immunoblotting and immunofluorescent staining

Table 2. Primers used for RT-PCR