Figures & data
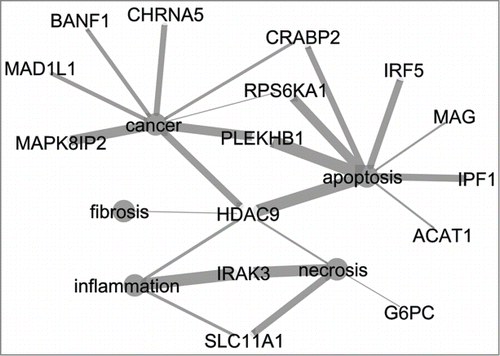
Figure 1. Graphical overview of log2 ratios of rat in vivo clinical chemistry measurements for clomipramine (A) and disulfiram (B) over time. ALP, alkaline phosphatase; TBIL, total bilirubine; AST, aspartate aminoptansferase; ALT, alanine aminotransferase; LDH, lactate dehydrogenase and GTP, Y-glutamyltranspeptidase.
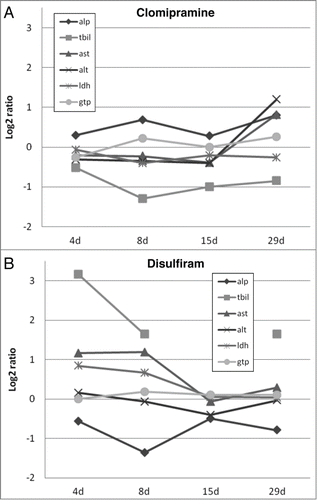
Table 1. Distribution of compounds over the training and validation set
Table 2. Accuracy for training and validation sets for each prediction model
Table 3. Result of annotation analysis in CoPub showing co-occurances for input gene set and terms for disease, general pathology and liver pathology
Figure 2. Network of 15 genes from the signature list of the 8 h medium dose prediction model and five terms related to relevant processes for DILI (cancer, apoptosis, fibrosis, necrosis, inflammation). Thickness of edges indicate the strength of the connection between the genes and terms. CytoscapeCitation19 was used to visualize the network.