Figures & data
Figure 1. E-cadherin cleavage and its influence on epithelial homeostasis. This figure summarizes extracellular and intracellular cleavage of E-cadherin as detailed in the review.
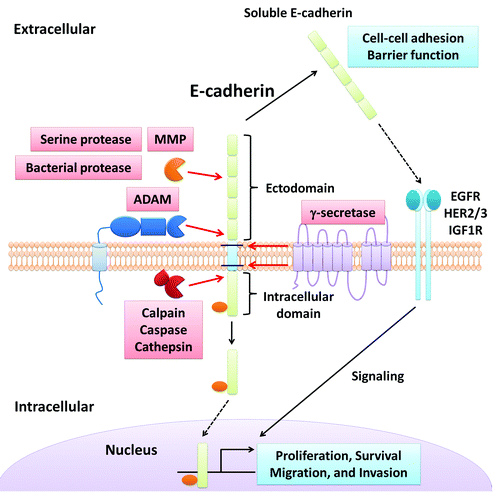
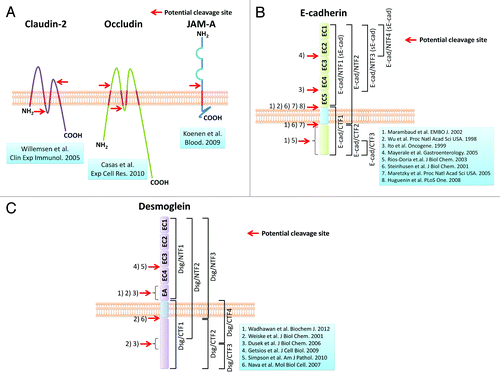
Figure 2. Potential cleavage sites in transmembrane junctional proteins. These figures demonstrate potential cleavage sites of representative transmembrane junctional proteins in epithelial cells. (A) Tight junction proteins; (B) E-cadherin; (C) desmoglein