Figures & data
Figure 1. Technical approach flow chart.
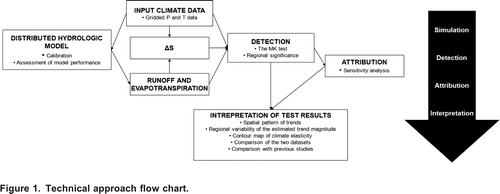
Figure 2. (a) Location of the the Mackenzie River Basin in Canada. (b) The Mackenzie River Basin showing the locations of the meteorological stations used for deriving gridded data and the locations of the hydrometric stations used for calibration and validation of the hydrological model.
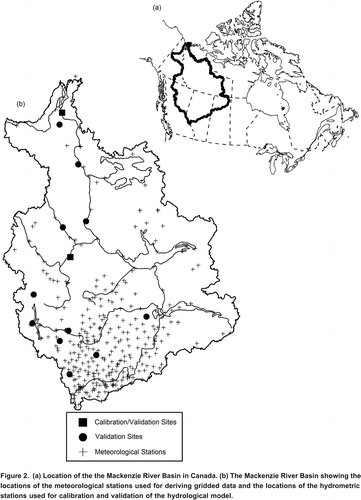
Table 1. Nash-Sutcliffe values for both data sets for a monthly time step for calibration and validation results.
Table 2. Percentage of grid cells with a significant trend (10% significance level).
Figure 3. Average temperature trend slopes on a monthly (left y-axis) and annual (right y-axis) basis for the Environment Canada and ECMWF data sets based on the 4667 grid cells.
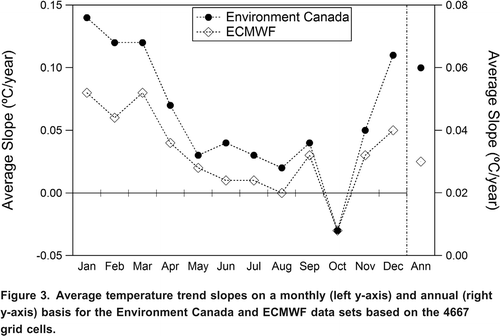
Figure 4. Spatial distribution of significant (10% significance level) annual temperature trends for the Environment Canada and ECMWF data sets.
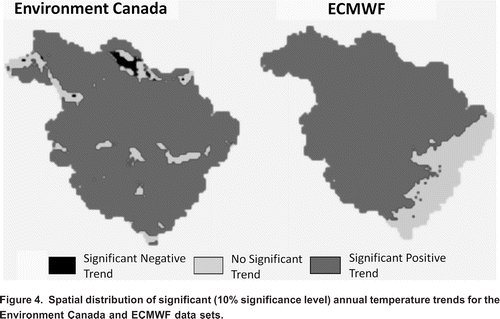
Figure 5. Average precipitation trend slopes on a monthly (left y-axis) and annual (right y-axis) basis for the Environment Canada and ECMWF data sets based on the 4667 grid cells.
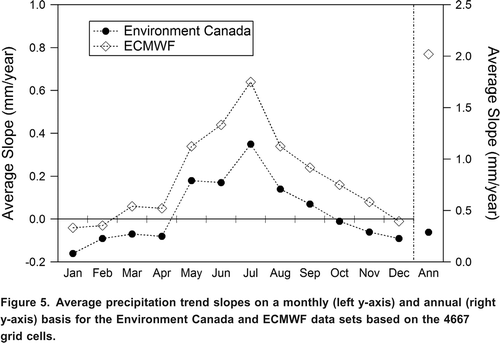
Figure 6. Spatial distribution of significant (10% significance level) annual precipitation trends for the Environment Canada and ECMWF data sets.
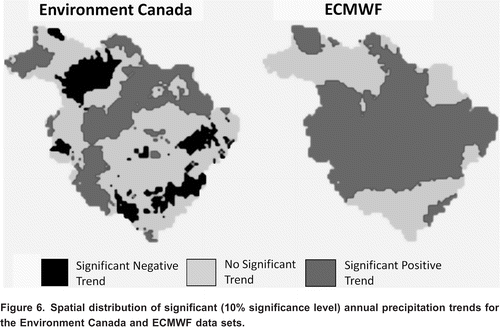
Figure 7. Average trend slopes on a monthly (left y-axis) and annual (right y-axis) basis for runoff derived using the Environment Canada and ECMWF data sets based on the 4667 grid cells.
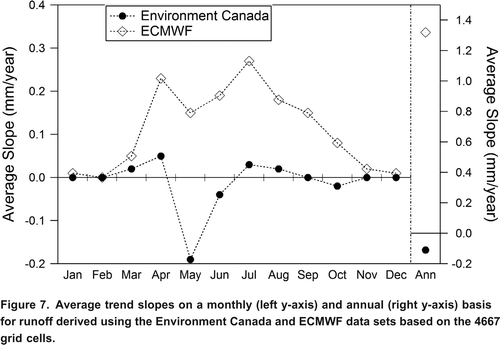
Figure 8. Spatial distribution of significant (10% significance level) annual runoff trends for the Environment Canada and ECMWF data sets.
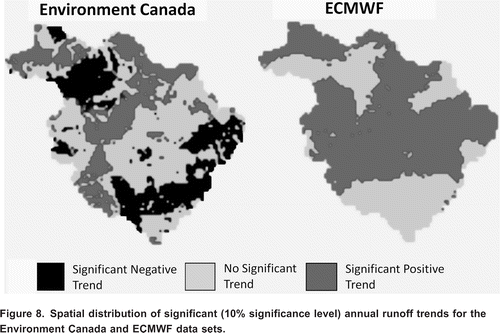
Table 3. Comparison of the percentage of grid cells in each of three trend categories (at the 10% significance level) for runoff derived using the Environment Canada and ECMWF data sets.
Figure 9. Average trend slopes on a monthly (left y-axis) and annual (right y-axis) basis for evapotranspiration derived using the Environment Canada and ECMWF data sets based on the 4667 grid cells.
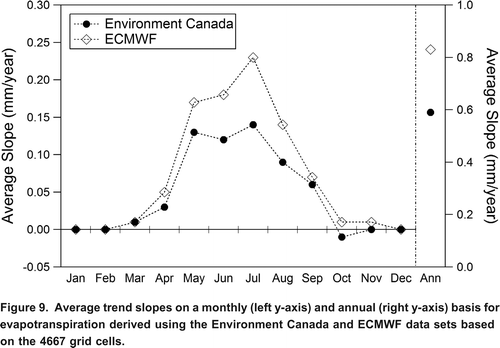
Figure 10. Spatial distribution of significant (10% significance level) annual evapotranspiration trends for the Environment Canada and ECMWF data sets.
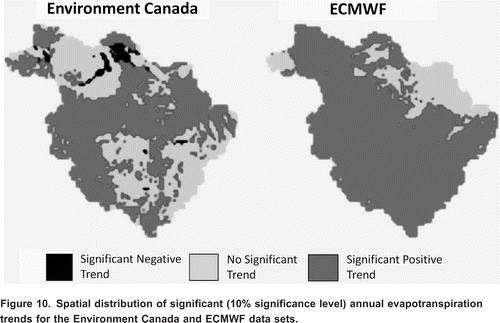
Table 4. Comparison of the percentage of grid cells in each of three trend categories (at the 10% significance level) for evapotranspiration derived using the Environment Canada and ECMWF data sets.
Figure 11. Spatial distribution of significant (10% significance level) annual storage trends for the Environment Canada and ECMWF data sets.
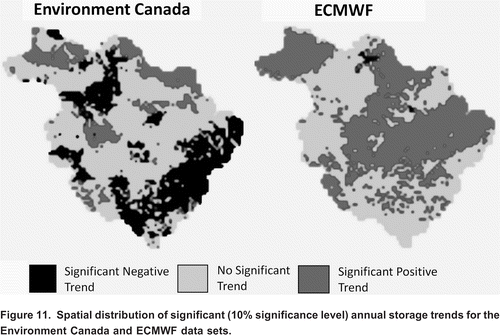
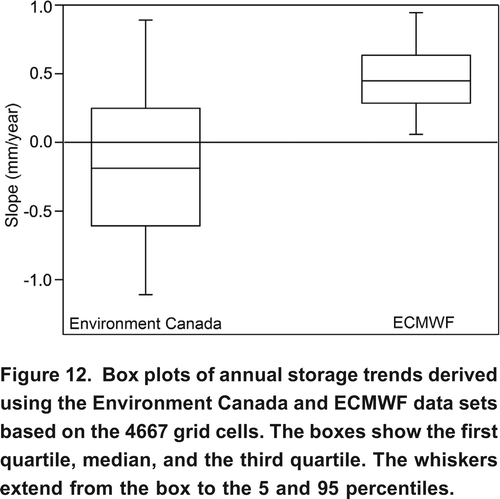
Figure 12. Box plots of annual storage trends derived using the Environment Canada and ECMWF data sets based on the 4667 grid cells. The boxes show the first quartile, median, and the third quartile. The whiskers extend from the box to the 5 and 95 percentiles.