4,877
Views
52
CrossRef citations to date
0
Altmetric
Research Papers

Rainfall Intensity Duration Frequency Curves Under Climate Change: City of London, Ontario, Canada

, &
Pages 177-189 | Published online: 23 Jan 2013

Figures & data

Figure 1. Flowchart of procedure for the CC_LB scenario (shuffling and perturbing an unmodified historical rainfall record) and CC_UB scenario (shuffling and perturbing a modified historical rainfall record using climate change factors from GCMs). In both cases, synthetic climate records are created using the Weather Generator which are then used to produce intensity-duration-frequency curves for the lower (CC_LB) and upper (CC_UB) bounds for a range of potential climate impacts.
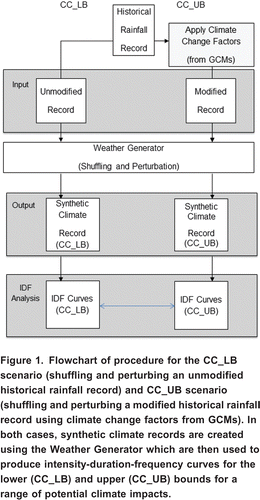
Figure 1. Flowchart of procedure for the CC_LB scenario (shuffling and perturbing an unmodified historical rainfall record) and CC_UB scenario (shuffling and perturbing a modified historical rainfall record using climate change factors from GCMs). In both cases, synthetic climate records are created using the Weather Generator which are then used to produce intensity-duration-frequency curves for the lower (CC_LB) and upper (CC_UB) bounds for a range of potential climate impacts.

Table 1. Change fields for CCSRNIES B21 scenario, used to modify historical rainfall records for the climate change upper bound (CC_UB) scenario (after Prodanovic and Simonovic, Citation2008).

Figure 2. Meteorological station used in the study (London Airport, Meteorological Services Canada ID: 6144475) in the Upper Thames River Basin of southwestern Ontario, Canada.
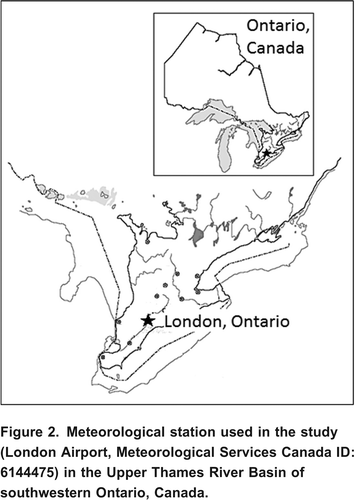
Figure 2. Meteorological station used in the study (London Airport, Meteorological Services Canada ID: 6144475) in the Upper Thames River Basin of southwestern Ontario, Canada.

Table 2. Meteorological Service of Canada; London Airport rain gauge data.

Table 3. Nine Environment Canada rainfall elements (datasets) used as input into the weather generator model (after Simonovic and Peck, Citation2009).

Figure 3. Graph of intensity-duration-frequency curves for the climate change lower bound (CC_LB) scenario. These lines are created by shuffling and perturbing historical observed rainfall records for the London Airport Station. Rainfall magnitude and intensity for a range of durations and return periods (labelled in the upper right hand corner) are provided.
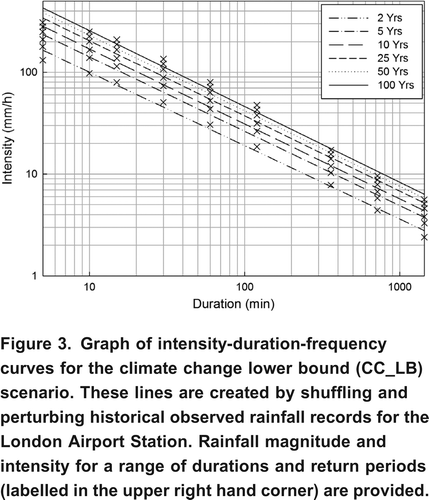
Figure 3. Graph of intensity-duration-frequency curves for the climate change lower bound (CC_LB) scenario. These lines are created by shuffling and perturbing historical observed rainfall records for the London Airport Station. Rainfall magnitude and intensity for a range of durations and return periods (labelled in the upper right hand corner) are provided.
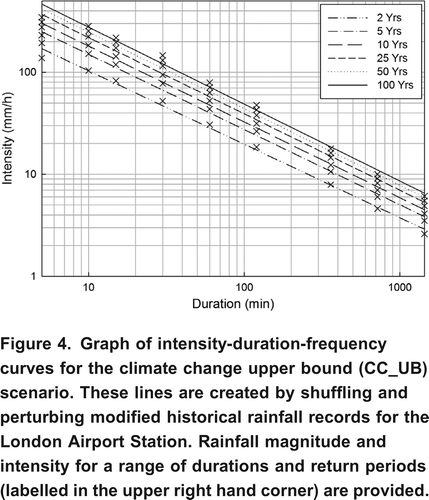
Figure 4. Graph of intensity-duration-frequency curves for the climate change upper bound (CC_UB) scenario. These lines are created by shuffling and perturbing modified historical rainfall records for the London Airport Station. Rainfall magnitude and intensity for a range of durations and return periods (labelled in the upper right hand corner) are provided.
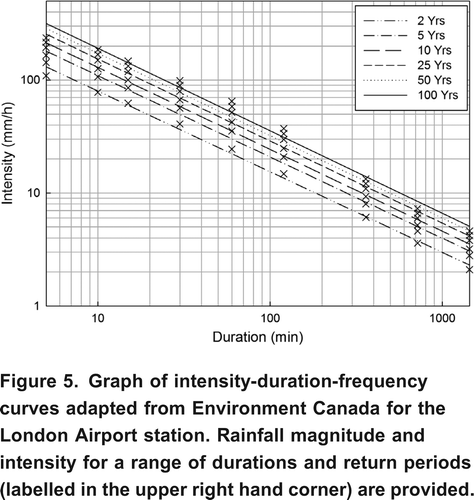
Figure 4. Graph of intensity-duration-frequency curves for the climate change upper bound (CC_UB) scenario. These lines are created by shuffling and perturbing modified historical rainfall records for the London Airport Station. Rainfall magnitude and intensity for a range of durations and return periods (labelled in the upper right hand corner) are provided.

Figure 5. Graph of intensity-duration-frequency curves adapted from Environment Canada for the London Airport station. Rainfall magnitude and intensity for a range of durations and return periods (labelled in the upper right hand corner) are provided.

Figure 5. Graph of intensity-duration-frequency curves adapted from Environment Canada for the London Airport station. Rainfall magnitude and intensity for a range of durations and return periods (labelled in the upper right hand corner) are provided.

Table 4. Depth (mm) for CC_LB scenario for various return periods.

Table 5. Depth (mm) for CC_UB scenario for various return periods.

Figure 6. Graph of intensity-duration-frequency curves for the 100-year duration for CC_LB, CC_UB and EC.
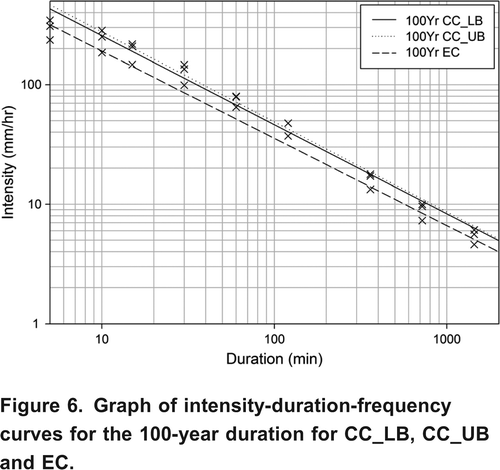
Figure 6. Graph of intensity-duration-frequency curves for the 100-year duration for CC_LB, CC_UB and EC.

Reprints and Corporate Permissions

Please note: Selecting permissions does not provide access to the full text of the article, please see our help page How do I view content?

To request a reprint or corporate permissions for this article, please click on the relevant link below:

Academic Permissions

Please note: Selecting permissions does not provide access to the full text of the article, please see our help page How do I view content?

Obtain permissions instantly via Rightslink by clicking on the button below:

If you are unable to obtain permissions via Rightslink, please complete and submit this Permissions form. For more information, please visit our Permissions help page.