Figures & data
Figure 1. Illustration of the effect of rating curve evolution for Carbon Creek near the mouth (07EF004). The dotted line shows rating curve 2 and the dashed line shows rating curve 3. The solid dots indicate the measurements used to define curve 2; the open circles indicate additional measurements available to define curve 3.
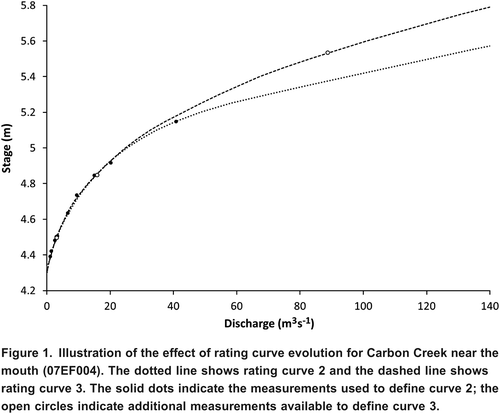
Figure 2. Illustration of the effect of rating curve evolution for Carbon Creek near the mouth (07EF004). The solid line shows curve 12. The dotted line shows curve 2 and the dashed line shows curve 3. Solid dots indicate measurements used to define curve 2; open circles indicate additional measurements used to define curve 3; open triangles indicate additional measurements used for curve 12.
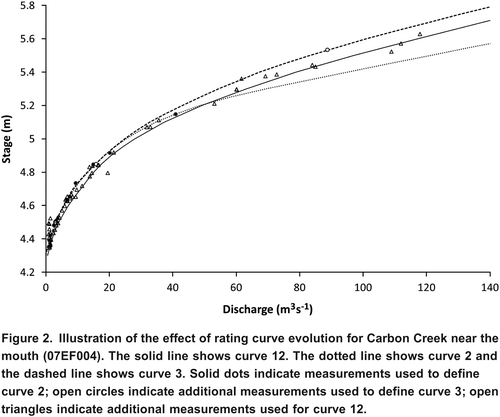
Figure 3. Rating curve for Thompson River near Spences Bridge (08LF051).
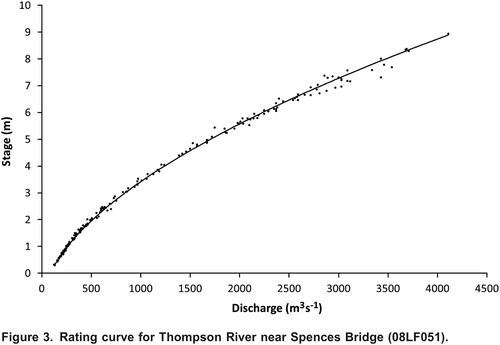
Figure 4. Ekapo Creek near Marieval (05JM010) rating curve and shift curves used for the 2007 data year. The solid line indicates the base rating curve; the open circles indicate the rating measurements; the dashed lines indicate the shifts applied over the summer of 2007 (identified by mm-dd). The shifts are due to beaver activity.
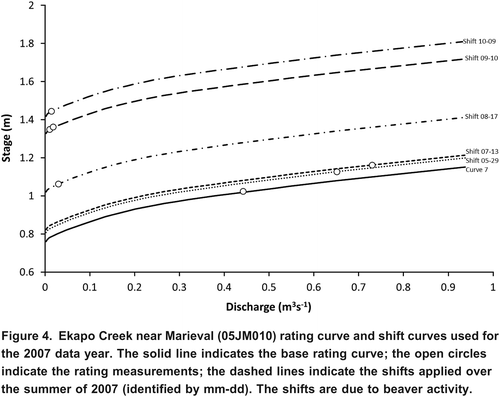
Figure 5. Illustration of the effect of changes in procedures for subjective estimation of winter streamflow for Takhini River near Whitehorse (09AC001).
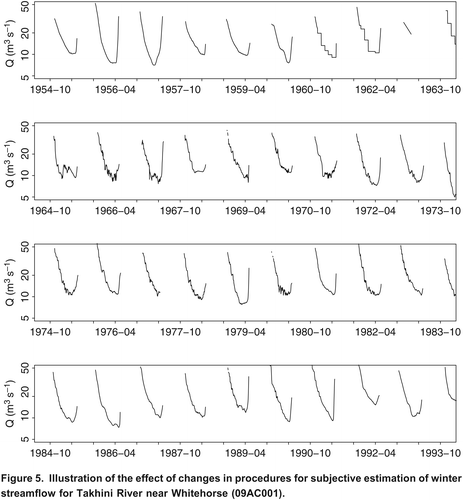
Figure 6. Illustration of the effect of changes in procedures for subjective estimation of winter streamflow for Liard River at Upper Crossing (10AA001). Grey line indicates open-water record; black line segments show the ice-cover period.
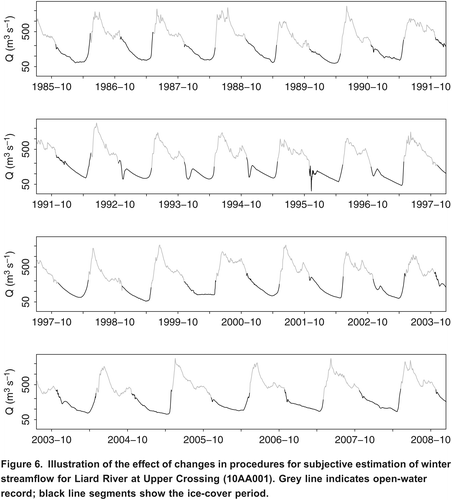
Figure 7. Simulation of the difference between discharge based on once-per-day manual observations and recorded stage for Lillooet River near Pemberton (08MG005) for the period 1997 to 2011. Qm represents discharge based on stage observed at 09:00 and Qc represents discharge computed from continuously recorded stage. a) Monthly mean streamflow, b) daily mean streamflow. Horizontal lines indicate 5% deviation from a ratio of unity.
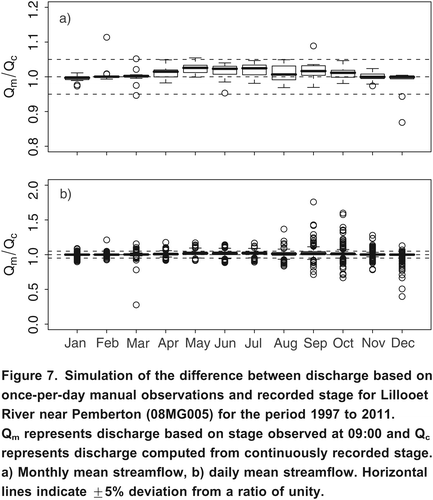
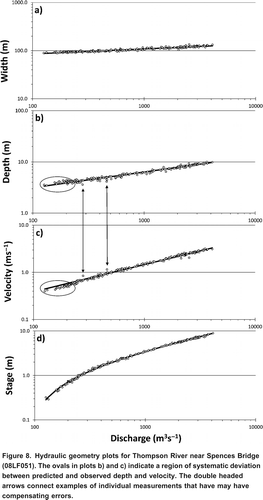
Figure 8. Hydraulic geometry plots for Thompson River near Spences Bridge (08LF051). The ovals in plots b) and c) indicate a region of systematic deviation between predicted and observed depth and velocity. The double headed arrows connect examples of individual measurements that have may have compensating errors.