1,472
Views
28
CrossRef citations to date
0
Altmetric
Research Paper

Spatial Snow Depth Assessment Using LiDAR Transect Samples and Public GIS Data Layers in the Elbow River Watershed, Alberta

, , , &
Pages 69-87 | Published online: 23 Jan 2013

Figures & data

Figure 1. Elbow River Watershed (ERW) study area in Alberta showing field and LiDAR sampling locations. ERW area background illustrated as terrain shaded relief.
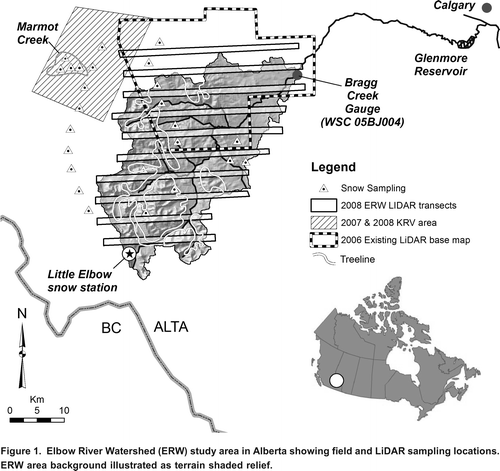
Figure 1. Elbow River Watershed (ERW) study area in Alberta showing field and LiDAR sampling locations. ERW area background illustrated as terrain shaded relief.

Figure 2. Optimal field snow depth sampling design. Four radial depth measurements were made one metre out from at each sampling location along each profile. Due to local terrain and land cover constraints, most field sample profiles at each site did not intersect at the midpoint and many were limited to a length of 50 m. Only the locations in the KRV underwent differential GPS positioning.
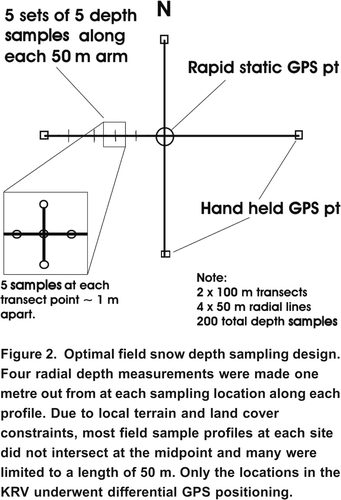
Figure 2. Optimal field snow depth sampling design. Four radial depth measurements were made one metre out from at each sampling location along each profile. Due to local terrain and land cover constraints, most field sample profiles at each site did not intersect at the midpoint and many were limited to a length of 50 m. Only the locations in the KRV underwent differential GPS positioning.

Figure 3. LSDM plotted against corresponding field measured depth within the KRV sampling locations: (a) alpine sites; (b) valley sites; (c) intermediate elevation forested slopes; (d) grouped snow depth standard deviations for the forested sites. (e) Combined alpine, forest slope and valley profiles are. (adapted from Hopkinson et al. Citation2011) [Note: forest slope data thinned by averaging (4:1) to reduce sample heteroscedacity].

Figure 3. LSDM plotted against corresponding field measured depth within the KRV sampling locations: (a) alpine sites; (b) valley sites; (c) intermediate elevation forested slopes; (d) grouped snow depth standard deviations for the forested sites. (e) Combined alpine, forest slope and valley profiles are. (adapted from Hopkinson et al. Citation2011) [Note: forest slope data thinned by averaging (4:1) to reduce sample heteroscedacity].

Figure 4. Snow depth sample data stratified by terrain aspect, canopy fractional cover, and terrain elevation. (a) LSDM results for sampling transects collected in the ERW. (b) Field sampling snow depth results collected in the ERW. (c) Temporally coincident LSDM results collected in the KRV area immediately west of the ERW.
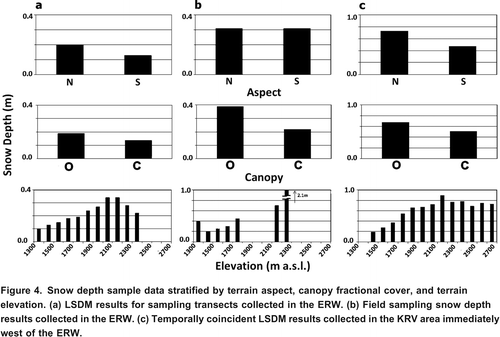
Figure 4. Snow depth sample data stratified by terrain aspect, canopy fractional cover, and terrain elevation. (a) LSDM results for sampling transects collected in the ERW. (b) Field sampling snow depth results collected in the ERW. (c) Temporally coincident LSDM results collected in the KRV area immediately west of the ERW.

Figure 5. Classification scheme used to create 10 unique snow accumulation units (SAUs) based on elevation, aspect and canopy cover. Rectangular box near centre of watershed illustrates LSDM area used to test the spatial extrapolation approach.
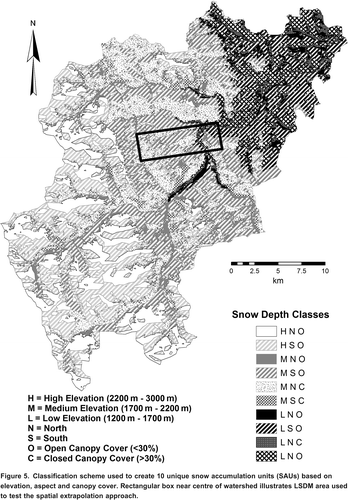
Figure 5. Classification scheme used to create 10 unique snow accumulation units (SAUs) based on elevation, aspect and canopy cover. Rectangular box near centre of watershed illustrates LSDM area used to test the spatial extrapolation approach.

Figure 6. Spatial distribution of estimated SWE across watershed.

Figure 6. Spatial distribution of estimated SWE across watershed.

Figure 7. Estimated watershed SWE at end of March relative to the increasing winter SWE at Little Elbow snow course station (2200 m a.s.l.) and the specific yield of the Elbow River Watershed at Bragg Creek.
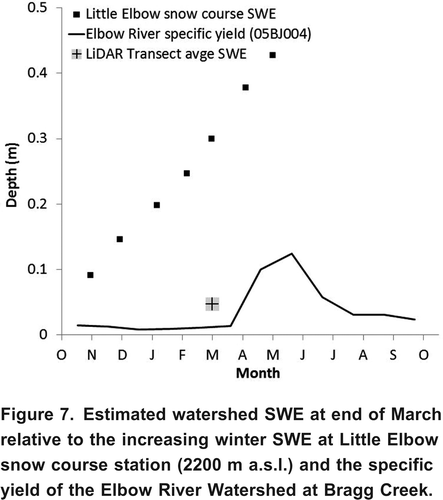
Figure 7. Estimated watershed SWE at end of March relative to the increasing winter SWE at Little Elbow snow course station (2200 m a.s.l.) and the specific yield of the Elbow River Watershed at Bragg Creek.

Figure 8. Comparison of GIS extrapolated snow depth with LSDM sampled snow depth over all 10 land surface classes with the test area.
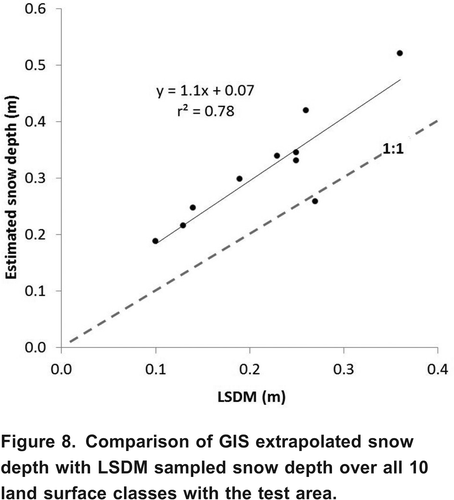
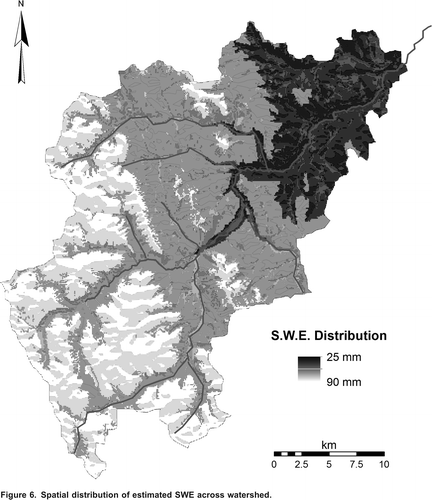
Figure 8. Comparison of GIS extrapolated snow depth with LSDM sampled snow depth over all 10 land surface classes with the test area.

Reprints and Corporate Permissions

Please note: Selecting permissions does not provide access to the full text of the article, please see our help page How do I view content?

To request a reprint or corporate permissions for this article, please click on the relevant link below:

Academic Permissions

Please note: Selecting permissions does not provide access to the full text of the article, please see our help page How do I view content?

Obtain permissions instantly via Rightslink by clicking on the button below:

If you are unable to obtain permissions via Rightslink, please complete and submit this Permissions form. For more information, please visit our Permissions help page.