Abstract
The present study provides evidence to support enhanced attention to reproductive health and comprehensive measures to increase access to quality reproductive health services. We compare and contrast the financing and utilization of reproductive health services in six sub-Saharan African countries using data from National Health Accounts and Demographic and Health Surveys. Spending on reproductive health in 2006 ranged from US$4 per woman of reproductive age in Ethiopia to US$17 in Uganda. These are below the necessary level for assuring adequate services given that an internationally recommended spending level for family planning alone was US$16 for 2006. Moreover, reproductive health spending shows signs of decline in tandem with insufficient improvement in service utilization. Public providers played a predominant role in antenatal and delivery care for institutional births, but home deliveries with unqualified attendants dominated. The private sector was a major supplier of condoms, oral pills and IUDs. Private clinics, pharmacies and drug vendors were important sources of STI treatment. The findings highlight the need to commit greatly increased funding for reproductive health services as well as more policy attention to the contribution of public, private and informal providers and the role of collaboration among them to expand access to services for under-served populations.
Résumé
La présente étude justifie d'accorder davantage d'attention à la santé génésique et de soutenir des mesures globales pour élargir l'accès à des services de santé génésique de qualité. Nous comparons le financement et l'utilisation de services de santé génésique dans six pays d'Afrique sub-saharienne au moyen de données des comptes nationaux de la santé et des enquêtes démographiques et sanitaires. Les dépenses de santé génésique en 2006 allaient de $US4 par femme en âge de procréer en Éthiopie à $US17 en Ouganda. Ces chiffres sont inférieurs au niveau requis pour assurer des services satisfaisants, puisque les dépenses recommandées au plan international pour la seule planification familiale étaient de $US16 en 2006. De plus, les dépenses de santé génésique semblent diminuer, parallèlement avec un accroissement insuffisant de l'utilisation des services. Les prestataires publics ont joué un rôle prédominant dans les soins prénatals et obstétricaux pour les naissances en milieu hospitalier, mais les accouchements à domicile sans assistance qualifiée demeuraient majoritaires. Le secteur privé était un fournisseur majeur de préservatifs, de pilules contraceptives et de stérilets. Les dispensaires privés, les pharmacies et les vendeurs de médicaments représentaient des sources importantes de traitement des IST. L'étude conclut qu'il est nécessaire d'augmenter nettement les fonds alloués aux services de santé génésique et d'accorder davantage d'attention politique à la contribution des prestataires publics, privés et informels et à leur collaboration en vue d'élargir l'accès aux services des populations sous-desservies.
Resumen
Este estudio expone evidencia para apoyar una mejor atención a la salud reproductiva y medidas integrales para ampliar el acceso a servicios de salud reproductiva de calidad. Comparamos y contrastamos el financiamiento y la utilización de dichos servicios en seis países de Ãfrica subsahariana, utilizando datos de Cuentas Nacionales de Salud y Encuestas Demográficas y de Salud. Los gastos en salud reproductiva en 2006 variaron desde US$4 por cada mujer en edad reproductiva en Etiopía, a US$17 en Uganda. Estos están por debajo del nivel necesario para asegurar servicios adecuados, dado que el nivel de gastos recomendados internacionalmente en planificación familiar nada más fue de US$16 en el 2006. Más aún, los gastos en salud reproductiva muestran signos de descenso en tándem con insuficientes mejoras en la utilización de los servicios. Los prestadores de servicios públicos desempeñaron un papel predominante en la atención antenatal y la atención del parto en casos de partos institucionales, pero dominaron los partos caseros con asistentes no calificados. El sector privado fue un principal proveedor de condones, anticonceptivos orales y DIUs. Las clínicas, farmacias y vendedores de medicamentos particulares fueron importantes fuentes de tratamiento de ITS. Los hallazgos destacan la necesidad de dedicar muchos más fondos a los servicios de salud reproductiva y más atención en políticas a los aportes de los prestadores de servicios públicos, privados y extraoficiales, así como la importancia de que colaboren entre sí para ampliar el acceso de los sectores desatendidos de la población a los servicios.
Reproductive health (RH) may no longer be the “missing” Millennium Development Goal (MDG), but it remains a neglected one.Citation1 After being left out of the 2000 formulation of the MDGs, universal access to RH was added in as a sub-component of MDG 5 on maternal health in 2005 (MDG-5b). However, this acceptance of the importance of RH has not translated into sufficient investments for achieving the stated goal of universal access. Indeed, targets for RH funding set long before the MDGs at the International Conference on Population and Development in 1994 have not been met.Citation2 From 2000 to 2007, donor assistance for family planning (FP) decreased drastically from current US$518 million to current US$462 million, or from 30% to 5% of total population assistance (which includes FP; basic RH services consisting of maternal health, abortion, information, education, and communication about RH, among other services; sexually transmitted infections (STIs), HIV/AIDS, and basic research, data, and population and development policy analysis). Funding for basic RH services other than FP and STIs was also reduced from 30% to 17% of the total population assistance.Citation3
Low funding for RH is a cause for concern, given that RH service utilization in the vast majority of the developing world is well below desired levels. Worldwide, 21.6 million unsafe abortions took place in 2008, a nearly 2 million increase from the estimated 19.7 million in 2003.Citation4 Approximately 5 million women are estimated to be hospitalized each year for the treatment of complications from unsafe abortions.Citation5 In sub–Saharan Africa, only 17% of married women of reproductive age use modern contraception, and 39% of pregnancies in the region are unintended.Citation6 Furthermore, inequalities in access to RH services within countries across different socio-economic groups remain stark.Citation7 Ultimately, the mismatch between funding and the need for effective and equitable delivery of RH services threatens progress towards achieving universal access to RH by 2015.
Using data on financing and utilization of RH services in six sub–Saharan African countries, this paper provides evidence to make a strong case for the global health community to strengthen its financial and political commitment to ensuring universal access to RH. While the utilization data are drawn from the Demographic and Health Surveys (DHS), the health financing data are drawn from the RH Subaccount (RHS) of the National Health Accounts (NHA) framework. Combining financing and utilization data in these six countries allows us to gain insight into key constraints in the region, which can serve as a valuable addition to the global picture reviewed above. In particular, our analysis highlights the link between recent levels and trends in RH funding and utilization in the six countries studied. In examining the key stakeholders in financing and delivering RH services, we pay special attention to the role of the private sector in RH service provision, which we argue may be leveraged to improve access to quality RH services for under-served populations.
Methodology
Six countries were selected for the analysis based on the availability of NHA RHS data: Ethiopia, Kenya, Malawi, Rwanda, Tanzania, and Uganda. As the NHA RHS is relatively new, estimates have been completed in only a few countries. Of the six countries, Rwanda and Tanzania have RHS estimates for 2002 and 2006, facilitating an examination of changes over this period. DHS data were selected to match the timing of the RHS as closely as possible. DHS data were downloaded from Measure DHS's website;Citation8 NHA data were obtained from country reports.Citation9–15 As shown in Table 1
Table 1
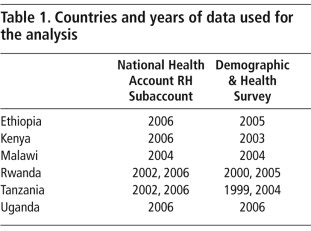
in most cases, the timing of NHA and DHS follow each other closely. The study covers the years 1999–2006.
National Health Accounts and Reproductive Health Subaccounts
NHA is an internationally accepted tool used to estimate a country's total spending on health activities.Citation16 By comprehensively tracking the flow of funds through a country's health system, it provides information on the distribution of health spending across major financing sources, key stakeholders who manage health spending, the providers of services, and the type of services utilized. With the support from the World Health Organization, World Bank, US Agency for International Development and other major international organizations, NHA estimations have been conducted in more than 100 countries over the past 20 years.
The NHA subaccounts are designed to provide more detailed information about priority health areas such as RH, HIV/AIDS, tuberculosis, malaria, and child health. The RHS estimates total spending on RH services, which includes broadly FP, maternal health, and sexual health (including STIs). In the case of RH interventions that overlap with other subaccount areas, such as HIV/AIDS and child health, the guidelines recommend estimation techniques to assess the “primary purpose” in order to attribute spending accurately.Citation17
While all country RHS follow the same general definitions and boundaries in accordance with international norms, each country obtains its estimates from different sources and possibly different survey instruments. This may result in varying rigor and use of estimation techniques, in particular for disaggregating different components of RH spending. Therefore, our analysis, for the most part, only presents overall RH spending figures, which are more reliable and comparable across countries, rather than disaggregating spending for FP, maternal health, STIs, and other RH services. Estimates of health spending from different rounds of RHS were converted to 2005 real US$ to adjust for inflation using consumer price index data from the World Bank.
Demographic and Health Survey data
The DHS data format is highly standardized, allowing for easy comparison across countries and years. However, it is worth noting a few variations in the DHS format that impact our analysis. First, while most surveys asked about condom use among men, some did not (Malawi, 2004; Rwanda, 2000 and 2005; Tanzania, 1999 and 2004). To ensure consistency, the information on source of condoms in our analysis is based only on women's reporting. Second, our data on STI care combine information collected from both men and women for all countries, but not for the 2004 Tanzania DHS, which did not include STI-related questions for men. In all surveys, some questions on sources of care allowed respondents to provide more than one answer. On closer inspection, we found that the number of respondents reporting more than one source of care was extremely small (less than 2% of all respondents). The analysis thus dropped such observations so that the variable on choice of provider would be both exhaustive and mutually exclusive. All estimations take into account complex survey design and sampling weights.
Caveats are required when interpreting the study's results regarding data comparability. The RHS captures all RH-related expenditures, including prevention, curative services, commodities, research and development, and management. The information obtained from DHS pertains only to commodities (contraceptives) and services (FP, antenatal care (ANC), delivery care, and STIs). Ultimately, prevention, research and development, and other public health functions should endeavor to improve utilization outcomes. Furthermore, FP, ANC, delivery, and STIs services account for a major share of RH spending in the subaccounts. For such reasons, the lack of complete congruence between NHA and DHS data does not affect comparisons between RH financing and service utilization provided in this analysis.
Service providers noted in the analysis consist of public and private sectors. Within the latter, we distinguish between the private not-for-profit sector, which is comprised of non-governmental and faith-based organizations, and the private for-profit sector, which is highly heterogeneous, ranging from modern hospitals to drug peddlers. Following the practice in the literature, the formal private sector in this analysis includes private facilities (hospitals and clinics), whereas the informal private sector includes a wide array of unqualified providers, such as pharmacies, drug vendors, traditional healers, traditional birth attendants (TBAs) and village doctors.Citation18–20
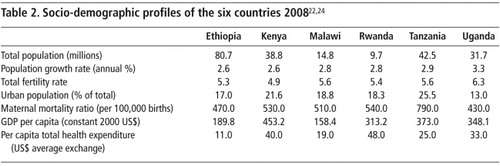
Table 2 Citation22Citation24
Findings
The cross-country comparison of RH spending and utilization rates reveals low RH spending levels and a rather dismal utilization picture, with a strong association between them. There is significant reliance on donor and individual households for funding RH, neither of which guarantees sustainability, equity or efficiency. While the public sector is the main provider of ANC and delivery care for women who deliver in a facility, an overwhelming majority of home births are assisted by informal sector attendants.
Financing RH services: overall spending levels
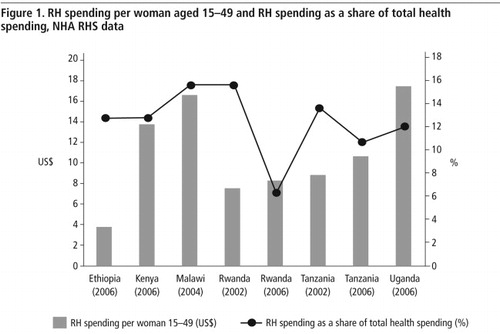
In 2003, the Guttmacher Institute and UNFPA estimated the unit cost (capital plus overheads) of providing modern contraception and meeting unmet need for family planning in developing countries to be US$16.Citation21 Yet most study countries spent less than US$16 for all RH services and commodities.
In addition to tracking RH spending in absolute terms, an assessment of RH spending as a proportion of total health spending is indicative of the importance accorded to RH vis-à-vis other health priorities. As shown in , although Ethiopia spent the least among the six countries in absolute value, its share of RH expenditure in total health expenditure in 2006 was larger than Uganda's, which had the highest spending in absolute value. Moreover, while there was a slight increase in RH spending per woman in Rwanda and Tanzania between 2002 and 2006, the share of RH in total health expenditure decreased markedly, particularly in Rwanda, from 15.7% to 6.3%. This can be explained by a major increase in total health expenditure per capita in Rwanda in the same period (from US$8 to US$34 per capita, at average exchange rate).Citation22 Thus, in these two countries, evidence suggests that RH lost ground in terms of its share of total health spending and therefore its importance among health priorities.
Share of financing sources for RH
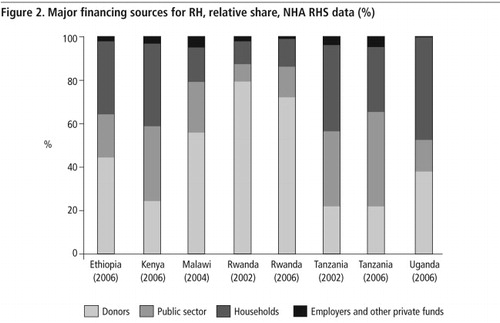
Major stakeholders managing RH spending
Who decides and controls how resources are spent?
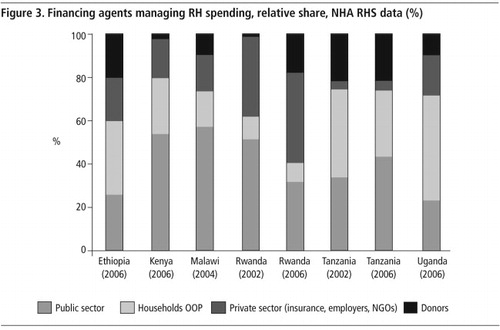
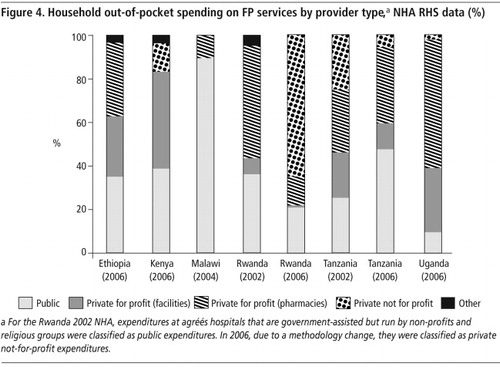
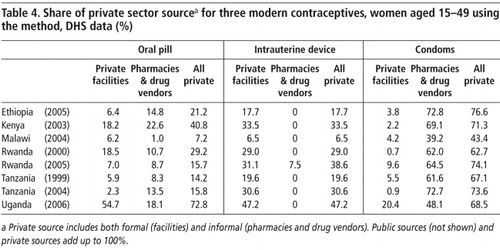
Household OOP expenditure accounted for a substantial share of total RH spending in most countries, the highest being in Uganda at 48% of total spending. This signals a financial burden on households, which could deter people, especially those with limited resources, from accessing necessary RH services.
Given the importance of household OOP spending, it is useful to see where households spent their money. For FP,
Utilization of RH services
Health expenditure captures inputs into the health system. To assess performance, health system outputs need to be examined. Table 3
Table 3
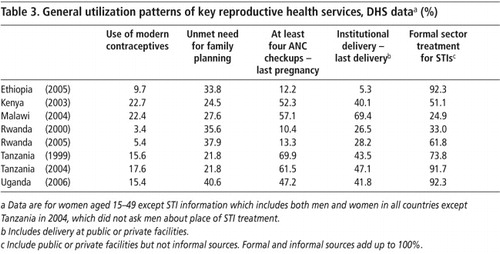
Antenatal care utilization also shows wide variation between the six countries. The proportion of at least four ANC visits ranged from about 60% in Malawi and Tanzania in 2004 to 12–13% in Ethiopia and Rwanda in 2005. However, Tanzania's ANC utilization declined by nearly 9% between 1999 and 2004. In Ethiopia in 2005, moreover, only 5.3% of most recent deliveries took place in a health facility, which explains the high maternal mortality ratios. In Rwanda and Tanzania again there was only a small improvement in this indicator, less than a 4% increase in institutional delivery in five years.
For the proportion of survey respondents using a formal source for STI care, responses from women and men are pooled except for Tanzania in 2004. Because some DHS data do not allow for a distinction between public and private facilities, formal source of care in this case combines both public and private. Interestingly, Ethiopia and Uganda, which do not do well in other RH services, showed a high level of formal care seeking for STI (92%), and Rwanda rose from 33% in 2000 to 62% in 2005. Overall, the picture is relatively more positive for STI care than other services, although informal sources still account for 75% of STI care in Malawi.
It is telling that the utilization patterns in Table 3 closely match the financing picture in . Ethiopia is an outstandingly low spender on RH services and programmes and has the least impressive utilization indicators, excepting STI care. On the other hand, Malawi, Kenya, and Uganda, with stronger RH investments, show better overall utilization profiles. For Rwanda and Tanzania, the modest improvement or deterioration over time happened when RH spending decreased as a share of total health expenditure (). Only STI care follows a different pattern, as it is largely funded out of more robustly-funded HIV/AIDS budgets.
Key providers of RH services
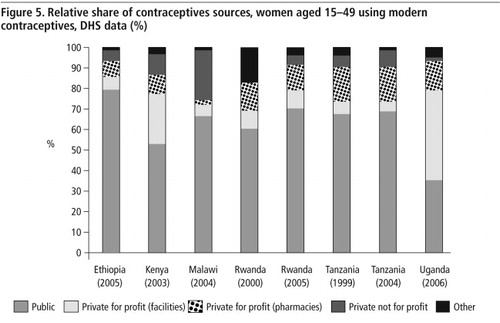
Different providers may be more or less suited to distributing certain contraceptives. To explore the role of the private for-profit sector, Table 4
Table 4
For ANC, public hospitals and clinics constituted the major source of care, accounting for 69–97% of all ANC checkups. The role of the private formal sector was small but non-trivial in Ethiopia (8%), Kenya (13%), and Uganda (17%). In Kenya, Malawi, and Tanzania, mission and NGO facilities also play a significant role (15%, 18%, and 10%, respectively) (data not shown).
For home deliveries, the type of assistance women relied on is shown in
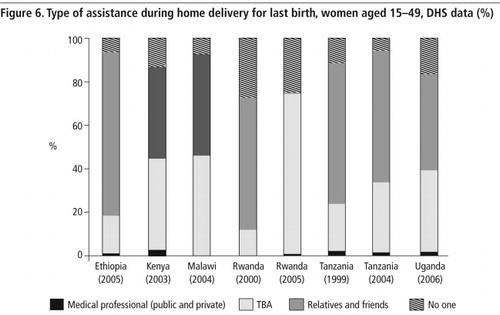
which distinguishes among different types of birth attendants. Qualified medical professionals from either public and private sectors (which are impossible to separate in the DHS) were rarely present at home delivery. Traditional birth attendants, as well as relatives and friends, accounted for a large share of home delivery assistance.
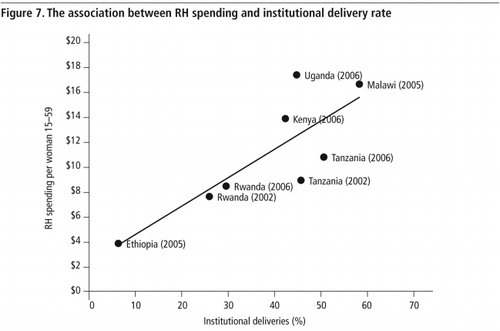
Association between RH financing and utilization
Although documenting a causal relationship between RH financing and the resultant utilization of RH services is beyond the scope of this paper, the previous section suggests that utilization and spending patterns match with each other rather well in the six countries. To illustrate this further, we plotted RH spending per woman aged 15–49 against institutional delivery rate (
Discussion
A number of key issues emerge from this analysis. First, spending on RH services in all six sub-Saharan African countries examined here is far lower than what is required to meet the needs of their populations. These six countries are not even meeting the global benchmark for FP spending, let alone for ensuring universal coverage for a comprehensive package of RH services. Hence, this study underscores the need for increased investment from all sectors and for countries to work out their own financing strategies and mobilize resources.
The second issue is the role of donors. A majority of RH spending in Malawi and Rwanda is financed by donors; even in Tanzania, which is the strongest in terms of garnering domestic resources for RH spending, donors are responsible for over 20% of total RH spending. This raises the issue of sustainability. Even as we call for greater spending on RH, we would caution against increased donor contributions in the absence of corresponding domestic investments for RH, and a clear plan for how countries can phase out donor support in the future.
The third issue relates to changes in RH financing over time. As the trend data presented here are for Rwanda and Tanzania only, we cannot draw general conclusions. However, the pattern in both countries gives cause for concern, as the evidence suggests that prioritization of funding for RH appeared to decline between 2002 and 2006. In contrast, funding for HIV/AIDS in these countries increased by a magnitude of four on average.Citation23 Data from another round of RHS will allow us to ascertain whether this trend is continuing in Rwanda and Tanzania, and whether or not a similar pattern is discernable across sub-Saharan Africa.
Fourthly, the analysis finds considerable heterogeneity between countries in terms of the relative role of different types of service providers. Overall, however, it shows that RH service utilization levels in all six countries are highly inadequate. The continuing large role played by the informal sector both for attendance at home delivery and STI treatment poses well-known concerns about safety, efficacy and quality of care.
Lastly there is the link between spending and utilization. While the data from this study are insufficient to prove causation, the analysis presented here does suggest that higher spending on RH is associated with better utilization rates. Under-financing is a key constraint for countries in achieving universal access to reproductive health.
Attempts at comparative analysis across several countries must recognize that countries are highly heterogeneous. We have noted common trends and patterns rather than delving into each country's particulars, which can make for illuminating case studies. The analysis of both financing and utilization trends is purely descriptive and therefore prevents us from making direct causal inferences about the effects of financing on service utilization or vice versa.
Limitations notwithstanding, the analysis contributes to efforts to revitalize interest in RH by highlighting the confluence of two gaps: the gap in financing for RH, and the gap in access to care. Future work can build on this analysis and similar ones for other countries in many ways. For example, it would be useful to develop a country case study that examines the link between financing and utilization trends, and looks at these in the light of national policy and programmes, and the perspectives of both service providers and patients. It would also be instructive to conduct NHA RHSs in more countries (if not all countries) in order to trace financing data systematically. Finally, ensuring that DHS and other surveys continue to capture data on public, private and informal sector sources of services, commodities and treatments will permit the continued tracking of utilization trends and the ability to assess each sector's contributions to sexual and reproductive health.
Acknowledgements
The authors wish to thank Ruth Berg and Sara Sulzbach for their comments on an earlier version of this paper and Sharon Nakhimovsky and Wendy Wong for research assistance. This study was conducted under the auspices of the Private Sector Partnerships – One (PSP–One) project, Abt Associates Inc. Funding for the project was provided by the United States Agency for International Development. The views expressed in the paper are the authors' alone.
References
- WA Campbell, TW Merrick, AS Yazbeck. Reproductive health: the Missing Millennium Development Goal. 2006; World Bank: Washington DC.
- S Bernstein, L Say, S Chowdhury. Sexual and reproductive health: completing the continuum. Lancet. 371: 2008; 1225–1226.
- United Nations Population Fund. Financial resource flows for population activities in 2008. 2010; UNFPA: New York.
- World Health Organization. Unsafe abortion: global and regional estimates of the incidence of unsafe abortion and associated mortality in 2008. 6th ed., 2010; WHO: Geneva.
- S Singh. Hospital admissions resulting from unsafe abortion: estimates from 13 developing countries. Lancet. 368: 2006; 1887–1892.
- S Singh. Adding it up: the costs and benefits of investing in family planning and maternal and newborn health. 2009; Guttmacher Institute, UNFPA: New York.
- US Agency for International Development Health Policy Initiative. Inequalities in the use of family planning and reproductive health services: implications for policies and programs. 2007; USAID.
- Measure DHS data download. accessed at <www.measuredhs.com/accesssurveys/. >.
- Health Care Financing Team, Planning and Programming Department, Federal Ministry of Health. Ethiopia's Third National Health Accounts 2004/05. 2006; The Partners for Health Reform Plus Project, Abt Associates Inc: Bethesda, MD.
- Government of Malawi Ministry of Health. Malawi National Health Accounts 2002–2004 with Subaccounts for HIV/AIDS, Reproductive and Child Health. 2007; Malawi Ministry of Health: Lilongwe.
- Government of Kenya, Health Systems 2020 Project. Kenya National Health Accounts 2005/2006. 2009; Health Systems 20/20 Project, Abt Associates Inc: Bethesda, MD.
- Republic of Rwanda, Ministry of Health. Rwanda National Health Accounts 2002. 2005; Republic of Rwanda Ministry of Health: Kigali.
- Republic of Rwanda, Ministry of Health. Rwanda National Health Accounts 2006: with HIV/AIDS, Malaria and Reproductive Health Subaccounts. 2008; Republic of Rwanda Ministry of Health: Kigali.
- Tanzania Ministry of Health and Social Welfare. Tanzania National Health Accounts Year 2002/3 and 2005/6. 2008; Tanzania Ministry of Health and Social Welfare: Dar es Salaam.
- Government of Uganda, Ministry of Health. National Health Accounts Financial Year 2006/07. 2009; Government of Uganda Ministry of Health.
- World Health Organization. Guide to producing National Health Accounts. 2003; WHO: Geneva. At: <www.who.int/nha/docs/English_PG.pdf. >.
- World Health Organization. Guide to producing Reproductive Health Subaccounts. 2009; WHO. At: <www.who.int/nha/docs/guide_to_rh/en/index.html. >.
- P Berman. Rethinking India health care systems: private health care provision in India. World Development. 1998; 1463–1479.
- SM Ahmed, A Hossain, MR Chowdhury. Informal sector providers in Bangladesh: how equipped are they to provide rational health care?. Health Policy and Planning. 24: 2009; 467–478.
- DH Peters, GG Mirchandani, PM Hansen. Strategies for engaging the private sector in sexual and reproductive health: how effective are they?. Health Policy and Planning. 19(Suppl.1): 2004; i5–i21.
- S Ethelston, E Leahy. Reproductive health: how much? who pays? Working Papers Research Commentary, 1:6. 2006; Population Action International: Washington DC.
- World Health Organization. Global Health Observatory database. 2011; WHO: Geneva. At: <http://apps.who.int/ghodata/. >.
- S Sulzbach, S De, W Wang. From emergency relief to sustained response: examining the role of the private sector in financing HIV/AIDS services. 2009; Private Sector Partnerships-One Project, Abt Associates Inc: Bethesda, MD.
- World Bank. World development Indicators. World Development Reports 2010: Development and Climate Change. 2010; World Bank: Washington DC.