Abstract
Background
Cell-free DNA (CFDNA) is extracellular nucleic acids found in cell-free plasma/serum of humans. This study aims to quantitatively measure CFDNA concentration and integrity in patients with malignant and non-malignant diseases and in healthy controls to investigate their value as a screening test for cancer, and then to correlate them with the clinicopathological parameters of cancer patients.
Aim
This study included 145 subjects divided into three groups; group I: 83 patients with different types of cancer, group II: 30 patients with benign diseases and group III: 30 normal healthy volunteers as control. One plasma sample was collected from each subject. CFDNA was extracted from plasma and its concentration was measured using Quant-iT™ PicoGreen dsDNA Assay Kit, then CFDNA integrity was detected by conventional PCR for 100, 200, 400 and 800 bp.
Results
Results revealed that there was a highly significant difference in the mean level of CFDNA between the cancer group and each of the benign and control groups. AUC of ROC curve for cancer group versus normal and benign groups were 0.968 and 0.928, which indicated the efficiency of CFDNA as a marker for cancer. As for CFDNA integrity, normal and benign subjects showed only two bands at 100 and 200 bp, while all cancer patients demonstrated the 100, 200 and 400 bp bands and 78% of cancer patients had the 800 bp whose presence was statistically correlated with vascular invasion.
Conclusion
Subjects with CFDNA ⩽100 ng/μl would be cancer-free; subjects with CFDNA value ⩾600 ng/μl could be diagnosed as cancer patients, while those with CFDNA between 100 and 600 ng/μl will need DNA integrity to identify non-cancer from cancer patients. Thus plasma CFDNA in combination with DNA integrity could be used as a screening test for cancer detection.
Keywords:
1 Introduction
Cancer is a major public health problem worldwide. In the United States, it is the second most common cause of death and it accounted for 1 of every 4 deaths in 2008.Citation1 In 2007, 11 million new cancer cases and 7.4 million cancer deaths were reported worldwide; leaving nearly 25 million persons living with cancer. More than 70% of all cancer deaths occurred in low- and middle-income countries. Deaths from cancer worldwide are projected to continue rising, with an estimated 12 million deaths in 2030.Citation2,Citation3
In Egypt, in the years 1999–2001 the age standardized incidence rates of breast cancer was 49.6/100000 females.Citation4 In the Egyptian mortality statistics in 2001, breast cancer was the fourth most common cause of death, accounting for 9.3% of all cancer deaths and 21.0% of women cancer deaths.Citation5
A sensitive assay that can accurately diagnose the onset of cancer using non-invasively-collected clinical specimens is ideal for early detection. The earlier and more accurate the diagnostic biomarker can predict disease onset, the more valuable it becomes.Citation6 Since cancer symptoms usually appear when tumors are sufficiently large, so, for the detection of cancer to be early, it has to uncover tumors in asymptomatic individuals. Early detection reduces the suffering and cost to society associated with the disease. The better clinical outcomes associated with early detection highlight the need for and the potential benefit of early detection of cancer.Citation7,Citation8
Cell-free DNA (CFDNA) is made up of extracellular nucleic acids found in cell-free plasma/serum of humans. There are several terms in use like circulating nucleic acids, extracellular nucleic acids or cell-free nucleic acids.Citation9 Circulating extracellular DNA can be found in healthy persons, persons with non-malignant diseases, as well as persons with various malignancies. In addition, trauma and therapeutic procedures may also lead to the release of free DNA into the circulation. It is likely that a significant proportion is bound to protein molecules, possibly as nucleosomes.Citation10,Citation11 Theoretically, circulating DNA is mostly released from degrading cells after cleavage by endonucleases that cut the chromatin into the basic nucleosomes, which conserves them from proteolytic digestion in blood.Citation12
In a healthy person, it is believed that CFDNA enters circulation via apoptosis of lymphocytes and other nucleated cells.Citation13 Apoptosis is an active and energy-requiring process of cell death that plays a critical role in physiological functions, and that has a distinctive DNA “ladder” pattern that showed specific banding at 200 bp. The banding pattern was apparently due to endonuclease-mediated double-strand cleavage between nucleosomes.Citation14–Citation16 While in cancer patients, CFDNA most likely results from tumor necrosis, but other suggested mechanisms include lysis of circulating cancer cells or of micro-metastases, or due to active release.Citation17 Necrosis is a passive process that usually affects large cell clusters and results from insufficient vascularization and persistent ischemia. Tumor necrosis generates a spectrum of DNA fragments with different strand lengths, mostly large DNA fragments, because of random and incomplete digestion of genomic DNA by a variety of DNAases.Citation18
The current work aims to quantitatively evaluate the levels of plasma DNA and to determine its integrity in patients with malignant and non-malignant diseases and in healthy controls to investigate their potential role as a screening, non-invasive tool for cancer detection, and determine their correlation to clinicopathological characteristics of specific tumors. CFDNA concentration and integrity were also evaluated for each cancer type included in the study to verify that it stands for each of them separately.
2 Subjects and methods
2.1 Subjects
This prospective cohort study included 145 subjects divided into three groups:
Group I: included 85 patients newly diagnosed with cancer of different types (24 Breast, 14 Lung, 14 Colon, 13 stomach and 10 HCC cancers and 10 Lymphoma).
Group II: included 30 patients with various benign diseases (excluding autoimmune diseases) of matched age and sex to group I (12 benign breast lump, 3 colitis, 2 benign colonic polyps, 5 duodenal ulcers, 3 cirrhosis and 5 inguinal hernia).
Group III: included 30 normal healthy volunteers of matched age and sex to group I, as controls.
Patients were randomly recruited from those admitted to Experimental and Clinical Surgery Department and Cancer Research and Treatment Department, Medical Research Institute, Alexandria University. Samples were collected during the period from January 2007 to December 2008. All patients provided an informed written consent and the study was approved by the Local Research Ethics Committee of the Medical Research Institute, Alexandria University.
Patients were subjected to standard clinical procedure according to the type of disease; these include thorough clinical examination, preoperative evaluation by FNAC, endoscopy or excision biopsy, full medical history taking and full routine laboratory and radiological investigations.
Breast, colonic and gastric carcinoma patients underwent surgery. Modified Radical Mastectomy was done to all 24 breast cancer patients. Right hemicolectomy was done to four patients, left hemicolectomy was done to three patients and anterior resection was done to seven patients with colonic carcinoma. Subtotal gastrectomy was done to eight patients and total gastrectomy to five patients with gastric carcinoma. Lymph nodes excisional biopsies was done for lymphoma patients. All patients received their standard adjuvant chemotherapy according to the type of cancer they had.
One random blood sample was collected in EDTA-containing tubes, from patients before surgery or treatment and from controls. Blood was centrifuged at 6000 rpm for 10 min at 4 °C. Plasma samples were kept frozen at −80 °C until the time of assay to detect Total Cell Free DNA, DNA integrity and DNA integrity index.Citation19.
2.2 DNA extraction
DNA extraction from serum was performed using NucleoSpin® Plasma XS kit (Macherey–Nagel GmbH & Co. KG, Germany) according to the manufacturer's instructions. Briefly, 20 μl proteinase K was added to 240 μl plasma, incubated at 37 °C for 5 min. To the mixture, 360 μl of Binding Buffer was added, mixed for 60 s. and then loaded into the column. The column was centrifuged at 6000 rpm for 30 s then at 12,000 rpm for 5 s. The column was washed twice. 30 μl of Elution Buffer was added to the column and left for 10 min. DNA was collected by centrifugation at 12,000 rpm for 30 s. The elution fraction was incubated with open lid for 8 min at 90 °C.
2.3 DNA quantification
CFDNA concentrations of extracted samples were measured using Quant-iT™ PicoGreen dsDNA Assay Kit (Invitrogen Detection Technologies) according to the manufacture's instructions. Calf thymus DNA (100 mg/ml) was used as a standard to prepare serial dilutions (0–1000 ng/ml) to plot a standard curve. Fluorescence intensity was measured in a spectrofluorometer at emission wavelength of 520 nm and excitation wavelength of 480 nm.
2.4 PCR amplification
The integrity of CFDNA was examined by PCR. Three fragments were amplified of 200, 400 and 800 bp for p-53 gene, in addition to a 100 bp β-actin fragment as a house keeping gene. PCR was carried out using Go Taq®Green Master Mix (Promega Corporation-Madison, WI, USA). Each PCR reaction mixture consisted of 10 μl PCR master mix; 1 μl of each amplification primer 4 μM (4 pmol/μl) and 250 ng of extracted DNA and the volume was brought to 20 μl by adding deionized water. Thermal cycling started by a first denaturation step of 4 min at 95 °C, followed by 45 cycles of 95 °C for 30 s, 58 °C for 60 s and 72 °C for 60 s and a final extension at 72 °C for 10 min. Two separate amplifications were used one for β-actin with the primer sequences as follows: F-GCACCACACCTTCTACAATGA and R-GTCATCTTCTCGCGGTTGGC, the second amplification for p-53 gene was carried out using one forward primer whose sequence was F-CACCTCCACCACCTCCTCAA and three reverse primers R1-GTATCAGCATCTGGAAGAA at 200 bp, R2-CATCATCATCTGAATCATCT at 400 bp and R3- TCACCTGACTGTGCTCCTCC at 800 bp. PCR products were then separated by gel electrophoresis, stained by ethedium bromide and visualized by UV. Band intensities were measured by Scione Image software, which analyzes relative band intensities in Arbitrary Units (AUs) depending on the color and width of the band, and were used to calculate the Integrity Index.
2.5 Tumor marker evaluation
Standard serum tumor markers for each type of cancer were also evaluated. For breast cancer patients, CA 15.3 was measured using a commercial immunoradiometric assay (IRMA) kit (DIAsource ImmunoAssays S.A. – Belgium). For lung cancer patients, CYFRA 21–1 was measured using a commercial IRMA kit (SIS Bio International, Schering S.A., France). For colon and gastric cancer patients CA 19.9 was measured using a commercial IRMA kit (DIAsource ImmunoAssays S.A. – Belgium). For HCC patients AFP was measured using a commercial IRMA kit (DIAsource ImmunoAssays S.A. – Belgium). All tests were carried out according to the manufacturers’ instructions and using the materials supplied in the kit.
2.6 Statistical analysis
Statistical analysis was performed using the SPSS (Statistical Package for the Social Sciences) software package, version 19.0 (SPSS Inc., Chicago, IL, USA).
Comparisons of means were made by the Mann–Whitney U test for non-normal distributions. A p value of less than 0.05 was accepted as evidence of statistical significance. Qualitative variables were compared using the χ2 test and Fisher's exact test. Two-tailed p values of less than 0.05 were considered evidence of statistical significance. The relationships between the amount of DNA in the plasma and clinicopathological parameters were determined by Pearson correlation analysis.
A receiver operating characteristic curve (ROC) was developed to evaluate the diagnostic performance of plasma DNA concentrations. Each unique DNA value was used as a cutpoint to calculate sensitivity and specificity values defining the curve and the area under the curve (AUC). A p value less than 0.05 (two tailed) was considered significant. SEs were estimated separately to provide a 95% CI for the area.
3 Results
The mean age of all subjects included in this study was represented as mean ± standard deviation (M ± SD), the M ± SE of age in 83 patients with different types of cancer were 53.9 ± 14.6 years ranging from 32 to 75 years. While, the mean ± SD of age in 30 benign and 30 control groups were 48.7 ± 19.7, 49.8 ± 25.7 years, respectively. The range of age in benign and control groups was 37–60 and 38–63 years, respectively. There was no statistically significant difference in the mean age between the three groups. The cancer patients group was comprised of 54 (63.5%) females and 31 (36.5) males with a male:female ratio of 1:2. The same male:female ratio was maintained in the benign (20 females and 10 males) and control groups (19 females and 11 males).
3.1 Plasma CFDNA levels in studied groups and subgroups
represents the level of plasma CFDNA (ng/μl) in cancer, benign and control groups. The M ± SE for cancer group was 765.1 ± 84.8 ng/μl ranging from 105 to 4891 ng/μl and for benign and control groups were 141.0 ± 40.2 ng/μl ranging from 38 to 597 ng/μl and 75.8 ± 20.8 ng/μl ranging from 0 to 300 ng/μl, respectively.
Table 1 Levels of plasma DNA (ng/μl) in cancer, benign, and control groups and in cancer subgroups.
There was a statistically significant difference in the mean level of plasma DNA between cancer group and each of the benign and control groups (p = 0.000 and 0.000, respectively), but there was no statistically significant difference between benign and control groups (p = 0.237).
The cancer group was divided into six subgroups according to the tumor site; these subgroups were stomach, lung, breast, HCC, colon and lymphoma subgroups. The M ± SE for these subgroups were: 657.3 ± 83.6, 744.3 ± 157.1, 902.3 ± 226.2, 471.3 ± 106.4, 517.5 ± 120.6 and 1366.1 ± 333.4 ng/μl, respectively. There was a statistically significant difference in the mean level of plasma DNA between all cancer subgroups; breast, lung, colon and stomach cancer subgroups and each of the control groups (p = 0.000, 0.003, 0.008 and 0.003, respectively), and the benign group (p = 0.001, 0.014, 0.016 and 0.013, respectively).
3.2 ROC curve of CFDNA
a represents the ROC curve of plasma DNA concentrations for discrimination between cancer and control groups. There was a statistically asymptotic significance, p = 0.000, with an area under the curve (AUC) of 0.962, indicating the validity of CFDNA to discriminate cancer from control subjects.
Figure 1 ROC curve for discrimination between (a) cancer and control, and (b) cancer and benign groups.
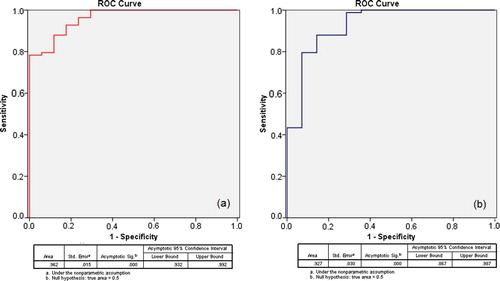
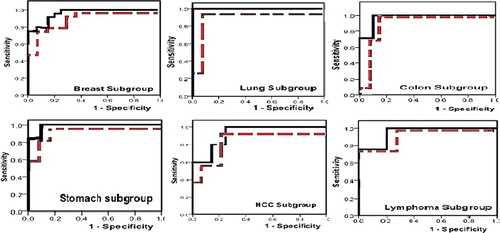
b, representing the ROC curve of plasma DNA concentrations for discrimination between cancer and benign groups, showed statistically asymptotic significance, p = 0.000, and AUC was 0.927, indicating the validity of CFDNA to discriminate cancer from subjects with benign diseases. While represents the ROC curves of all cancer subgroups versus benign and control groups. All cancer subgroups showed high asymptomatic significance from both benign and control groups. AUC of ROC curves for the cancer subgroups against normal and benign groups were as follow; breast “0.962, 0.923”, lung “1.0, 0.949”, colon “0.971, 0.918”, stomach “0.985, 0.962”, HCC “0.920, 0.871”, and lymphoma “0.950, 0.929”.
Figure 2 ROC curve for discrimination between various cancer subgroups and control (solid line) and benign (dotted line) groups.
represents ROC curve values for CFDNA versus control and benign groups, Cutoff values of plasma DNA with their sensitivity, specificity, Positive Predictive Value (PPV), and Negative Predictive Value (NPV). We selected two cutoffs, the first at 100 ng/μl; with 100% sensitivity and 75% specificity; was obtained from ROC curve of cancer group versus control group that has 100% NPV, to ensure that all subjects with lower CFDNA are true negative for cancer. The other cutoff at 600 ng/μl; with 100% specificity and 53.4% sensitivity; was obtained from ROC curve of cancer group versus benign group, that has 100% PPV, to ensure that all subjects with higher CFDNA are true positive for cancer.
Table 2 ROC curve values for CFDNA versus control and benign groups, showing area under each curve different, significance, cutoff values of plasma dna with their sensitivity, specificity, positive predictive value, and negative predictive value.
3.3 Assessment of CFDNA integrity by PCR
CFDNA integrity was assessed by PCR amplification of four fragments of 100, 200, 400 and 800 bp. The first two bands would measure CFDNA resulting from apoptosis while the latter two, would measure CFDNA resulting from tumor necrosis.
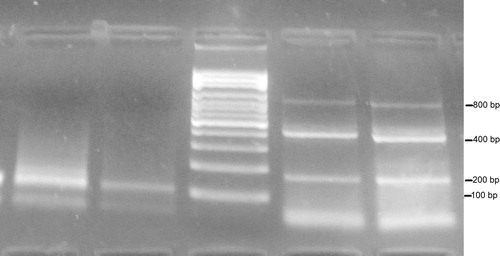
represents the gel electrophoresis of PCR products, showing a negative control sample (lane 2), 100 bp β-actin fragment (lane 1), one sample of a control subject showing one 200 bp fragment (lane 3) and two cancer samples showing 200, 400 and 800 bp fragments (lanes 4 and 5). While represents two cancer cases, lanes 1 and 2 show the 100 bp fragment and lanes 4 and 5 show the 200, 400 and 800 bp fragments.
Figure 3 Electrophoresis for PCR products of two control subjects (lanes 1–3), two cancer patients (lanes 4 and 5) and negative control (lane 2).
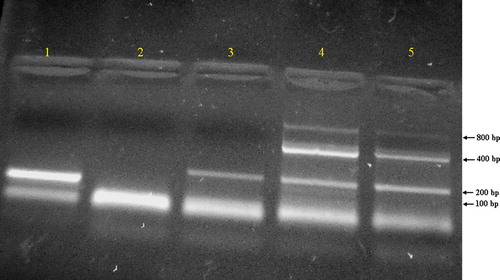
Figure 4 Electrophoresis for PCR products of two cancer patients.
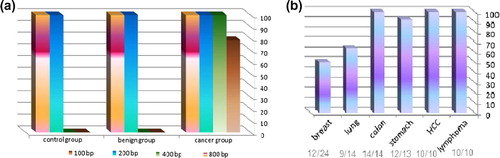
Both the 100 and 200 bp fragments were present in all subjects of the study, cancer, benign and controls. While the 400 bp band was present in all cancer cases but not in any of the benign or control subjects. The 800 bp band was present in most, but not all, cancer cases, as represented in . While the 800 bp fragment was present in only half of breast cancer cases and 64.3% of lung cancers, it was found to be present in 100% of HCCs, colon cancers and lymphomas; .
Figure 5 (a) Percent of cases with 100, 200, 400 and 800 bp in cancer, benign and control groups; (b) percent of cases with 800 bp in all cancer subgroups.
3.4 CFDNA integrity and integrity index
The DNA integrity index is defined as the ratio of longer fragments to shorter fragments. The intensity of the 400 bp fragment was used to calculate the integrity index as it was present in all cancer cases, unlike the 800 bp fragment that was absent from 21.2% of the cases. Band intensities of 100, 200 and 400 bp fragments were assessed in Arbitrary Units (AUs). represents the M ± SE band intensity of CFDNA fragments in AU and the M ± SE of CFDNA integrity index (400/100) in cancer subgroups, benign and control groups.
Table 3 M ± SE of CFDNA band intensity in AU at 100, 200 and 400 bp and CFDNA integrity index (400/100) in different subgroups of cancer, benign and control groups.
Cancer group in whole and all cancer subgroups had statistically significantly higher 100 and 200 bp band intensities than those of the benign and control groups, while no statistically significantly difference was found between 100 and 200 bp band intensities of the benign and control groups.
The M ± SE of CFDNA integrity index for cancer group was 1.3 ± 0.13, while no bands appeared at 400 bp for both benign and control groups, so DNA integrity index was not calculated for these two groups. The M ± SE of CFDNA integrity index for breast, lung, colon, stomach, HCC, and lymphoma subgroups were 0.66 ± 0.096, 1.42 ± 0.21, 1.97 ± 0.35, 1.44 ± 0.39, 2.14 ± 0.55 and 0.93 ± 0.065; respectively.
3.5 Correlation with the clinicopathological parameters
Clinicopathological parameters of breast, colon and gastric carcinoma groups combined were correlated with CFDNA concentration and integrity and with the 800 bp band intensity. There was no correlation between any of CFDNA concentration, integrity and integrity index with clinicopathological parameters; including pathological stage, histological grade, tumor size, lymph node metastases and vascular invasion; except intensity at 800 pb band which showed a strong positive correlation with vascular invasion, r = 0.940, p = 0.005, .
Table 4 Correlation between plasma DNA levels and clinicopathological parameters.
3.6 Tumor markers and CFDNA
Conventional tumor markers related to each cancer type were evaluated and compared in cancer to both benign and control subjects as one group, results are presented in . ROC curves of each cancer type revealed that they were not all suitable for the diagnosis of each respective type of cancer, and that CFDNA is by far better than any of them. None of these markers showed any significant relation with any of the clinicopathological parameters of patients of its respective cancer type. Also, none of them showed statistically significant relation with CFDNA, except Cyfra 21.1 in lung cancer patients, which was significantly correlated with CFDNA (p = 0.047, 95% CI: 1.02, 4.06). Absence of other significant correlations is most probably because of the small sample size of each individual type of cancer.
Table 5 Conventional tumor markers routinely used in cancer diagnosis in cancer patients and control group, cutoff, sensitivity, specificity and AUC.
4 Discussion
Cancer is one of the leading causes of death and often requires tumor biopsies obtained by invasive methods, and the current screening methods fail to detect many cancers at preliminary stages, leading to cancers being presented at later stages when clinical symptoms start showing.Citation20,Citation21 Therefore, there is a need for a screening tool to detect cancer in early stages. A screening test should be safe, cheap, highly specific and sensitive, with a high predictive value that can easily and quickly be used in a large population to detect the disease with a proven benefit.Citation20,Citation21
The most promising as cancer screening marker is circulating cell free DNA (CFDNA).Citation22 Previous studies suggested that elevated plasma DNA levels may predict neoplastic disease through two aspects. Firstly, the amount of CFDNA in plasma or serum of cancer patients is more than that in healthy individuals. Secondly, alterations that can be detected in primary tumors can also be detected in CFDNA of a cancer patient.Citation23,Citation24 Different hypotheses explained the origin of CFDNA. It is supposed to be driven from necrotic or apoptotic cells,Citation17,Citation25,Citation26 but some authors reported the possibility of an active release from cells.Citation17,Citation27 The presence of DNA circulating freely in the blood stream of healthy subjects can be related to apoptosis. In patients with neoplastic diseases, cancer cells may detach from the tumor mass and undergo necrosis. Or alternatively they may actively release nucleic acids in the blood stream.Citation27 But the actual origin of this CFDNA remains enigmatic. Finally, it may be the result, in variable proportions, of the sum of many different mechanisms.Citation17,Citation28
The goal of this study is to quantify the level of plasma DNA and to determine DNA integrity in patients with cancer and benign diseases and in healthy controls to investigate their value as a screening test for cancer.
In the current study, the mean level of CFDNA in cancer group was about 10-fold that of control group and about 5-fold that of benign group. This may be due to the release of a substantial amount of genomic DNA into the systemic circulation from tumor cells either by necrosis or active release.Citation17,Citation24 This is supported by the fact that genetic alterations of tumors were detected in the CFDNA.Citation29 Another suggested hypothesis is possible suppression of DNase activity in the sera of cancer patients as an E. coli DNase has almost no activity in plasma from cancer patients, while in the plasma of healthy controls the same DNase seems to work as good not as well as in a culture medium.Citation30 However, there was no statistically significant difference in the mean level of CFDNA between benign and control subjects. This perhaps could be attributed to the exclusion of patients with diseases that are suspected to increase CFDNA concentrations as autoimmune diseases.Citation31
In this study, cancer patients were divided into six subgroups according to the tumor site; these are; stomach, lung, breast, HCC and colon cancers and lymphoma. We found that the mean level of CFDNA in all subgroups were statistically significantly different from the control group. Moreover, the mean levels of CFDNA in all cancer subgroups were higher than the mean of the benign group. Therefore, total CFDNA concentration could be used as screening markers in stomach, lung, colon and breast cancer patients.
Previous studies were consistent with our finding of increased CFDNA level in various cancer patients than those of control and benign subjects, and most of them confirmed the high accuracy of CFDNA levels in discriminating cancer patients from normal subjects whatever the method used to handle the blood samples, purify and quantify plasma DNA, but they differed in the final concentrations.Citation32–Citation36 But the study design including selection of patient and control groups and the way clinical blood samples were handled before reaching the laboratory had a significant impact on CFDNA yields, as well as, the methods used to extract and quantify CFDNA. All these factors make for considerable variations between studies and difficulty to compare the values reported by different research groups.
To test the accuracy, sensitivity and specificity of using CFDNA as a screening tool, we used ROC curve of cancer patients against both benign and control groups and found that the AUC of ROC curves were 0.962 and 0.927 and the asymptotic significance was 0.000 and 0.000 for both curves respectively. This indicated that CFDNA represented a highly sensitive and specific marker to discriminate cancer patients from control and benign individuals. When compared to conventional tumor markers used in various types of cancer diagnosis (CA 15.3 for breast cancer, AFP for HCC, CA 19.9 for colon and gastric carcinoma and Cyfra 21.1 for lung cancer), CFDNA was by far, much better than any of them whether in all cancer population or in their respective cancer types. In addition, using a single test for all cancer types is much easier and more applicable than as many tests as cancer types themselves.
The cutoff point from the ROC curve of cancer versus control groups was 100 ng/μl, with 75% specificity and 100% sensitivity, a cutoff at which no false positives occurred and patients with CFDNA concentration below this value are not cancer patients. Another cutoff value was selected from ROC curve of cancer against benign groups of 600 ng/μl, which gave a corresponding 100% specificity and 53.4% sensitivity, at this cutoff point no false negative results were obtained. Thus, patient with CFDNA ⩾600 ng/μl could be directly diagnosed as a cancer patient. However, patients that had CFDNA concentrations, between 100 and 600 ng/μl, could not be confirmed as cancer patients, because of the overlap with benign subjects. To resolve this discrepancy, CFDNA integrity and CFDNA integrity index may be the answer.
DNA size distribution may be used to determine the origin of DNA whether from apoptotic or necrotic cells. Tumor necrosis, a frequent event in neoplasms, generates a spectrum of DNA fragments with different strand lengths because of random and incomplete digestion of genomic DNA by a variety of deoxyribonucleases. In contrast, cell death in normal tissues is mainly through apoptosis that releases DNA fragments uniformly truncated (between 180 and 210 bp) produced by a programed enzymatic cleavage process.Citation16,Citation17
CFDNA integrity is defined as the presence of larger DNA fragments in blood with different lengths or sizes >200 bp.Citation37 Cancer and benign patients and control subjects showed bands at 100 and 200 bp only, corresponding to the presence of shorter DNA fragments, while 100% of cancer patients demonstrated bands at 400 bp and approximately 78% of them represented bands at 800 bp as well. Thus, longer DNA fragments were present in all cancer patient samples, while they were absent from benign and control subjects, i.e., the presence of high-molecular-weight fragments was an indicator of cancer and the absence of these longer fragments indicated the absence of malignant disease. These results were consistent with many previous studies that revealed an increase of predominantly large DNA fragments in patients with breast,Citation32 colon,Citation33 lung,Citation22 prostate,Citation38 head and neckCitation39 and renal cell carcinomasCitation35 among many others.
DNA integrity index is defined as the ratio of longer DNA fragments (>200 bp) to shorter fragments (⩽200 bp).Citation37 By dividing the band intensities of larger fragments to shorter ones (400 bp/100 bp), we obtained CFDNA integrity index. This CFDNA integrity index was considered a better representative of the relative intensity of non-apoptotic cell death. Where DNA clearance rate of the patients could directly contribute to the absolute DNA level, but it would not significantly influence the values of CFDNA integrity index because both the amounts of longer and shorter DNA fragments would be similarly affected.Citation42
Band intensity at 100 bp of all subgroups was relatively corresponding to the variation of CFDNA concentrations, while band intensity at 200 bp was almost the same in all subgroups. Therefore, the 100 bp band was relatively a better reflection of the CFDNA concentration, and hence was used for calculating the integrity index. We have chosen the larger fragments as 400 bp because it was present in 100% of cancer patients and selected the shorter fragments as 100 bp as this band relatively reflects the concentration of CFDNA.
Our results did not reveal any correlations between clinicopathological parameters (e.g. tumor size, stage, grade, metastasis, etc.) and CFDNA concentration or integrity index. Except for, the 800 pb band intensity which showed a strong positive correlation with vascular invasion. That may be explained by the fact that DNA released from malignant tumors into the bloodstream was enhanced by vascular invasion. Since direct lymphatic or blood flow through the tumors enabled dissemination of viable tumor cells and enhanced diffusion of DNA released from necrotic or living tumor cells into the bloodstream.Citation40
Many other studies also reported that there was no correlation of CFDNA integrity with any clinicopathological parameters in various forms of cancer, in consistence with our results.Citation13,Citation25,Citation41–Citation43 On the other hand, Umetani and his colleaguesCitation40 found that DNA integrity was positively correlated to the size of invasive cancers and significantly higher in the presence of lymphovascular invasion and lymph node metastasis.Citation40
Notably, however, in HCC and colon subgroups, where almost 40% of patients had low CFDNA concentrations resulting in lower mean CFDNA levels, yet, they had high CFDNA integrity (800 bp band was present in all cases of these two subgroups) and hence had higher integrity index compared to other cancer subgroups. In other words, in colon and liver cancers, alterations in DNA quality (fragmentation) rather than quantity (concentrations) may better characterize tumor-released DNA. Also, breast cancer that had the highest CFDNA concentration of all solid tumors, it turned out to have the lowest integrity index. These observations suggest that there is no direct association between total CFDNA concentration and its integrity.
Screening for cancer in a large population, currently, needs the combination of many techniques, including clinical, radiographic, pathological and laboratory workup, which is both money and time consuming. However, in the current study we used one blood sample to identify cancer patients via plasma DNA which was proven to be simple, sensitive, specific, accurate, non-invasive, inexpensive and reproducible. So, CFDNA test has all the properties of the ideal screening tumor marker that can be used to identify cancer among subjects who may be susceptible to have cancer.
To identify asymptomatic cancer patients in the large population it could be done in two steps. The first step includes extraction and quantification of CFDNA. CFDNA being less than 100 ng/μl might be indicative of no malignancy present and a subject may be diagnosed as a cancer patient if CFDNA ⩾600 ng/μl. But if CFDNA is between 100 and 600 ng/μl, a further confirmation is needed. The second step is the detection of the integrity of DNA fragments. The appearance of larger fragments (400 bp) indicates the presence of cancer.
However, this test needs to be further validated on a larger scale study before it can be applied to a large population, also to further define the inclusion and exclusion criteria that enable the use of CFDNA as a screening test for malignancy.
Notes
Peer review under responsibility of Alexandria University Faculty of Medicine.
Available online 17 July 2012
References
- American Cancer Society. Cancer Facts & Figures 2008. Atlanta: American Cancer Society; 2008.
- K.FarinM.D.GraçaF.A.WilliamPatterns of cancer incidence, mortality, and prevalence across five continents: defining priorities to reduce cancer disparities in different geographic regions of the worldJ Clin Oncol24200621372150
- P.BoyleB.LevinWorld Cancer Report 20082008IARC Non serial PublicationIARC
- Freedman LS, Edwards BK, Ries LAG, Young JL, editors. Cancer Incidence in Four Member Countries (Cyprus, Egypt, Israel, and Jordan) of the Middle East Cancer Consortium (MECC) Compared with US SEER. National Cancer Institute; 2006.
- I.ElattarBreast cancer, magnitude of the problem: Egyptian society of surgical oncology conference2005EgyptTaba, Sinai
- V.V.LevensonBiomarkers for early detection of breast cancer: what, when, and where?Biochim Biophys Acta17702007847856
- R.EtzioniN.UrbanS.RamseyM.McIntoshS.SchwartzB.ReidThe case for early detectionNat Rev Cancer32003243252
- R.HarrisL.S.KinsingerPrinciples of screening for cancerA.E.ChangD.F.HayesH.I.PassR.M.StoneP.A.GanzT.J.KinsellaJ.H.SchillerV.J.StrecherOncology: an evidence-based approach2006SpringerNew York161176
- M.FleischhackerB.SchmidtCirculating nucleic acids (CNAs) and cancer-A surveyBiochim Biophys Acta17752007181232
- P.P.LaktionovS.N.TamkovichE.Y.RykovaO.E.BryzgunovaA.V.StarikovN.P.KuznetsovaExtracellular circulating nucleic acids in human plasma in health and diseaseNucleos Nucleot Nucl Acids232004879883
- S.HoldenriederP.StieberClinical use of circulating nucleosomesCrit Rev Clin Lab Sci462009124
- A.V.LichtensteinH.S.MelkonyanL.D.TomeiS.R.UmanskyCirculating nucleic acids and apoptosisAnn NY Acad Sci9452001239249
- V.SwarupM.R.RajeswariCirculating (cell-free) nucleic acids – a promising, non-invasive tool for early detection of several human diseasesFEBS Lett5812007795799
- N.KhanV.M.AdhamiH.MukhtarApoptosis by dietary agents for prevention and treatment of cancerBiochem Pharmacol876200813331339
- N.N.DanialS.J.KorsmeyerCell death: critical control pointsCell1162004205219
- S.NagataH.NagaseK.KawaneN.MukaeH.FukuyamaDegradation of chromosomal DNA during apoptosisCell Death Differ102003108116
- M.StrounP.MauriceV.VasioukhinJ.LyauteyC.LederryF.LefortThe origin and mechanism of circulating DNAAnn NY Acad Sci9062000161168
- D.V.KryskoT.V.BergheK.D.HerdeP.VandenabeeleApoptosis and necrosis: detection, discrimination and phagocytosisMethods442008205221
- G.SozziD.ConteE.M.LeonR.CirincioneL.RozC.RatcliffeQuantification of free circulating DNA as a diagnostic marker in lung cancerJ Clin Oncol21200339023908
- R.EtzioniN.UrbanS.RamseyM.McIntoshS.SchwartzB.ReidThe case for early detectionNat Rev Cancer32003243252
- R.HarrisL.S.KinsingerPrinciples of screening for cancerA.E.ChangD.F.HayesH.I.PassR.M.StoneP.A.GanzT.J.KinsellaJ.H.SchillerV.J.StrecherOncology: an evidence-based approach2006SpringerNew York (pub.)161176
- R.ZhangF.ShaoX.WuK.YingValue of quantitative analysis of circulating cell free DNA as a screening tool for lung cancer: a meta-analysisLung Cancer692010225231
- V.SwarupM.R.RajeswariCirculating (cell-free) nucleic acids – a promising, non-invasive tool for early detection of several human diseasesFEBS Lett5812007795799
- M.Van der VaartP.J.PretoriusIs the role of circulating DNA as a biomarker of cancer being prematurely overrated?Clin Biochem4320102636
- E.GormallyE.CabouxP.VineisP.HainautCirculating free DNA in plasma or serum as biomarker of carcinogenesis: practical aspects and biological significanceMutat Res6352007105117
- P.PinzaniF.SalviantiM.PazzagliC.OrlandoCirculating nucleic acids in cancer and pregnancyMethods502010302307
- M.StrounJ.LyauteyC.LederreyA.Olson-SandP.AnkerAbout the possible origin and mechanism of circulating DNA: apoptosis and active DNA releaseClin Chim Acta3132001139142
- D.C.Garcia-OlmoR.Ruiz-PiquerasD.Garcia-OlmoCirculating nucleic acids in plasma and serum (CNAPS) and its relation to stem cells and cancer metastasis: state of the issueHistol Histopathol192004575583
- D.SidranskyD.N.A.CirculatingWhat we know and what we need to learnAnn NY Acad Sci906200014
- S.A.LeonB.ShapiroP.ServiR.G.ParsonsA comparison of DNA and DNA-binding protein levels in malignant diseaseEur J Cancer171981533538
- E.BartoloniV.LudoviniA.AlunnoL.PistolaO.BistoniL.CrinòR.GerliIncreased levels of circulating DNA in patients with systemic autoimmune diseases: a possible marker of disease activity in Sjögren's syndromeLupus202011928935
- Z.H.HuangL.H.LiD.HuaQuantitative analysis of plasma circulating DNA at diagnosis and during follow-up of breast cancer patientsCancer Lett24320066470
- T.LecomteN.CezeE.DorvalP.Laurent-PuigCirculating free tumor DNA and colorectal cancerGastroenterol Clin Biol342010662681
- E.GormallyP.HainautE.CabouxL.AiroldiH.AutrupC.MalaveilleAmount of DNA in plasma and cancer risk: a prospective studyInt J Cancer1112004746749
- S.HauserT.ZahalkaJ.EllingerG.FechnerL.C.HeukampA.VON RueckerS.C.MüllerCell-free circulating DNA: Diagnostic value in patients with renal cell cancerAntican Res30201027852789
- I.LavonM.RefaelB.ZelikovitchE.ShalomT.SiegalSerum DNA can define tumor-specific genetic and epigenetic markers in gliomas of various gradesNeuro Oncol122010173180
- B.G.WangH.Y.HuangY.C.ChenR.E.BristowK.KassaueiC.C.ChengIncreased plasma DNA integrity in cancer patientsCancer Res63200339663968
- J.EllingerS.C.MüllerT.C.StadlerA.JungA.von RueckerP.J.BastianThe role of cell-free circulating DNA in the diagnosis and prognosis of prostate cancerUrol Oncol292011124129
- W.JiangM.ZahurakD.GoldenbergY.MilmanH.L.ParkW.H.WestraIncreased plasma DNA integrity index in head and neck cancer patientsInt J Cancer119200626732676
- N.UmetaniA.E.GiulianoS.H.HiramatsuF.AmersiT.NakagawaS.MartinoPrediction of breast tumor progression by integrity of free circulating DNA in serumJ Clin Oncol24200642704276
- J.EllingerP.J.BastianN.EllingerP.KahlF.G.PeraboR.BüttnerApoptotic DNA fragments in serum of patients with muscle invasive bladder cancer: a prognostic entityCancer Lett2642008274280
- G.SozziD.ConteL.MarianiS.L.VulloL.RozC.LombardoAnalysis of circulating tumor DNA in plasma at diagnosis and during follow-up of lung cancer patientsCancer Res61200146754678
- M.PaciS.MaramottiE.BellesiaD.FormisanoL.AlbertazziT.RicchettiCirculating plasma DNA as diagnostic biomarker in non-small cell lung cancerLung Cancer6420099297