Abstract
Aim
To study the relationship between serum DNA and breast cancer proliferative activity, then compare the diagnostic and prognostic values of serum DNA, TPS and CEA.
Subjects and methods
A total of 100 breast cancer patients before surgery and 50 apparently healthy controls were analyzed for serum DNA, TPS and CEA.
Results
Serum DNA levels were nonsignificantly correlated with serum TPS levels. Serum DNA, TPS and CEA levels were significantly higher in patients than controls. Using ROC curve analysis, serum TPS and DNA had the highest AUC compared to serum CEA. Neither serum TPS, DNA nor CEA correlated with breast cancer clinicopathological data. Only serum CEA was significantly correlated with patients’ disease-free survival.
Conclusion
Neither Breast cancer mass nor proliferative activity is the source of serum free DNA. Serum TPS is superior to DNA and CEA as a diagnostic marker for breast cancer. Only preoperative serum CEA has a prognostic role in predicting relapse of breast cancer patients, but not serum TPS or DNA.
1 Introduction
Several studies reported increased levels of free DNA in the serum of patients with various types of cancers including breast cancer.Citation1 However, the mechanism by which cell-free DNA is released into the circulation remains unknown. Some studies suggested that the tumor itself may be the source of free DNA.Citation2 Other studies indicated that cell death by apoptosis or necrosis may play a role in this phenomenon.Citation3 It was reported that tumor cell proliferative activity but not apoptosis may be the source of free DNA.Citation4
Tissue polypeptide specific antigen (TPS) is related closely to human cytokeratin 18, which is an essential part of the protein cytoskeleton of epithelial cells.Citation5 As opposed to CA 15-3, which serum concentration provides data about tumor mass, serum TPS levels indicate proliferative activity of malignant tissue even if the mass is small.Citation6 Elevated concentrations of TPS have been detected in association with a wide variety of malignancies, including breast cancer.Citation7
Serum tumor markers have proved to be valuable and convenient for the detection of various primary and recurrent carcinomas. However, due to their low sensitivity and specificity, markers such as carcinoembryonic antigen (CEA) have little practical use in the early detection of patients with breast cancer.Citation8
In terms of free DNA quantification, existing studies vary with regard to the techniques used, the standardization and analysis procedures.Citation9 For example, in one study, the mean free DNA concentration in lung cancer patients was 8-fold higher than in controlsCitation10 but it was 13-fold lower than the concentrations reported previously by the same authors.Citation11 This difference was because the PCR method used in the second report measured only amplifiable DNA,Citation11 whereas the method used in the original report (spectrophotometer) could detect all DNA fragments.Citation10 In the present study, we quantified the whole amount of free DNA present in serum by spectrophotometry at 260 nm depending on the idea that a DNA molecule contains a system of conjugated double bonds which absorb the UV light maximally at 260 nm.
The aim of the present study was to investigate whether or not a relationship exists between the level of serum DNA and TPS as a tumor proliferative index, then compare the diagnostic and prognostic values of serum DNA, TPS and CEA in breast cancer patients.
2 Subjects and methods
One hundred and fifty females were included in this study within the period from January 2007 to May 2008. They were divided into two groups: group I included 100 breast cancer patients with invasive ductal carcinoma of clinical stages II and III,Citation12 recently detected, with no surgical interference, not given chemotherapy; mean age: 48.36 ± 9.75 years. Patients were recruited from the Department of Cancer Management and Research of the Medical Research Institute, Alexandria University. Group II included 50 apparently healthy controls of matched age 47.45 ± 10.5, menstrual and socioeconomic status.
After having approval from the ethics committee, Medical Research Institute, Alexandria University, Egypt, signed informed consents were obtained from all subjects who agreed to participate in this study. A full history was recorded and each patient underwent: a thorough clinical examination, routine laboratory investigations, mammography of both breasts, radiological investigations including X-ray of chest, ultrasonography of abdomen and liver, computed tomography (CT) scan of chest and abdomen and bone scan when needed, and fine-needle aspiration cytology (FNAC) of breast mass to establish the pathological diagnosis of the patients.
The clinicopathologic data were obtained from patients’ pathology reports. The collected data included: tumor size, tumor pathological grade, axillary lymph node involvement, vascular invasion, estrogen receptor (ER) and progesterone receptor (PR) status and HER-2expression. For each patient, clinical stage was determined by the oncologist according to the tumor-node-metastasis (TNM) classification system.Citation13
All 100 breast cancer patients underwent modified radical mastectomy, then received adjuvant combination chemotherapy (5-fluorouracil, adriamycin and cyclophosphamide [FAC])Citation14 for six cycles. The patients were re-evaluated after three and six cycles of chemotherapy to estimate clinical response. They were followed up for 50 months until June 2012 for assessment of disease-free survival.
2.1 Laboratory investigations
Five milliliter venous blood samples were collected from the controls and patients before surgery. Immediately after withdrawing, blood samples were allowed to coagulate and then centrifuged for 20 min at 3500 rpm at 4 °C. The separated serum samples were aliquoted and stored frozen at −80 °C. After thawing, each serum sample was assayed once. Determination of serum concentrations of DNA, TPS and CEA was carried out at the radioisotopes laboratory of Radiation Sciences Department, Medical Research Institute, Alexandria University.
2.2 Purification of serum free DNA
The obtained serum was used to extract DNA using a ready- for use QIAamp DNA mini kit (Qiagen, Hilden, Germany). Briefly, serum was mixed with a protein kinase and a lysis buffer and incubated at 56 °C for 20 min in a microcentrifuge tube. Ethanol was added and the reaction mixture was applied to the QIAamp mini spin column. After washing, the column was eluted with the elution buffer.
2.3 Determination of serum free DNA concentration and purity
Serum free DNA concentration was measured at the wavelength of 260 nm by Nanodrop 2000/2000C spectrophotometer (thermo fisher Scientific Inc, Nanodrop Technologies, Wilmington, NC, USA). By using a standard curve, it is possible to calculate the absolute concentration of target DNA in a sample. In this study, we generated a standard curve using serial dilutions of known concentrations of DNA (500, 250, 100, 80, 40, 20, 10, 5, 0 ng/μl). Also, the purity was estimated from the ratio of absorbance at 260 nm and 280 nm (A260/A280). A ratio of ∼1.8 (1.7–1.9) is generally accepted for pure DNA.
2.4 Determination of serum CEA concentrations
The level of serum CEA was determined using a ready-for-use Immunoradiometric assay (IRMA) kit (Siemens, USA) according to the producer’s protocol. Briefly, serum was added to a plastic tube coated with the capture antibody. CEA assay buffer was added to the tubes which were shaken for 1 h at room temperature. The tubes were decanted and washed with the wash buffer. I125- CEA antibody was added to all tubes which were shaken for 1 h at room temperature. The tubes were decanted, washed with the wash buffer and counted for 1 min in a gamma counter (Perkin Elmer, Finland). Computer assisted data reduction was used to simplify the calculations. The five- parameter logistic function curve was used to calculate CEA level in each serum sample.
2.5 Determination of serum tissue polypeptide specific antigen (TPS) concentrations
Serum TPS level was determined using a ready-for-use ELISA kit (DRG diagnostics, Germany) according to the manufacturer’s protocol. Briefly, serum was added into each well, followed by HRP-conjugated Anti-TPS solution. Wells were shaken on a rack shaker (600 rpm) for 2 h at room temperature. Wells were decanted and washed with diluted wash solution. Tetramethyl-benzidine (TMB) substrate solution was added per well and incubated in the dark for 20 min. Stop solution was added per well and the wells were mixed well. Absorbance of every well was read at 450 nm. A standard curve was constructed from which the concentration of TPS in each serum sample was determined. The assay sensitivity was 6 U/L.
2.6 Statistical analysis
Statistical analysis was performed using the PASW 18 software package. The distribution of quantitative variables was tested for normality using Kolmogorov–Smirnov test, Shapiro–Wilk test. The data were abnormally distributed, so non-parametric tests were used. Non-parametric Spearman’s test was used to investigate correlations between different parameters. The Mann–Whitney U-test was used for studying differences between the patient and control groups. The Receiver Operating Characteristic (ROC) curve analysis was used to compare the diagnostic accuracies of the studied parameter. Univariate survival analysis of the studied parameters was assessed using the Kaplan–Meier method. Statistical differences between survival curves were evaluated using the log-rank test. p< 0.05 was considered as significant.
3 Results
3.1 Correlation between serum DNA levels and breast cancer proliferative activity
In the present study, serum TPS was considered as a tumor proliferative index. A non-significant correlation (r = 0.177, p = 0.116) was found between serum DNA and TPS.
3.2 Median (range) of serum DNA, CEA and TPS levels in the breast cancer patients and apparently healthy controls
In women with breast cancer, serum concentrations of DNA (83.10 (42–221) ng/μl), CEA (4.0 (1.0–24.0 ng/ml) and TPS (144 (60–243) U/L) were significantly higher than those in control women (DNA: 49.00 (33–69) ng/μL, CEA: 3.5(0–11) ng/ml and TPS: 34 (10–175) U/L), (P= 0.000, P= 0. 013 and P= 0.000 respectively).
Comparison between serum DNA, CEA and TPS as diagnostic markers in breast cancer patients using the Receiver Operating Characteristic (ROC) curve analysis was done.
In the present study, the assayed serum parameters were of diagnostic value in breast cancer patients. So, the ROC curves of serum DNA and TPS were constructed to compare their diagnostic value with that of CEA, in such a way that the higher area under the curve (AUC) corresponds to a better diagnostic test, . To obtain the optimal cut off value for each parameter in predicting breast cancer, we chose the point on the ROC curve which represented the largest sum of sensitivity and specificity. As shown in and , the AUC for serum TPS was 93.6% suggesting a strong discrimination power and nominates serum TPS as a diagnostic test with an excellent accuracy compared with serum DNA which has an AUC of 92.9% and serum CEA that has an AUC of 67.1% that is also a diagnostic marker with poor diagnostic accuracy. The probability that a female is affected by breast cancer when having positive serum TPS, DNA and CEA results is 85%, 98.5% and 53.6%, respectively. While the probability that a female is free from breast cancer when having negative serum TPS, DNA and CEA results is 77.5%, 72.2% and 54.6%, respectively
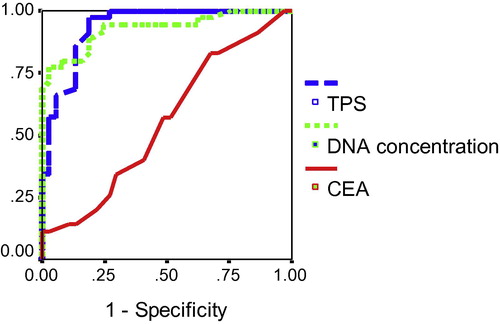
Table 1 Cut-off values and corresponding sensitivity, specificity, PPV and NPV for serum DNA, TPS and CEA for prediction of breast cancer.
3.3 The relationship between serum DNA, CEA and TPS levels and clinicopathological data in breast cancer patients before surgery
Neither serum TPS, DNA nor CEA levels showed a significant correlation with the clinicopathological data of breast cancer patients
3.4 Relationship between preoperative serum DNA, CEA and TPS levels and patients’ disease-free survival
Kaplan–Meier analysis and log-rank test revealed that serum DNA and TPS did not correlate with disease-free survival (p = 0.540, p = 0.602; respectively), while patients with elevated levels of serum CEA (⩾4.88 ng/ml) had a significant shorter disease-free survival than those who had lower levels of this biomarker (p = 0.037) as shown in and .
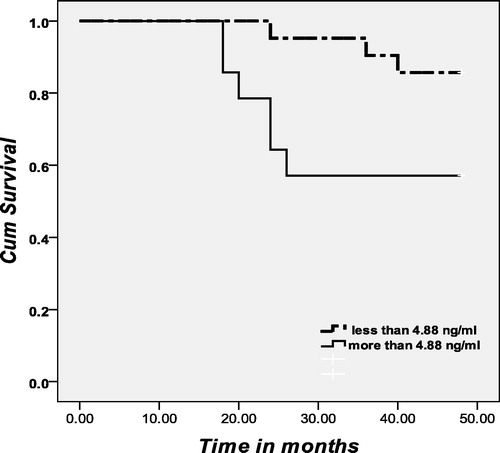
Table 2 Correlation between preoperative serum DNA, TPS and CEA levels and disease-free survival (months) among breast cancer patients.
4 Discussion
The origin of circulating DNA is not fully understood. Qualitative studies have shown that genetic alternations such as mutations and loss of heterozygosity (LOH) were detected in circulating DNA, as well as in the matching tumor cells, suggesting that part of the extra circulating DNA in cancer patients is attributed to DNA released from tumor cells.Citation15–Citation17
In the present study, the absence of correlation between serum DNA and TPS indicated that the proliferative activity of breast cancer cells is not the origin of serum free DNA. This result is confirming the results of Sozzi et alCitation10 who suggested that the mechanism of release of DNA into circulation is not related to tumor cell proliferation.
Also, in the present study, the absence of correlation between serum DNA and breast cancer clinicopathological data indicates that the tumor mass is not the source of free serum DNA. Our results are in agreement with those of Gal et al.Citation18 who suggested that the mechanism of DNA release from tumors is not related to any of the known commonly used major prognostic factors and therefore might highlight different pathways, such as apoptosis, necrosis, and hypoxia that would need to be investigated. Gal et al.Citation18 also stated that at least a proportion of the excess serum DNA in patients with tumors originates from a host response to the tumor (i.e. normal rather than tumor DNA).
The results of the present study provide an evidence of increased amounts of serum DNA, TPS and CEA in breast cancer patients than apparently healthy controls. This means that serum DNA, TPS and CEA levels can be used as a tool to distinguish breast cancer patients from apparently healthy controls. For TPS, our results are in agreement with the results of Kassim et al.Citation19 For DNA, our results confirmed those of Sozzi et al.,Citation11 Gal et al.Citation18 and Huang et al.Citation1 For CEA, our results supported those of Samy et al.Citation20
In the present study, to compare the accuracy of serum DNA, TPS and CEA in predicting breast cancer, the ROC curve was constructed which showed that serum TPS is superior to DNA and CEA for prediction of breast cancer. For TPS, at a cut-off level 71 U/L, the sensitivity was 94.3% and the specificity was 81.1%, with AUC 93.6%. These results are close to those of Kassim et al.Citation19 who reported that at a cut-off 88 U/L, the sensitivity was 95%, and the specificity was 75% with AUC of 91%. The greater cut-off value in Kassim et al. studyCitation19 may be due to that their control group was from patients with benign breast diseases instead of apparently healthy controls. For serum DNA, at a cut-off concentration 65.7 ng/μl, the sensitivity was 77.1% and the specificity was 97.3%, with AUC 92.9%. Our results supported those found by Gal et al.Citation18 who reported that at a cut-off concentration 221 ng/ml, the sensitivity was 70.8% and the specificity was 93.7%, with AUC 92%. For CEA, at a cut-off concentration 4.88 ng/ml, the sensitivity was 48.6% and the specificity was 85.9%, with AUC 67.1%. These results were in agreement with those of Vizcarra et al.Citation21 who reported that at cut-off level 5 ng/ml, the diagnostic sensitivity and specificity of CEA in breast cancer were 44.4% and 95.5%, respectively.
The present study revealed that neither serum TPS nor CEA correlated with breast cancer clinicopathological data. Our results are compatible with the results reported by Hu et al.Citation22 regarding TPS and Zheng et al.Citation23 regarding CEA.
The present study showed that neither serum DNA nor TPS correlated with disease-free survival. For serum DNA, our results supported those of Sozzi et al.Citation11 and Beau-faller et al.Citation17 in lung cancer, but contradicted the results reported by Silva et al.Citation24 in breast cancer. The present study showed that serum CEA correlated significantly with breast cancer patients’ disease-free survival which supported the results reported by Park et al.Citation25
In conclusion, neither breast cancer mass nor proliferative activity is the source of serum free DNA. Serum TPS is superior to DNA and CEA as diagnostic markers. Preoperative CEA level has a prognostic role in predicting relapse of breast cancer patients, but not serum TPS and DNA. Further studies are needed to determine the exact mechanism of free DNA release into the circulation.
Notes
Peer review under responsibility of Alexandria University Faculty of Medicine.
Available online 13 April 2013
References
- Z.H.HuangL.H.LiD.HuaQuantitative analysis of plasma circulating DNA at diagnosis and during follow-up of breast cancer patientsCancer Lett24320066470
- M.StrounP.AnkerP.MauriceJ.LyauteyC.LederreyM.BeljanskiNeoplastic characteristics of the DNA found in the plasma of cancer patientsOncology461989318322
- R.E.C.CabralJ.B.C.NetoM.G.C.CarvalhoCirculating DNA as a biomarker for early detection of cancer: a brief update with an emphasis on lung cancerOpen Lung Cancer J320103844
- P.J.PretoriusThe origin of circulating free DNAClin Chem53200722152224
- L.RydlanderE.ZieglerT.BergmanE.SchöberlG.SteinerA.C.BergmanMolecular characterization of a tissue-polypeptide-specific-antigen epitope and its relationship to human cytokeratin 18Eur J Biochem2411996309314
- B.BjorklundR.EinarssonTPS (tissue polypeptide specific antigen) in oncologic practice: a review with reference to 3000 cases of breast cancerTumordiagn Ther1719966773
- R.D’AlessandroM.RoselliP.FerroniS.MariottiA.SpilaS.AloeSerum tissue polypeptide specific antigen (TPS): a complementary tumor marker to CA15-3 in the management of breast cancerBreast Cancer Res Treat682001919
- M.J.DuffySerum tumor markers in breast cancer: are they of clinical value?Clin Chem522006345351
- A.K.PathakM.BhutaniS.KumarA.MohanR.GuleriaCirculating cell-free DNA in plasma/serum of lung cancer patients as a potential screening and prognostic toolClin Chem52200618331842
- G.SozziD.ConteM.LeonR.CiricioneL.RozC.RatcliffeQuantification of free circulating DNA as a diagnostic marker in lung cancerJ Clin Oncol21200339023908
- G.SozziD.ConteL.MarianiS.Lo VulloL.RozC.LombardoAnalysis of circulating tumor DNA in plasma at diagnosis and during follow-up of lung cancer patientsCancer Res61200146754678
- Rintoul RF. Operations on the breast. In: Farquhaerison’s text book of operative surgery. 7th ed. Churchill living stone (pub.); 1986, pp. 270–281.
- C.M.HaskellB.B.LowitzA.D.CasciatoBreast cancerA.D.CasciatoB.B.LowitzManual of clinical oncology2nd ed.1985Little and Brown Company (pub.)Boston, Toronto pp. 150–65
- M.D.AbeloffA.S.LichterJ.E.NiederhuberL.J.PierceD.C.AzizBreastM.D.AbeloffJ.O.ArmitageA.S.LicherJ.E.NiederhuberClinical Oncology1995Churchil livingstone Inc. (Pub.) Chapter 73, pp 1617–714.
- R.GonzalezJ.M.SilvaA.SanchezG.DominguezJ.M.GarciaX.Q.ChenMicrosatellite alterations and TP53 mutations in plasma DNA of small cell lung cancer patients: follow-up study and prognostic significanceAnn Oncol11200010971104
- J.A.ShawB.M.SmithT.WalshS.JohnsonL.PrimroseM.J.SladeMicrosatellite alterations plasma DNA of primary breast cancer patientsClin Cancer Res6200011191124
- M.Beau-FallerM.P.GaubA.SchneiderX.DucrocqG.MassardB.GasserPlasma DNA microsatellite panel as sensitive and tumor-specific marker in lung cancer patientsInt J Cancer1052003361370
- S.GalC.FidlerY.M.D.LoM.TaylorC.HanJ.MooreQuantitation of circulating DNA in the serum of breast cancer patients by real-time PCRBr J Cancer90200412111215
- S.K.KassimH.FawzyM.M.El RassadF.K.KhalilA.KhalifaTelomerase activity and tissue polypeptide specific antigen (TPS) in Egyptian breast cancer patientsClin Biochem342001499504
- N.SamyH.M.RagabN.A.El MaksoudM.ShaalanPrognostic significance of serum Her2/neu, BCL2, CA15-3 and CEA in breast cancer patients: a short follow-upCancer Biomarkers620106372
- E.VizcarraA.LluchR.CibriánF.JarqueV.AlberolaV.BellochValue of CA 15.3 in breast cancer and comparison with CEA and TPA: a study of specificity in disease-free follow-up patients and sensitivity in patients at diagnosis of the first metastasisBreast Cancer Res Treat371996209216
- X.C.HuW.DayB.JonesW.T.LooL.W.ChowComparison of TPS with CEA and CA 15.3 in follow-up of Chinese breast cancer patientsAnticancer Res22200218651868
- Y.ZhengY.ChenM.HuY.LinY.ChenCorrelation of preoperative serum tumor markers with clinicopathological features and prognosis in breast cancerCancer Clin Oncol12012124132
- J.M.SilvaJ.SilvaA.SanchezJ.M.GarciaG.DominguezM.ProvencioTumor DNA in plasma at diagnosis of breast cancer patients is a valuable predictor of disease- free survivalClin Cancer Res8200237613766
- B.W.ParkJ.W.OhJ.H.KimS.H.ParkK.KimJ.H.KimPreoperative CA 15–3 and CEA serum levels as predictor for breast cancer outcomesAnn Oncol192008675681