
Abstract
Background
Fetal malnutrition is a risk factor for increased neonatal morbidities and mortalities worldwide. BMI and CANScore had been used for determining fetal malnutrition in term newborns.
Objective
To assess the nutritional status of preterm newborns at birth using BMI, PI and CANscore and determine the better indicator for FM.
Methods
The study was carried out on consecutive, live-born babies between 28 completed weeks through 36 weeks gestation. Birth weights and lengths were recorded as per protocol. BMI was calculated and BMI <10th centile using Brock’s chart is considered as FM and a PI <2.2 was considered as malnutrition. Using Metcoff’s CANscore, score <25 is FM. Data was analyzed using the SPSS version 22.0.
Results
One hundred and forty preterm newborns were assessed and 108 (77%) were of LBW. BMI, CANscore and PI identified 40.0%, 34.3% and 30.0% of the preterm newborns as FM. Using BMI as standard for detecting FM, CANscore and PI identified 33.9% and 51.8% of the babies as FM. PI had a better sensitivity for detecting FM in preterm infants compared to CANScore and this was statistically significant, p < 0.00.
Conclusion
FM is common in preterm babies. BMI and PI are simple and easy tools to use in assessing FM in preterm babies. They are also better identifiers of FM in preterm newborns compared to CANScore.
1 Introduction
The nutritional status of a fetus has major influence on the overall health of the infant post-nataly.Citation1,Citation2 The fetus can be undernourished, well-nourished or over-nourished in utero. Fetal malnutrition commonly refers to undernutrition in utero in which the fetus fails to acquire adequate quantum of subcutaneous tissues and muscle mass as it experienced deprivation of adequate calories, proteins and other nutrients necessary for proper growth and development.Citation2 At birth the affected baby may be under weight for gestational age, there is loss or poor accumulation of subcutaneous fat and the child may look thin and wasted.Citation3 This clinical state can occur at any birth weightCitation2 and has been described also in preterm infants.Citation4 It describes infants who show evidence of soft tissue wasting at birth irrespective of the specific aetiology.Citation5,Citation6
Worldwide, WHO has implicated undernutrition as the underlying cause of half of the under- five mortality. Meanwhile 37% of the under- five mortality are contributed by neonatal mortality with prematurity and its complications making up to 28% of the mortalities. Prematurity is prevalent in developing countries and fetal malnutrition (FM) is also prevalent.Citation3,Citation7 Fetal malnutrition may lead to high risk delivery and perinatal problems.Citation8–Citation10 FM has been implicated in both short and long term adverse outcome in affected newborns. Adebami et al. documented higher incidences of neonatal morbidity and mortality in infants with FM compared with those without malnutrition.Citation3,Citation11 In Turkey Korkmaz documented similar finding in preterm infants with FM.Citation3 Small preterm neonates have difficulty maintaining normal blood glucose concentration and are at risk of recurrent hypoglycemia at birth.Citation12 The study by Greeves et al.Citation13 demonstrated that in utero sub-optimal nutrition may hamper the cognitive development and academic proficiency of children exposed to FM. Barker et al. in their epoch hypothesis “fetal origin of adult diseases” associated LBW with adult onset cardiovascular diseases. Babies who were thin at birth tend to be insulin resistant as children and adult and tend to develop insulin resistance syndrome later in life.Citation14
Nutritional assessment in the newborn period reflects the average growth pattern from conception to birth.Citation15 Fetal growth and development are determined by gestational age, genetic and environmental factors.Citation16 The fetus grows most rapidly between 12 and 36 weeks of gestation both in length and in weight acquisition.Citation17 Increased rate of fat deposition commences around 28 weeks of gestation.Citation17
Various instruments have been used to identify children with malnutrition. In older children and adults Body Mass Index (BMI) is used as the gold standardCitation18 in determining body proportions and adiposity or for screening for malnutrition. In neonates as in older children various criteria have been used to identify and classify FM. The most common criterion used being the birth weight. Researchers have argued that birth weight alone may not reflect the state of nutrition in utero.Citation19 Working on this premise Brock et al.Citation20 and Olsen et al.Citation21 separately validated the use of BMI for assessing the nutritional status of newborns at birth. De Cunto et alCitation22, Kamath et al.Citation23 and CarreraCitation16 in their different studies demonstrated that BMI has a direct correlation with percentage body fat mass in neonates. Ponderal Index (PI) is another commonly used proportionality index of adequacy of intrauterine growthCitation24,Citation25 often used in preterm infants. Other researchers have also used clinical assessment of nutritional status score (CANScore) which assesses nine clinical signs on the newborn as an indicator of FM in termCitation3–Citation7
The aim of the present study was to assess the nutritional status of preterm newborns at birth using BMI, PI and CANscore and to determine the better indicator for FM in preterm newborns. The findings from this study would provide guidance into choosing the better method of determining FM in preterm newborns.
2 Methodology
The study was a cross-sectional study of all singletons, live born babies of ⩾28 completed weeks through 36 weeks gestation delivered in the labor ward of the Hospital.
Babies with major congenital abnormalities or severe perinatal illness were excluded. Ethical clearance was obtained from the Research and Ethics Committee of the Hospital. Informed parental consent was obtained for each new-born recruited.
Sample size of 140 was calculated using the formula for descriptive study. Each infant was examined by the investigator within 48 h of birth. All the anthropometric measurements, except birth weight, were carried out by the investigator with trained assistance where necessary. Neonates were weighed nude at birth by the delivery room staff using the infant weighing scale (Weighmaster model®, USA), which records the weight to the nearest 10 g. Using the Lubchenco intrauterine growth chart,Citation26 birth weights for gestational age below the 10th percentile and above the 90th percentile on the chart were taken as small for gestational age and large for gestational age respectively. The infant’s length was measured using standard protocol.Citation27 BMI was calculated for each baby using the formula: [weight (kg)/ length (m)2] and the value was plotted on the BMI curve designed by Brock et al.Citation20 for newborn babies. PI was computed from the formula: PI = weight (g)/length3 (cm) X100. A PI <2.2 was considered as malnutrition.
CANScore was applied to each baby within 48 h of birth based on the nine clinical signs of malnutrition as described by Metcoff (Appendix A)Citation5 which consisted of inspection of hair and estimation of loss of subcutaneous tissues and muscles in the designated areas: cheeks, neck and chin, arms, back, buttocks, legs, chest and abdomen. The range of scores for each varied between 1 and 4. A maximum score of 4 was awarded to each parameter with no evidence of malnutrition, and the lowest score of 1 was awarded to parameter with the worst evidence of malnutrition. The total rating of the 9 signs was the CANScore for the subject. Fetal malnutrition was defined as CANScore less than 25.Citation5,Citation11
Statistical analysis was performed using the Statistical Package for Social Sciences (SPSS) for windows, version 22.0 (IBM Corp. released 2013, Armonk New York). The variables were presented by frequency tables and cross-tabulations. Student’s t-test was used to compare the mean anthropometry between males and females. Chi-squared analysis was used to assess association between categorical variables. Fisher’s exact test was used for variables < 5 and Pearson’s correlation was used to test for relationship between two quantitative variables. P < 0.05 was considered statistically significant at 95% confidence level.
3 Results
One hundred and forty preterm newborns participated in the study. There were 67 males and 73 females giving a male: female ratio of 1:1.08. Of these, 108 (77.1%) were of LBW, 7(5%) were SGA while 122 (87.1%) were AGA. The mean birth weight of the subjects was 2100 ± 600 g and the mean length was 43.2 ± 5.0 cm. There was no significant difference between mean birth weight and length centiles in male and female preterm babies.
BMI detected FM in 40% of the subjects while PI and CANScore detected 30.7% and 34.3% respectively as FM. This is shown in .
Fig. 1 Distribution of FM by BMI, PI and CANScore.
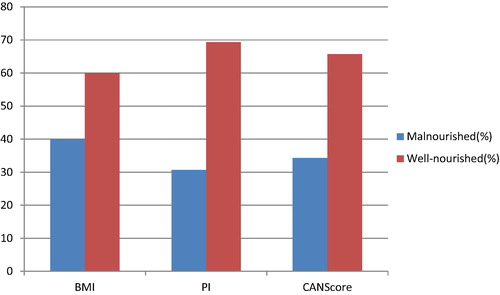
Further analysis showed that using BMI as a standard for detecting FM, PI detected 69.8% of those babies detected by BMI as FM as FM also while CANScore detected 40.2% of them. Comparison of validity measures of PI and CANScore with BMI in detection of FM showed that PI had the highest sensitivity and specificity for FM in preterm newborns as shown in .
Table 1 Comparison of the validity measures of PI and CANScore with BMI.
A Pearson’s correlation coefficient was computed to assess the relationship between BMI and the other two parameters for detecting FM (). Mean values for PI was 1.69 ± 0.46 and mean for CANscore was 1.66 ± 0.48. There was significant correlation between BMI and PI in detection of FM (p = 0.000) whereas BMI had no significant correlation with CANScore in preterm newborns.
Table 2 Correlation of BMI with PI and CANScore.
4 Discussion
The present study has shown that FM is common in preterm newborns. Though there are no universally agreed indicators for FM in preterm babies, the existing indicator widely used has been the birth weight.Citation19,Citation20 In term newborns, in addition to the birth weight, CANScore has been applied by many researchers and found to accurately assess the subcutaneous fat deposit in utero at term.Citation3–Citation7,Citation24,Citation25 Many studies have demonstrated FM as a major public health problem in developing countries.Citation3,Citation4,Citation23 The present study documented prevalence of FM to be 40% using BMI which is similar to the 48.9% documented by Almarzoki et alCitation28 in Iraq. It is however, higher than the 26.59% documented in India by Kamath et al.Citation23 Both assessed the nutritional status with BMI. The use of combination of two parameters – weight and length – in BMI to assess the body proportions and nutritional status of an infant confers superiority to it over single parameters like weight alone. As a proportionality index, BMI accommodates the expected increase in size and weight as the gestational age increases, making it the ideal choice in nutritional screening of the preterm newborn.
In the present study PI identified 30.7% of the study subjects as FM but when BMI was applied to these FM babies, 13 of them were found to be well nourished. However, when PI was applied to the malnourished babies detected by BMI, 69.8% of them were also identified as FM. In the present study PI has a high sensitivity and specificity for FM with significant correlation with BMI, making it a good screening tool for FM. PI is also a proportionality index hence may not be affected by gestational age and it relies on the fact that length is spared in acute malnutrition.Citation29 It is one of the most widely used proportionality indices in neonatology, as it is more sensitive than birth weight for the identification of neonatal risk of morbidity associated with intrauterine growth abnormalities and is not affected by sex or ethnicity.Citation30 As length is cubed in PI a slight mistake or miscalculation in the length will give a marked disparity in PI.
Most studies that had documented FM in term babies used CANScore to assess it. There has been paucity of studies on preterm newborns using CANScore. In this study we documented FM in 34.3% of the preterm newborns using CANScore. This is lower than the 40% documented with BMI in this study and also lower than the 54.8% documented in preterm babies in Turkey using CANScore.Citation4 This disparity may be due to the fact that CANScore assesses for subcutaneous fat deposition whereas it is a known fact that significant fat accretion starts in late gestationCitation17 hence CANScore may not be a good indicator of FM in preterm newborns especially in early preterm when fat deposition is minimal or non-existent. Most of the earlier studies that documented FM in preterm babies using CANscore have been in late preterm neonates. The present study assessed FM even in early preterm babies, gestational age at which adiposity is just starting. Hence CANscore which assesses evidence of subcutaneous fat accumulation and muscle wastingCitation5,Citation31 may not be the ideal tool. Also the cutoff point for FM using CANscore is static at 25. Again this did not put into consideration the different rate of fat accumulation at different gestational ages. SifianouCitation32 in his study of a cohort of late preterm and term babies disagreed with this cut-off and used a cut-off point of <27 for FM. Other studies had documented that in term babies when gestational age is in doubt CANscore may be a better assessment tool to use as it is not dependent on gestational age.Citation24 This may not be extrapolated in preterms.
In the present study, analysis of the relationship of CANScore with BMI, gave a very poor sensitivity and specificity for CANscore with a low positive predictive value. CANScore had no significant correlation with BMI in preterm babies (r = −0.006, n = 140, p = 0.94). All these support its poor suitability as a tool for assessing FM in preterm newborns.
As fat accumulation and mean anthropometry increase as gestational age increases, the parameters that take this into cognizance, like BMI and PI, will be a better choice in assessing nutritional status in preterm babies. Also the use of combination of parameters or criteria will ensure that all malnourished babies will be identified. It is obvious from this study and other similar studies that preterm infants also suffer FM. A newborn infant with FM is a high risk newborn who is prone to short and long term complications of FM. A newborn should be properly assessed at birth as identifying FM will greatly impact on the proactive management of anticipated complications. The combination of BMI and PI in assessing the preterm baby at birth is advocated as part of the essential newborn care as it will ensure that those babies with FM are identified and closely monitored or followed up.
5 Conclusion
FM is also common in preterm babies. BMI and PI are simple and easy tools to use in assessing FM in preterm babies. They are also better identifiers of FM in preterm newborns compared to CANScore. The combination of BMI and PI in assessing the newborn at birth will ensure that no malnourished baby is missed.
Notes
Peer review under responsibility of Alexandria University Faculty of Medicine.
Available online 16 February 2017
References
- C.H.FallFetal malnutrition and long-term outcomesNestle Nutr Inst Workshop Ser742013112510.1159/000348384
- K.E.ScottR.H.UsherFetal malnutrition: its incidence causes and effectsAm J Obstet Gynaecol941966951963
- O.J.AdebamiJ.A.OwaG.A.OyedejiPrevalence and problems of fetal malnutrition in term babies at Wesley Guild Hospital Southwest NigeriaWest Afr J Med262007278282
- A.KorkmazÖ.TeksamM.YurdakökFetal malnutrition and its impacts on neonatal outcome in preterm infantsTurkish J Pediatr532011261268
- J.MetcoffClinical assessment of nutritional status at birth. Fetal malnutrition and SGA are not synonymousPediatr Clin North Am411994875891
- J.A.OwaJ.O.AdebamiLooking for the best indicator of fetal malnutrition: an overviewInter J Nutr Well320071216
- O.J.AdebamiJ.A.OwaComparison between CANSCORE and other anthropometric indicators in fetal malnutritionInd J Paediatr752008439442
- World Health Organisation. The newborn infant. In: WHO physical status: The use and interpretation of Anthropometry. Report of a WHO Expert Committee. WHO Techn Rep Ser. 1995; 854: 121–158.
- D.JaynatJ.RajkumarStudy of the prevalence and high risk factors for fetal malnutrition in term newbornsAnn Trop Paediatr191999273277
- O.J.AdebamiG.A.OyedejiJ.O.AderinsolaThe influence of maternal socio-economic and nutritional status on fetal malnutrition in NigeriaInter J Third World Med4200717
- A.LechtigPredicting risk of delivering LBW babies: which indicator is better?J Trop Pediatr3419883441
- J.GustafssonNeonatal energy substrate productionInd J Med Res1302009618623
- Greve J, Schultz-Nielsen ML, Tekin E. Fetal Malnutrition and Academic Success: Evidence from Muslim Immigrants in Denmark. NBER Working Paper No. 21545; 2015. <http://https://www.nber.org/papers/w21545>.
- D.I.W.PhillipsD.J.P.BarkerC.N.HalesThinness at birth and insulin resistance in adult lifeDiabetologia371994150154
- E.R.BlackH.A.LindsayA.B.ZulfiquarMaternal and child under-nutrition: global and regional exposures and health consequencesLancet372008243260
- J.M.CarreraR.DevesaJ.SalvadorAetiology and pathogenesis of intrauterine growth restrictionA.KurjakTextbook of Perinatal Medicine1998Parthenon PublishingLondon11711191
- J.MetcoffMaternal-fetal nutritional relationshipsG.C.ArneilJ.MetcoffPediatr Nutrition1985ButterworthLondon56106
- Z.CookS.KirkS.LawrensonS.SandfordUse of BMI in the assessment of undernutrition in older subjects: reflecting on practiceProc Nutr Soc6432005313317
- P.S.ThammannaM.SandeepP.V.SridharA comparative study to assess fetal malnutrition by clinical assessment of nutritional status score (Can score) and anthropometric indicesJ Evid based Med Healthcare237201558205827
- R.S.BrockM.C.FalcãoC.LeoneBody mass index values for newborns according to gestational ageNutr Hosp232008487492
- I.E.OlsenL.M.LawsonA.N.FergusonBMI curves for preterm infantsPediatrics13532015e1e10
- A.De CuntoG.PaviottiL.RonfaniCan body mass index accurately predict adiposity in newborns?Arch Dis Child Fetal Neonatal Ed992014F238F23910.1136/archdischild-2013-305386
- Kamath MK, Rao SS, Shenoy RD. Assessment of fetal malnutrition by body mass index and intra uterine growth curves: a comparative study. Int J Contemp Pediatr, Online First: 10 May, 2016. <http://doi:10.18203/2349-3291.ijcp20161415>.
- A.B.DhanorkarP.BagdeyA.HumneS.UghadeS.P.YadavA.D.KhadseDetection and comparison of fetal malnutrition by CANSCORE and other methodsInt J Res Med Sci22014481484
- S.Martínez-NadalX.DemestreF.RaspallC.VilaJ.ÁlvarezP.SalaValoración clínica del estado nutricional fetal al nacer mediante el clinical assessment of nutritional status scoreAn Pediatr (Barc)842016218223
- L.O.LubchencoC.HansmanE.BoydIntrauterine growth in length and head circumference as estimated from live births at gestational ages from 26 to 42 weeksPediatrics371966403408
- B.N.EzenwaE.O.IrohaV.C.EzeakaM.T.Egri-OkwajiComparative study of Clinical Assessment of Nutritional status score and proportionality indices in the assessment of fetal malnutrition in term newbornsNiger Med J572016124128
- J.M.AlmarzokiD.J.RanaComparative study between Clinical Assessment of Nutritional status score (CAN Score) and Anthropometry in the assessment of Fetal malnutritionInt Res J Med Sci372015812
- M.SoundaryaA.BasavaprabhuK.RaghuveeraB.S.BaligaB.S.V.ShivanagarajaComparative assessment of fetal malnutrition by anthropometry and CAN scoreIran J Pediatr22120127076
- M.E.CaizaJ.L.DíazF.SiminiÍndice ponderal para calificar a una población de recién nacidos a términoAn Pediatr (Barc)5920034853
- V.SinghalP.AgalN.KamathDetection of fetal malnutrition by CAN score at birth and its comparison with other methods of determining intrauterine growthInd J Clin Pract22112012576582
- P.SifianoApproaching the diagnosis of growth restricted neonates; a cohort studyBMC Pregnancy and Childbirth102010611