
 ?Mathematical formulae have been encoded as MathML and are displayed in this HTML version using MathJax in order to improve their display. Uncheck the box to turn MathJax off. This feature requires Javascript. Click on a formula to zoom.
Abstract
Background
Type 2 diabetes mellitus (T2DM) is characterized by insulin resistance, hyperinsulinaemia and hyperglycaemia. Increased glucose production through abnormally elevated hepatic gluconeogenesis is central to the manifestation of hyperglycaemia in T2DM. Metformin corrects hyperglycaemia mainly through inhibition of gluconeogenesis. Sirtuin 1 (SIRT1) has been identified as regulator of gluconeogenic gene expression. The present study aimed to evaluate the effect of metformin on SIRT1 level and activity in liver and pancreas of diabetic rats. Further, the possible role of SIRT1 on metabolic disorders associated with diabetes mellitus, including serum levels of glucose, insulin, triglyceride (TG) and high density lipoprotiens (HDL), will be explored.
Methods
Thirty-two male albino rats were divided into control group (GpI), diabetic (DM) group (GpII), (metformin + DM) group (GpIII) administered 120 mg/kg metformin daily for 1 month before induction of diabetes, (DM + metformin) group (GpIV) administered 250 mg/kg metformin daily for 1 month after induction of diabetes. At the end of the study, BMI%, serum levels of glucose, insulin, TG and HDL, HOMA, SIRT1 level and activity in liver and pancreas and pancreatic DNA ladder were assessed.
Results
Our results showed significant decrease in serum glucose, insulin and TG levels and HOMA; significant increase in HDL level and SIRT1 level and activity in liver and pancreas beside the marked disappearance of pancreatic apoptosis in GpIII & IV relative to GpII. Regarding BMI%, it showed no significant changes in GpIV relative to GpII. No significant change was recorded between GpIII and GpIV regarding all studied parameters except on serum TG.
Conclusion
Lowered SIRT1 in diabetes was improved by the administration of Metformin. Consequently, the pathophysiological disorders associated with T2DM were improved.
Keywords:
1 Introduction
Prevalence of type 2 diabetes mellitus (T2DM) has increased dramatically over the past four decades. T2DM is characterized by insulin resistance, hyperinsulinemia and hyperglycemia. Also, abnormal elevated hepatic gluconeogenesis is central to the manifestation of hyperglycemia in T2DM.Citation42
Beside, an increase in beta cell apoptosis is an important factor contributing to beta cells loss and the onset of T2DM.Citation46 There is in vitro evidence that gluco-toxicity and lipo-toxicity exert synergistic effects to impair the secretory function of beta cells and to promote apoptosis in T2DM.Citation16
Sirtuin 1 (SIRT1): a homolog of the yeast protein Silent Information Regulator 2 (Sir2), encodes the NAD (nicotinamide adenine dinucleotide) dependent histone deacetylase enzyme. It may play a key role in stress responses and cellular metabolism, through deacetylating a variety of substrates, including histones, transcription factors and coregulators, to regulate target gene expression both positively and negatively.Citation35
SIRT1 activators improve whole-body glucose homeostasis and insulin sensitivity in adipose tissue, skeletal muscle and liver. Thus, SIRT1 activation is a promising new therapeutic approach for treating diseases of ageing such as T2DM.Citation35
Metformin, the primary therapeutic agent for T2DM patients, corrects hyperglycemia and hyperinsulinemia predominantly by enhancing insulin-mediated suppression of hepatic glucose production and enhancing insulin-stimulated glucose uptake by skeletal muscles.Citation25
Caton et al.,Citation9 reported that the activation of hepatic AMPK by metformin will consequently increase SIRT1 activity. This will result in reduced levels and activity of the coactivators cAMP-response element binding protein-regulated transcription coactivator 2 (TORC2) or CRTC2) level – mediated gluconeogenesis, thus lowering plasma glucose and insulin.
In our previous work on similar model, we investigated the possible influence of 30% caloric restriction on SIRT1 in diabetic rats, and we found that both pre-diabetes CR and post-diabetes CR regimens were associated with significant improvement of insulin resistance and its subsequent hyperglycemia beside their role in attenuation of the marked decrease of SIRT1 in the liver and pancreas that accompanied the induction of type 2 diabetes mellitus.Citation18
In the present study, we investigated the effect of metformin on SIRT1 level and activity in liver and pancreas of diabetic rats. Further, the possible role of SIRT1 on metabolic disorders associated with diabetes mellitus will be explored.
2 Material and methods
2.1 Animals and experimental design
32 male albino rats, approximately aged 8 weeks and weighed 150–200 gram were housed in wire mesh cages at room temperature under ordinary living conditions. Rats were fed for whole period of study on standard laboratory rat diet (standard rat chow), Veterinary care was provided by laboratory animal house unit of faculty of Medicine, Cairo University.
Animals were randomly divided into the following 4 groups: Group I: control group (n = 8): rats were injected citrate buffer and no further medications or life style modifications were applied.
Group II: diabetic (DM) group (n = 8): rats were fasted for 12-h before induction of diabetes. Streptozotocin (STZ) was freshly dissolved in 0.05 M citrate buffer, pH 4.5 and injected intraperitoneally in a single dose of 40 mg/kg.Citation4 No further treatment or dietary modification was applied for 1 month.
Group III: metformin + diabetes (metformin + DM) group (n = 8): rats administered 120 mg/kg metformin orally once dailyCitation9 for 1 month before induction of diabetes and sacrificed after 3 days.
Group IѴ: diabetes + metformin (DM + metformin) group (n = 8): rats were subjected for induction of diabetes followed by administration of 250 mg/kg metformin once daily (Foretz et al., 2010) for1 month.
At the end of the study protocol, all animals were weighed in grams & their naso-anus lengths in cm while the rats were anesthetized with ether were measured to calculate their body mass index (BMI) as an index of obesity according to an equation formulated byCitation17:
Subsequently, fasting blood samples were withdrawn retro-orbital using a capillary tube in for assessment of fasting serum glucose, fasting serum insulin, (HOMA-IR), serum triglycerides (TG) and serum high density lipoprotein (HDL) levels. Animals were then scarified followed by rapid excision of liver and pancreas for further assessment of SIRT1 level and activity and pancreatic DNA ladder.
Serum glucose level was tested by kits supplied by “Diamond Diagnostics”.Citation53 The serum insulin concentrations were measured by enzyme immunoassay using the rat insulin ELISA kits,Citation22 and HOMA-IR index was calculated as the product of fasting serum insulin (μIU/L) and fasting serum glucose (mmol/L) divided by 22.5. HOMA more than 4.0 is diagnostic of insulin resistance.Citation19
The serum triglyceride was measured by quantitative – enzymatic –colorimetric determination of triglycerides in serum.Citation5 However, HDL-Cholesterol is obtained through selective precipitation of LDL and VLDL lipoproteins, thus HDL lipoproteins remain in solution. HDL-Cholesterol in supernatant was treated as a sample for cholesterol assay, and after many reactions a colored compound was yielded. The color was measured at 546 nm and was proportional to HDL-Cholesterol concentration in sample when used as directed.Citation41
Abcam’s SIRT1 Activity Assay Kit (Fluorometric) (ab156065) measures the activity of SIRT1 by the basic principle of changing a SIRT1 reaction into the activity of the protease. In order to measure the enzyme activity of SIRT1, which is the NAD dependent histone deacetylase, and its homolog, this kit is designed so that the activity of NAD dependent histone deacetylase can be measured under existence of Trichostatin A, which is the powerful inhibitor of HDACs.Citation58
2.2 Detection of SIRT1 gene expression by real time-polymerase chain reaction (real time-PCR) in liver and pancreasCitation43
2.2.1 RNA isolation and reverse transcription
RNA was extracted from the hepatic and pancreatic tissue homogenate using the RNeasy plus mini kit (Qiagen, Venlo, The Netherlands), according to the manufacturer’s instructions. Genomic DNA was eliminated by a DNase-on-column treatment supplied with the kit. The RNA concentration was determine spectrophotometrically at 260 nm using the NanoDrop ND-1000 spectrophotometer (ThermoFisher scientific, Waltham, USA) and RNA purity was checked by means of the absorbance ratio at 260/280 nm. RNA integrity was assessed by electrophoresis on 2% agarose gels. (1 µg) of RNA were used in the subsequent cDNA synthesis reaction, which was performed using the Reverse Transcription System (Promega, Leiden, The Netherlands). Total RNA was incubated at 70 °C for 10 min to prevent secondary structures. The RNA was supplemented with MgCl2 (25 mM), RTase buffer (10X), dNTP mixture (10 mM), oligod(t) primers, RNase inhibitor (20 U) and AMV reverse transcriptase (20 U/µl). This mixture was incubated at 42 °C for 1 h.
2.2.2 Quantitative real time PCR
qPCR was performed in an optical 96-well plate with an ABI PRISM 7500 fast sequence detection system (Applied Biosystems, Carlsbad, California) and universal cycling conditions min 95 °C, 40 cycles of 15 s at 95 °C and 60 s at 60 °C). Each 10 µl reaction contained 5 µl
SYBR Green Master Mix (Applied Biosystems), 0.3 µl gene-specific forward and reverse primers (10 µM), 2.5 µl cDNA and 1.9 µl nuclease-free water. The sequences of PCR primer pairs used for each gene are shown in . Data were analyzed with the ABI Prism sequence detection system software and quantified using the v1·7 Sequence Detection Software from PE Biosystems (Foster City, CA). Relative expression of studied genes was calculated using the comparative threshold cycle method. All values were normalized to the GAPDH genes R1.Citation28
Table 1 Primer sequences used for RT-PCR.
2.3 Detection of DNA fragmentationCitation11
DNA was extracted from the pancreas using the kit supplied by Qiagen according to the manufacturer's instructions. Then Gel electrophoresis was done for extracted DNA.
2.3.1 Statistical analysis
Data were coded and entered using the statistical package SPSS version 15. Data were summarized using mean, standard deviation and % change for the quantitative variables. Comparisons between groups were done using analysis of variance (ANOVA) and multiple comparisons (Post Hoc test) for the quantitative variables. P-values less than 0.05 were considered as statistically significant.Citation10
3 Results
3.1 Comparison between BMI%, serum glucose (mmol/L), serum insulin (µIU/L) levels and HOMA in all studied groups
As observed in , BMI% was insignificantly increased by 6.47% (P = 0.290) while fasting serum glucose (mmol/L), serum insulin (µIU/L) and (HOMA) levels were significantly increased (P = 0.000) by 163.04%, 79.16% and 378.70% respectively in diabetic group (GpII) compared to control group (GpI). Mean values in diabetic group were respectively 280.06 ± 19.8; 12.81 ± 1.94; 17.88 ± 1.23 and 10.34 ± 2.17 versus 263.05 ± 9.68; 4.87 ± 0.18; 9.98 ± 1.24 and 2.16 ± 0.24 in control group.
Table 2 Changes of BMI%, fasting serum glucose (mmol/L), fasting serum insulin (µIU/L) levels and HOMA in all studied groups.
As shown in , administration of metformin for 1 month before induction of diabetes was associated with significant improvement in BMI% (P = 0.001), serum glucose level, serum insulin level and HOMA (P = 0.000) in which these parameters were lower than diabetic group (GpII) by 17.35%, 50.04%, 27.74% and 63.73% respectively. Mean values of BMI%, glucose, insulin and HOMA were 249.92 ± 14.64, 6.40 ± 1.15, 12.92 ± 2.04 and 3.75 ± 1.26 in GpIII versus 280.06 ± 19.8, 12.81 ± 1.94, 17.88 ± 1.23 and 10.34 ± 2.17 in GpII. Interestingly, compared to control values, BMI%, serum glucose level and HOMA in GpIII showed a non-significant higher difference (P > 0.05) of 4.99%, 31.42% and 73.61% respectively while insulin was significantly higher by 29.46% (P = 0.008). Mean values of BMI%, glucose, insulin and HOMA were respectively 249.92 ± 14.64, 6.40 ± 1.15, 12.92 ± 2.04 and 3.75 ± 1.26 in GpIII versus 263.05 ± 9.68; 4.87 ± 0.18; 9.98 ± 1.24 and 2.16 ± 0.24 in GpI.
Also showed that administration of metformin for 1 month after inducing diabetes in GpIV had no significant effect (P > 0.05) on BMI% relative to both diabetic and control groups. Mean values were 267.95 ± 10.31 in GpIV versus 280.06 ± 19.8 in GpII and 263.05 ± 9.68 in GpI. However, a significant improvement (P = 0.000) regarding fasting serum glucose (mmol/L), fasting serum insulin (µIU/L) and HOMA were observed in GpIV compared to GpII. They were significantly decreased by 47.15%; 26.67% and 60.93% respectively in GpIV compared to GpII.
On the other hand, relative to GpI, fasting serum glucose and HOMA in GpIII showed insignificant difference (P > 0.05); while serum insulin (µIU/L) was significantly higher by 31.36% (P = 0.004) in GpIII. Mean values for serum glucose, insulin and HOMA were respectively 6.77 ± 1.53; 13.11 ± 1.78; 4.04 ± 1.52 in GpIV, versus 12.81 ± 1.94; 17.88 ± 1.23; 10.34 ± 2.17 in GpII and 4.87 ± 0.18; 9.98 ± 1.24; 2.16 ± 0.24 in GpI.
Our study showed that although the administration of metformin before induction of diabetes had a higher improving effect on fasting serum glucose, insulin and HOMA levels than post-diabetic metformin, yet this difference was insignificant (P > 0.05).
Mean values were respectively 6.77 ± 1.53; 13.11 ± 1.78; 4.04 ± 1.52 in GpIV; 6.40 ± 1.15; 12.92 ± 2.04; 3.75 ± 1.26 in GpIII versus 12.81 ± 1.94, 17.88 ± 1.23; 10.34 ± 2.17 in GpII as shown in . Regarding BMI%, it revealed no significant change in (P > 0.05) comparing corresponding mean values in GpIV (267.95 ± 10.31) versus GpIII (249.92 ± 14.64).
3.2 Comparison between the serum TG (mg/dl) and HDL (mg/dl) levels in all studied groups
As shown in , serum TG level (mg/dl) was significantly increased by 68.56% (P = 0.000), while serum HDL level (mg/dl) was significantly decreased by 37.2% (P = 0.000) in diabetic group compared to control group. Mean values were 102.18 ± 12.48; 31.72 ± 1.65 in GpII versus 60.62 ± 12.54; 50.52 ± 4.08 respectively in GpI.
Table 3 Changes of TG (mg/dl) and HDL (mg/dl) levels in all studied groups.
Similar to its beneficial effect on BMI%, serum glucose, insulin and HOMA, the pre-diabetic metformin lowered significantly the serum TG (mg/dl) level by 22.70% (P = 0.004) and increased significantly the serum HDL (mg/dl) level by 24.53% (P = 0.041). Mean values attained 78.99 ± 8.81 and 39.50 ± 5.07 respectively in GpIII versus 102.18 ± 12.48 and 31.72 ± 1.65 respectively in GpII. Despite this beneficial effect, full recovery in serum TG and HDL levels was not achieved. A significant difference by 30.30% (P = 0.042) and −21.81% (P = 0.001) existed respectively comparing GpIII versus GpI. Mean values were 78.99 ± 8.81; 39.50 ± 5.07 in GpIII versus 60.62 ± 12.54; 50.52 ± 4.08 respectively in GpI ().
As observed in , a significant improvement (P = 0.000) in serum TG by 41.97% and HDL levels (mg/dl) by 39.9% was recorded comparing corresponding values of post diabetic metformin administration in GpIV relative to GpII. Even more, compared to control group, no significant difference was noticed (P > 0.05). Mean values of serum TG and HDL levels were respectively 59.30 ± 12.30; 44.38 ± 7.46 in GpIV versus 102.18 ± 12.48; 31.72 ± 1.65 in GpII and 60.62 ± 12.54; 50.52 ± 4.08 in GpI.
On the other hand, comparing the effect of pre-diabetic versus post-diabetic metformin, our results showed that TG level in GpIV was significantly (P = 0.022) lower by 24.93% relative to GpIII. However, no significant difference (P > 0.05) was recorded as regards serum HDL comparing both groups. Mean values were respectively 59.30 ± 12.30; 44.38 ± 7.46 in GpIV versus 78.99 ± 8.81; 39.50 ± 05.07 in GpIII ().
3.3 Comparison between the SIRT1 level and SIRT1 activity (ng/dl) in the liver and pancreas of all studied groups
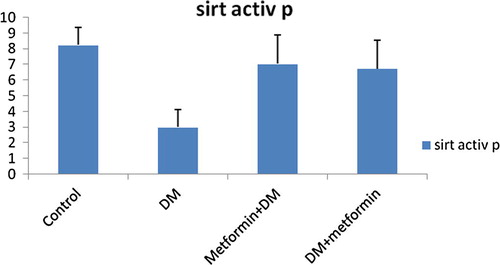
As shown in , and , SIRT1 level and activity in the liver were significantly (P = 0.000) decreased by 54.84% and 55.81% respectively following induction of diabetes. Mean values were 0.98 ± 0.22; 2.28 ± 0.58 in GpII versus 2.17 ± 0.35; 5.16 ± 1.28 in GpI respectively.
Fig. 1 Changes of SIRT1 level (ng/dl) in liver in all studied groups.
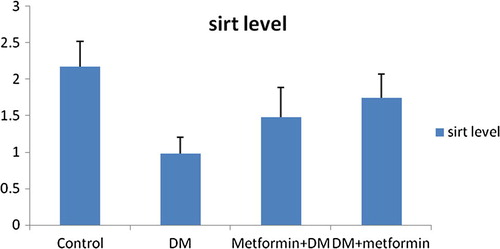
Fig. 2 Changes of SIRT1 activity (ng/dl) in liver in all studied groups.
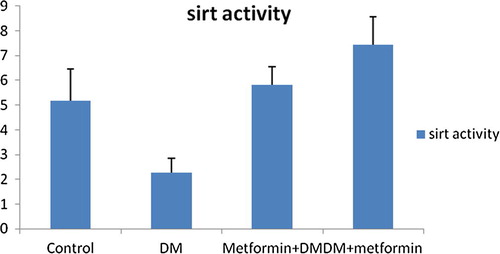
Table 4 Changes of SIRT1 level (ng/dl) and SIRT1 activity (ng/dl) in liver and pancreas in all studied groups.
We noticed that pre-diabetic metformin was significantly effective to counteract the reduction of SIRT1 level and activity in the liver and pancreas of diabetic group. Our results for GpIII showed a significant improvement in SIRT1 level and activity in liver (ng/dl) by 51.02% (P = 0.005), 154.82% (P = 0.000) respectively relative to GpII. Even more, no significant difference was detected comparing GpIII to control group (P > 0.05). Mean values of SIRT1 level and activity in liver were respectively 1.48 ± 0.41; 5.81 ± 0.75 in GpIII versus 0.98 ± 0.22; 2.28 ± 0.58 in GpII and 2.17 ± 0.35; 5.16 ± 1.28 in GpI.
As shown in , and , SIRT1 level and activity in pancreas were significantly decreased by 59.3% (P = 0.009) and 63.71% (P = 0.000) achieving mean values of 0.70 ± 0.25; 2.99 ± 1.13 in GpII versus 1.72 ± 0.55; 8.24 ± 1.13 in GpI respectively.
Fig. 3 Changes of SIRT1 level (ng/dl) in pancreas in all studied groups.
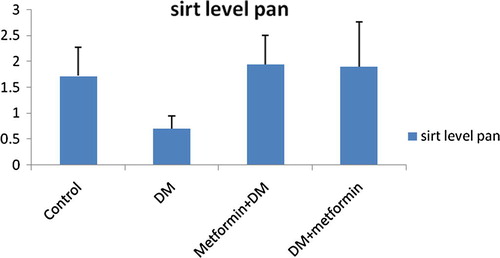
Fig. 4 Changes of SIRT1 activity (ng/dl) in pancreas in all studied groups.
We also recorded significant elevation of SIRT1 level and activity in pancreas in GpIII by 177.14% (P = 0.001) and 135.46% (P = 0.000) relative to GpII and showed insignificant difference (P > 0.05) compared to control group. Mean values were respectively 1.94 ± 0.57; 7.4 ± 1.85 in GpIII versus 0.70 ± 0.25; 2.99 ± 1.13 in GpII and 1.72 ± 0.55; 8.24 ± 1.13 in GpI ().
Also, metformin intake for 1 month after induction of diabetes induced a significant enhancement in SIRT1 level and activity in the liver of diabetic rats. Data showed a significant increase (P = 0.000) in SIRT1 level and activity in liver by 77.55% and 226.32% respectively in GpIV relative to diabetic group. Although relative to control group, SIRT1 level in liver of GpIV showed insignificant difference (P > 0.05), yet a significant difference of 44.19% still existed (P = 0.003) regarding the SIRT1 activity. Mean values were respectively 1.74 ± 0.33; 7.44 ± 1.12 in GpIV versus 0.98 ± 0.22; 2.28 ± 0.58 in GpII and 2.17 ± 0.35; 5.16 ± 1.28 in GpI ().
Similarly, the SIRT1 level and activity (ng/dl) in pancreatic tissues of GpIV exhibited significant elevation by 171.43% (P = 0.001) and 125.08% (P = 0.000) respectively compared to GpII. Moreover, no significant difference was detected relative to control group (P > 0.05). Mean values were respectively 1.90 ± 0.87; 6.73 ± 1.80 in GpIV versus 0.70 ± 0.25; 2.99 ± 1.13 in GpII and 1.72 ± 0.55; 8.24 ± 1.13 in GpI ().
Interestingly, our results demonstrated that the difference in the improving effect of pre-diabetic metformin relative to post-diabetic metformin was insignificant (P > 0.05). Mean values of SIRT1 level and activity in liver were respectively1.74 ± 0.33; 7.44 ± 1.12 in GpIV versus 1.48 ± 0.41; 5.81 ± 0.75 in GpIII. As well, mean values of SIRT1 level and activity in pancreas were respectively 1.90 ± 0.87; 6.73 ± 1.80 in GpIV versus 1.94 ± 0.57; 7.04 ± 1.85 in GpIII ().
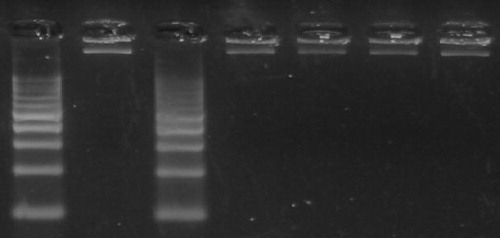
3.4 Changes in DNA ladder among all studied groups
The DNA fragmentation pattern was monitored in treated and untreated pancreatic tissue on agarose gel electrophoresis. Necrotic strand breaks/streaking DNA was observed diabetic group (GpII), but not in groups pretreated with metformin (GpIII) prior to STZ exposure and also in diabetic rats treated with metformin (GpIV) as revealed in .
Fig. 5 DNA fragmentation pattern in pancreas among all studied groups.
Our results also showed that in diabetic group there was significant inverse relationship between (SIRT1 level and activity in liver and SIRT1 level in pancreas) and (BMI%, serum levels of glucose, insulin and TG, and HOMA) meanwhile the formers showed significant positive correlation with serum HDL level.
On the contrary, BMI%, serum levels of glucose, insulin, TG and HDL, and HOMA were not significantly correlated with the pancreatic SIRT1activity.
However, regarding group III (metformin + DM) there was significant decrease in (BMI%, serum levels of insulin, TG and HDL, and HOMA) associated with (the elevation of SIRT1 level and activity in the liver and pancreas). Meanwhile the later showed significant positive correlation with serum HDL level. Although the serum glucose level was also significantly decreased parallel to the increase in SIRT1 activity in both liver and pancreas in rats received metformin before induction of diabetes yet its level was insignificantly correlated with SIRT1 level in liver and pancreas.
On the other hand, the elevated SIRT1 level and activity in hepatic and pancreatic tissues of diabetic rats following administration of metformin over 1 month was associated with significant diminution of BMI%, serum levels of glucose, insulin and TG, and HOMA) and significant increase in serum HDL level respectively .
4 Discussion
The rising incidence of type 2 diabetes mellitus (T2DM) is a major public health problem in industrialized countries and new therapeutic strategies to treat and prevent T2DM are urgently needed worldwide.Citation51
Abnormal elevation of hepatic gluconeogenesis is central to the onset of hyperglycaemia in patients with T2DM. Metformin corrects hyperglycaemia through inhibition of gluconeogenesis, but its mechanism of action is yet to be fully described.Citation9
SIRT1 was originally identified as a NAD+-dependent histone deacetylase, has been identified as regulator of gluconeogenic gene expression.Citation9. Growing evidence suggests that SIRT1 regulates glucose-lipid metabolism through its deacetylase activity for many known substrates. SIRT1 has also many roles in the metabolic pathways through its direct or indirect involvement in insulin signaling in insulin-sensitive organs, including adipose tissue, liver and skeletal muscles.Citation24 In addition, SIRT1 regulates insulin secretion, adiponectin production, inflammation, gluconeogenesis and oxidative stress, which together contribute to the development of insulin resistance.Citation30
The present work has been designed to investigate the possible link of the action of metformin on SIRT1 in diabetic rats and if metformin could be a line of treatment that is helpful in re-establishing the physiological relevant activity of SIRT1 known to be attenuated with diabetes. We also attempted to test if it has any preventive value through tempering of SIRT1 disorders associated with the development ofT2DM.
Therefore, we induced diabetes in eight adult male rats (GpII) by single intra-peritoneal injection of 40 mg/kg STZ, a well-known specific toxin causing pancreatic β-cell partial damage.Citation4 It was in agreement with our results, in which there was marked pancreatic apoptosis obtained after induction of diabetes.
Consequently, the fasting serum glucose level was significantly elevated, indicating hyperglycemia compared to control group. Moreover, our results also showed a significant increase in fasting serum insulin level and HOMA-IR confirming the characteristic features of T2DM. Results may be explained by the occurrence of insulin resistance in peripheral tissues especially skeletal muscles regarding their importance in glucose homeostasis.
Our results were in agreement with Kadowaki et al.Citation26 who stated that in streptozotocin (STZ)-induced diabetic rats, the number of insulin receptors is increased, whereas the receptor tyrosine kinase activity per unit of insulin binding is severely reduced. While, Burant et al.Citation6 suggested that peripheral insulin resistance associated with streptozotocin induced DM, may be related to modifications in insulin receptor structure and the glucose transport system, resulting in impaired signal transmission.
Beside, obtained data for BMI% showed a non-significant increase in diabetic group compared to control group. Our results could be primarily explained by the significant insulin resistance (hyperinsulinemia) which was in agreement with Takada et al.Citation52 who reported that diabetes associated polyphagia may be the cause of this non-significant weight change particularly that our rats in GpII were fed ad libitum and they may need a longer duration to exhibit weight loss.
Insulin resistance and T2DM are associated with a clustering of interrelated plasma lipid and lipoprotein abnormalities, which include reduced HDL cholesterol and elevated TG levels.Citation8 Similarly, our results showed significant elevation of serumTG level by 68.56% and significant reduction of serum HDL level by 37.2% in diabetic rats versus the control group.
As well, KraussCitation32 emphasized that insulin resistance may play a pivotal role in the development of diabetic dyslipidemia by influencing several factors. Increased efflux of free fatty acids from adipose tissues and impaired insulin-mediated skeletal muscle uptake of free fatty acids, increase fatty acids flux to the liver.
Beside, insulin resistance also increases hepatic lipase activity which is responsible for hydrolysis of phospholipids in LDL and HDL particles and leads to smaller and denser LDL particles and a decrease in HDL.Citation39
As Caton et al.Citation9 demonstrated that SIRT1 is implicated in the regulation of glucose metabolism and insulin sensitivity we thought that studying the associated disorders in SIRT1 might be beneficial. Our results showed that SIRT1 level and activity were decreased by 54.84% and 55.81% respectively in the liver and by 59.30% and 63.71% respectively in the pancreas of diabetic rats. Remarkably, there was marked pancreatic apoptosis after induction of diabetes.
Our results were in agreement with SuvarnaCitation50 who found that the nutrients availability such as high serum glucose in diabetic rats are associated with decreased levels of NAD/NADH+- which are the main activators of SIRT1- leading to decreased SIRT1 release and activity.
However, we could not specify if the decrease in SIRT1 shared partially in the development of hyperglycemia and IR or the STZ-induced T2DM was the initial cause of the observed decrease in SIRT1.
Meanwhile, our results in GpII revealed that the elevated serum glucose, insulin, HOMA and TG were parallel to the decline in SIRT1 level and activity (inverse correlation). Regarding the changes in serum HDL and SIRT1, both showed a positive correlation.
Data could be explained by Sebastián et al.Citation49 who suggested that a combination of over-nutrition, inactivity, genetic and other factors interact to produce a state of metabolic susceptibility that leads to dysregulation of AMPK and SIRT1. This in turn could lead to insulin resistance, subsequent hyperinsulinemia, mitochondrial dysfunction, and abnormalities in cellular lipid metabolism.
Wang et al.Citation54 showed that hepatic-specific deletion of SIRT1, lead to hepatic glucose overproduction and hyperglycemia. The resulting increase in ROS impairs insulin signaling in insulin-sensitive tissues, such as adipose tissues and muscles, leading to insulin resistance.
In addition, Bordone et al.Citation3 showed that a reduction in SIRT1 levels reduces the capacity of β-cells to secrete insulin in response to glucose. This fact was explained by Rogina and HelfandCitation47 who noticed elevated levels of UCP2 in cells with reduced SIRT1. Thus ATP synthesis was reduced lowering the amplitude of insulin induction by glucose.
Metformin has been shown to be highly effective in delaying or preventing T2DM in those having IGT.Citation13 Parallel, in our study, rats administered metformin (120 mg/kg) once daily for a period of one month before induction of diabetes, showed significant decrease in their BMI%, serum glucose level, serum insulin level and HOMA when compared to diabetic group (GpII).
The diabetes prevention program (DPP) demonstrated that intervention with metformin decreased the development of diabetes in adults with impaired glucose tolerance by 31%.Citation15 Also, Mark et al.Citation37 were in agreement with our results who demonstrated that metformin administration to normal rats is capable of preventing the development of acute lipid-induced insulin resistance. The primary effect of metformin was amelioration of the lipid-impaired insulin suppressibility of HGO; thus, the liver would seem to be the principal target tissue for this prophylactic effect.
In the same context, Mithieux et al.Citation38 reported that in hyper-insulinemiceuglycemic clamping (HEC) conditions, metformin pretreatment resulted in increased storage of liver glycogen, in high-fat–fed rats, suggesting that metformin attenuated glycogenolysis or enhanced glycogen synthesis, perhaps from gluconeogenic substrates.
On the other hand, Kim et al.Citation29 examined chronically insulin-resistant high-fat–fed rats under HEC conditions and demonstrated adverse effects on HGO before the manifestation of attenuated peripheral glucose disposal. There was no accompanying reduction in triacylglycerol storage in liver after acute lipid infusion and HEC suggesting that this is not the primary mechanism for the effect of metformin on HGO.
Scientists have implicated enhancement of liver signaling in the mechanism of metformin effect, as the drug induced increases in AMPK activity along with reduced JNK proteinCitation21 and in skeletal muscle of individuals with T2DM after 4 weeks’ administration of the drug.Citation40
In contrast, no effect of metformin was detected on AMPK activity in red or white muscle or a central fat depot, consistent with a lack of effect of the drug on peripheral glucose disposal.Citation37 Therefore, Samuel et al.Citation48 suggested that the effects of metformin on gluconeogenesis may be in part mediated through its effects on other important gluconeogenic enzymes, such as pyruvate carboxylase, pyruvate kinase or glucose 6-phosphatase.
Overall, these findings may help in explaining the prophylactic effect of metformin to oppose further deterioration in gluco-regulation in humans with impaired glucose tolerance or obesityCitation31 and in implicating enhanced liver signaling in the therapeutic mechanism of action of metformin.
Similar to its beneficial effects on BMI%, serum glucose, insulin and HOMA, when given for 1 month before induction of diabetes in GpIII, metformin was also found to significantly reduced the serum TG level and the serum HDL level was increased significantly relative to diabetic rats in GpII.
Our results were in agreement with Goldberg et al.Citation23 who reported that metformin modestly reduced small and dense LDL and raised small and large HDL. They suggested that the effect of metformin to increase small HDL was independent of adiponectin, BMI, and insulin resistance. These findings support the notion that metformin use may be considered as prophylactic therapy aimed at lowering cardiovascular risk factors.Citation2
Furthermore, this study showed that metformin administration over 1 month before induction of diabetes was associated with less reduction in the level and activity of SIRT1 in liver than that occurred in diabetic rats. Additionally, no apoptotic changes were detected in the pancreas of GpIII.
Yoshizaki et al.Citation57 suggested that this cross talk between metformin and SIRT1 may be of additive role in protection against obesity, dyslipidemia, pancreatic inflammation, apoptosis and IR thus preventing or at least delaying the occurrence of T2DM.
Interestingly, our results revealed that the significant increase in SIRT1 was associated with significant increase in HDL level (+ve correlation) although it was negatively correlated with BMI%, serum levels of glucose, insulin, TG and HOMA.
However, it is not clear whether metformin improved hyperglycemia and hence spared SIRT1 from the negative feedback of the low levels of NAD+/NADH or metformin activated SIRT1 via AMPK signaling pathway which in turn improved diabetes mellitus. In support, there is a striking resemblance between the pleiotropic effects of metformin and the physiological features of SIRT1 activation.Citation55 In both cases reduced inflammation and oxidative stress, weight loss, improvement in plasma lipid profile as well as reduced the beta cells destruction (apoptosis) take place.Citation56
Our study tried to evaluate which of the pre- or post-diabetic metformin was more beneficial? Undoubtly, metformin has been in wide clinical use for the alleviation of the hyperglycemia associated with T2DM for decades.Citation44 Concomitant with this, our results showed that fasting serum glucose level (mmol/L), fasting serum insulin level (µIU/L) and HOMA were significantly decreased in GpIV compared to GpII. Meanwhile, BMI% was insignificantly decreased in GpIV compared to GpII.
Despite this, a comprehensive molecular basis for the antihyperglycemic mechanism of action of metformin has yet to be established. Whereas Kumar and DeyCitation33 reported that metformin was shown to ameliorate defects in insulin signaling in vitro, involving activation of IRSs and associated phosphatidyl inositol 3 kinase activity.
In addition, metformin activates AMPK in hepatocytes,Citation21 whereas enzyme activity was elevated in skeletal muscle of diabetic patients after 4 weeks of metformin treatment.Citation40
Metformin treatment also had positive effects on the insulin signaling pathway in the liver.Citation36 Metformin induces reductions in JNKs which have been shown to phosphorylate IRS-1 in vitro thus reducing its activity. This could be important in mediating the ability of metformin to reduce the impact of lipid infusion on insulin action in the liver.Citation27
Our study revealed that the serum HDL level was significantly higher in GpIV (DM + metformin) relative to diabetic GpII. Moreover, the serum TG level in GpIV was significantly decreased relative to GpII.
Our results were in agreement with Afzal et al.Citation1 who observed a significant elevation in the level of TG and reduction in HDL in the animals exposed to intraperitoneal administration of chemical carcinogen diethyl nitrosamine, when compared to a normal control but these parameters were maintained to normal by the treatment of metformin. Also, Rautio et al.Citation45 reported that metformin was effective in improving several parameters of lipid profile in T2DM and non-diabetics with coronary heart disease.
Contrary to our results, Cibula et al.Citation12 demonstrated that in T2DM and non-diabetics with central fat distribution, metformin reduced cholesterol but not triglycerides. Fleming et al.Citation20 revealed that metformin use in women with PCOS have demonstrated an improvement of HDL but no significant effect on total cholesterol or triglycerides.
The divergence of the findings among these studies may be related to the characteristics of the population studied; thus, for example metformin may be more effective in more hyperinsulinemic and/or obese populations.
As observed in our work, metformin intake for 1 month after induction of diabetes induced a significant enhancement in SIRT1 level and activity in the liver and pancreas of diabetic rats relative to diabetic group (GpII). Our results showed significant elevation of SIRT1 level and activity in pancreas in GpIV relative to GpII. In addition the pancreatic apoptosis was disappeared.
Metformin has been reported to activate AMPK. Canto et al.Citation7 suggested that AMPK can increase SIRT1 activity potentially through an AMPK-mediated increase in the transcription of (NAMPT), the rate-limiting enzyme of the salvage pathway for NAD+, an essential co-factor for SIRT1 activity. Additionally, Hou et al.Citation24 have reported that SIRT1 can deacetylate and activate LKB1, leading to the activation of AMPK. This raises the possibility that a positive feedback system could be operative in response to hyperglycaemia following metformin administration.
Interestingly, Lee et al.Citation34 found that metformin-treated cells produced a lower amount of NO than control cells, which leads to resistance to cytokine toxicity. Authors also suggested that metformin through activation of SIRT1 plays a cytoprotective role against cytokine in pancreatic β-cells. SIRT1 might deacetylate non-histone proteins such as NF-κB protecting pancreatic islets from cytokine toxicity.
Finally, we should ask which was more beneficial: pre- or post- diabetic metformin? Unexpectedly, data in our work found no significant difference between the effect of metformin pre- or post- diabetic regarding BMI%, serum glucose, insulin, HDL, HOMA and pancreatic apoptosis, while serum TG level was significantly lower in GpIV.
Notably, when we compare the effect of metformin versus the effect of caloric restriction CR used in our previous publication,Citation18 we did not detect any significant difference between the effect of metformin or CR (either before or after) induction of diabetes on all the studied parameters which may be explained by Dhahbi et al.Citation14 who proposed that metformin is CR mimetic. They found that mice administered the drug exhibit similar gene expression changes as CR mice.
Conflict of interest
The authors certify that they have NO affiliations with or involvement in any organization or entity with any financial interest (such as honoraria; educational grants; participation in speakers’ bureaus; membership, employment, consultancies, stock ownership, or other equity interest; and expert testimony or patent-licensing arrangements), or non-financial interest (such as personal or professional relationships, affiliations, knowledge or beliefs) in the subject matter or materials discussed in this manuscript.
Notes
Peer review under responsibility of Alexandria University Faculty of Medicine.
Available online 5 October 2017
References
- M.AfzalI.KazmiG.GuptaPreventive effect of Metformin against N-nitrosodiethylamine-initiated hepatocellular carcinoma in ratsSaudi Pharm J2042012365370
- A.AlhaiderH.KorashyA.SayedMetformin attenuates streptozotocin-induced diabetic nephropathy in rats through modulation of oxidative stress genes expressionChem Biol Interact19232011233242
- L.BordoneM.MottaF.PicardCorrection: Sirt1 regulates insulin secretion by repressing UCP2 in pancreatic ß cellsPLoSBiol492006e295
- G.BroskyJ.LogothetopoulosStreptozotocin diabetes in the mouse and guinea pigDiabetes81969606611
- G.BuckleyJ.CutlerJ.AlickSerum triglyceride: method of estimation and levels in normal humansCan Med Assoc J94171966886888
- C.BurantM.TreutelaarM.BuseDiabetes-induced functional and structural changes in insulin receptors from rat skeletal muscleJ Clin Invest771986260270
- C.CantoZ.Gerhart-HinesJ.FeigeAMPK regulates energy expenditure by modulating NADC metabolism and SIRT1 activityNature458200910561060
- R.CarmenaHigh risk of lipoprotein dysfunction in type 2 diabetes mellitusRev Esp Cardiol8Suppl. C20081824
- P.CatonN.NayuniJ.KieswichMetformin suppresses hepatic gluconeogenesis through induction of SIRT1 and GCN5J Endocrinolog205201097106
- Y.ChanBiostatistics 102: quantitative data – parametric & non-parametric testsSingapore Med J4482003391396
- F.ChenY.loannouQuantitation of DNA fragmentation in apoptosisOxford J Life Sci Nucl Acids Res2451996992993
- D.CibulaM.FantaJ.VrbikovaThe effect of combination therapy with metformin and combined oral contraceptives (COC) versus COC alone on insulin sensitivity, hyperandrogenaemia, SHBG and lipids in PCOS patientsHum Reprod202005180184
- R.De- FronzoM.Abdul-GhaniType 2 diabetes can be prevented with early pharmacological interventionDiabetes Care34Suppl. 22011S202S209
- J.DhahbiP.MoteG.FahyIdentification of potential caloric restriction mimetics by microarray profilingPhysiol Genomics2332005343350
- Diabetes Prevention Program Research GroupThe prevalence of retinopathy in impaired glucose tolerance and recent-onset diabetes in the Diabetes Prevention ProgramDiabet Med242007137144
- M.DonathP.HalbanDecreased b-cell mass in diabetes: significance, mechanisms and therapeutic implicationsDiabetologia472004581589
- J.DubuisC.DealR.TsagaroulisEffect of 14 days infusion of growth hormone and/ or insulin like growth factor-1 on the obesity of growing zuker ratsEndocrinology137199627992800
- K.H.EffatA.LailaA.HananM.ManalE.FatmaIs the effect of caloric restriction on type 2 diabetes mellitus in rats mediated via Sirtuin-1?Med J Cairo Univ8312015357365
- M.EmotoY.NishizawaK.MaekawaHomeostasis Model Assessment as a Clinical index of insulin resistance in type 2 diabetic patients treated with SulfonylureasDiabetes Care221999818822
- R.FlemingZ.HopkinsonA.WallaceOvarian function and metabolic factors in women with oligomenorrhea treated with metformin in a randomized double blind placebo-controlled trialJ ClinEndorinol Metab872002569574
- L.FryerA.Parbu-PatelD.CarlingThe anti-diabetic drugs rosiglitazone and metformin stimulate AMP-activated protein kinase through distinct signaling pathwaysJ Biol Chem27720022522625232
- Y.GalloisS.VolE.CacèsDistribution of fasting serum insulin measured by enzyme immunoassay in an unselected population of 4,032 individuals. Reference values according to age and sex. D.E.S.I.R. Study GroupDiabetes Metab2261996427431
- R.GoldbergM.TemprosaJ.OtvosLifestyle and metformin treatment favorably influence lipoprotein subfraction distribution in the diabetes prevention programJ Clin Endocrinol Metab98102013
- X.HouS.XuK.Maitland-ToolanSIRT1 regulates hepatocyte lipid metabolism through activating AMP-activated protein kinaseJ Biol Chem2832920082001520026 18
- R.HundalM.KrssakS.DufourMechanism by which metformin reduces glucose production in type 2diabetesDiabetes4200020632069
- T.KadowakiM.KasugaY.AkanumaDecreased autophosphorylation of the insulin receptor-kinase in streptozotocin-diabetic ratsJ Biol Chem25919841420814216
- N.KalupahanaK.ClaycombeN.Moustaid-Moussa(n-3) Fatty acids alleviate adipose tissue inflammation and insulin resistance: mechanistic insightsAdv Nutrvol22011304316
- Kenneth J.LivakThomas D.SchmittgenAnalysis of relative gene expression data using real-time quantitative PCR and the 22DDCTMethods252001402408
- S.KimM.EllmererVan.CittersPrimacy of hepatic insulin resistance in the development of the metabolic syndrome induced by an isocaloric moderate-fat diet in the dogDiabetes52200324532460
- M.KitadaS.KumeA.KeizoSirtuins as possible drug targets in type 2 diabetesCurr Drug Kanasaki Targets142013622636
- W.KnowlerE.Barrett-ConnorS.FowlerReduction in the incidence of type 2 diabetes with lifestyle intervention or metforminN Engl J Med3462002393403
- R.KraussLipids and lipoproteins in patients with type 2 diabetesDiabetes Care276200414961504
- N.KumarC.DeyMetformin enhances insulin signalling in insulin-dependent and -independent pathways in insulin resistant muscle cellsBr J Pharmacol1372002329336
- J.LeeM.SongB.ParkOverexpression of SIRT1 protects pancreatic β-cells against cytokine toxicity by suppressing the nuclear factor-κB signaling pathwayDiabetes5822009344351
- I.LeibigerP.BerggrenSirt1: a metabolic master switch that modulates lifespanNat Med12120063436
- R.MackenzieB.ElliottAkt/PKB activation and insulin signaling: a novel insulin signaling pathway in the treatment of type 2 diabetesDiabetes Metab Syndr Obes720145564
- E.MarkD.NicolasD.BronwynMetformin prevents the development of acute lipid-induced insulin resistance in the rat through altered hepatic signaling mechanismsDiabetes5312200432583266
- G.MithieuxL.GuignotJ.BordetIntrahepatic mechanisms underlying the effect of metformin in decreasing basal glucose production in rats fed a high-fat dietDiabetes512002139143
- Y.MiyazakiA.MahankaliM.MatsudaEffect of pioglitazone on abdominal fat distribution and insulin sensitivity in type 2 diabetic patientsJ Clin Endocrinol Metab87200227842791
- N.MusiM.HirshmanJ.NygrenMetformin increases AMP-activated protein kinase activity in skeletal muscle of subjects with type 2 diabetesDiabetes51200220742081
- S.PaulW.RobertD.KellyDetermination of high density lipoprotein- cholesterol in stored human plasmaJ Lipid Res211980
- G.PerrielloS.PampanelliP.Del SindacoEvidence of increased systemic glucose production and gluconeogenesis in an early stage of NIDDMDiabetes46199710101016
- M.PfafflA new mathematical model for relative quantification in real-time RT-PCRNucleic Acids Res292001e45
- J.RadziukC.BaileyN.WiernspergerMetformin and its liver targets in the treatment of type 2 diabetesCurr Drug Targets Immune Endocr Metabol Disord32003151169
- K.RautioJ.TapanainenA.RuokonenEffects of metformin and ethinyl estradiol-cyproterone acetate on lipid levels in obese and non-obese women with polycystic ovary syndromeEur J Endocrinol1522005269275
- C.RhodesType 2 diabetes–a matter of b-cell life and death?Science3072005380384
- B.RoginaS.HelfandSir2 mediates longevity in the fly through a pathway related to calorie restrictionProc Natl Acad Sci USA10120041599816003
- V.SamuelZ.LiuX.QuMechanism of hepatic insulin resistance in non-alcoholic fatty liver diseaseJ Biol Chem27920043234532353
- C.SebastiánF.KyleM.HaigisFrom Sirtuin biology to human diseases: an updateJ Biol Chem28720124244442452
- B.SuvarnaSirtuins: the future insightMed J38220127782
- S.TabishIs diabetes becoming the biggest epidemic of the twenty-first century?Int J Health Sci (Qassim)122007VVIII
- J.TakadaM.MachadoS.PeresNeonatal streptozotocin-induced diabetes mellitus: a model of insulin resistance associated with loss of adipose massMetabolism5672007977984
- P.TrinderEvaluation of Trinder glucose oxidase methodClinchem2112197517541760
- R.WangH.KimX.CuiyingHepatic Sirt1 deficiency in mice impairs mTorc2/Akt signaling and results in hyperglycemia, oxidative damage, and insulin resistanceJ Clin Invest12111201144774490
- D.WeiR.TaoY.ZhangFeedback regulation of hepatic gluconeogenesis through modulation of SHP/Nr0b2 gene expression by Sirt1 and FoxO1Am J Physiol Endocrinol Metab30022011E312E320
- H.YangX.JinL.KeiOxidative stress and diabetes mellitusClinChem, Lab Med.4911201117731782
- T.YoshizakiS.SchenkT.ImamuraSIRT1 inhibits inflammatory pathways in macrophages and modulates insulin sensitivityAm J Physiol Endocrinol Metab2982010E419E428
- G.ZhanguoY.JianpingBiochem Biophys Res Commun37642008793796