
 ?Mathematical formulae have been encoded as MathML and are displayed in this HTML version using MathJax in order to improve their display. Uncheck the box to turn MathJax off. This feature requires Javascript. Click on a formula to zoom.
Abstract
The mostly advanced polarographic mode of measurement, square wave (SW), was applied for studying reduction of for 2,2-Dimethyl-1,3-dioxan-4,6-dione (Meldrum acid) and its 5-phenyl-azo substituent in 40% v/v ethanolic universal buffer (pH~ 2–12). At more negative potentials, a 2e pH-dependent wave (dEp/dpH = 31 mv) was assigned to one carbonyl group, while at more positive potentials a 4e pH-dependent wave (dEp/dpH = 71 mv) was assigned to the azomethine group. Based on the polarographic data and acid-base pKa values were determined spectrophotometrically. The reduction mechanism pathway was suggested. The azomethine group proved to be in the azo form since the nitro group of the p-NO2 derivative is reduced at a more negative potential than the azomethine linkage. Fair Ep-σ correlation was obtained with positive p values (~0.2–0.3), indicating that the substituents facilitate the reduction process at the dropping electrode.
Keywords:
1 Introduction
The growing interest on the chemistry of β-diketones was early compiled in a book dealing with different chemistry aspects of this class of compounds [Citation1]. The considerable attention for these compounds lies, in view of its wide technical applications, particularly biochemical treatment of thrombosis [Citation2], as anti-inflammatory agents [Citation3] and miticidies [Citation4]. Certain 1,3-indandione derivatives have been used as effective rodenticides [Citation5]. In addition, these compounds are characterized by high conflicting tautomerizing structure. Early in 1908, Meldrum [Citation6] reported that the condensation of malonic acid with acetone anhydride yielded a crystalline while solid which assigned the structure of a monobasic acid, β-dimethyl- β-propiolactone-α-carboxylic acid. This structure proved to be quite wrong, although forty years had elapsed before it was deduced that the condensation must involve only the carbonyl groups of the malonic acid. On this basis Davidson and Bernhard [Citation7] correctly assigned the structure of Meldrum acid as 2,2-Dimethyl-1,3-dioxan-4,6-dione (I) whose properties therefore relate to those of other cyclic 1,3-diones such as dimedone barbituric acid, 1,3-indandione, etc. Although various organic synthesis routes were followed to prove the correct structure of Meldrum acid, physical investigations could emphasize further this view [Citation8,Citation9]. The present work was therefore undertaken with the following objectives:
| i. | Emphasizing the β-diketo nature of Meldrum acid by coupling it with diazonium salts. Noteworthy, β-diketones are known to be ready coupling at the CH2 group in position 2. Moreover, studying the competitive reactivities of the carbonyl and azomethine linkage in the presence of one another. | ||||
| ii. | To illustrate the nature of the possibly tautomeric forms according to the pH of the medium; also discrimination between the nature of the azomethine linkage: azo/hydrazone, via investigating substituent polarographic runs particularly that of the p-NO2. | ||||
| iii. | Testing the fidelity of linear free energy relationship (LFER) through Ep-σ correlations. | ||||
2 Experimental
2.1 Materials, reagents, solvents
The materials used in this investigation were either Analar grade chemicals (AR) used as supplied, whereas the chemically pure quality reagents were used after proper purification.
2.2 Organic syntheses
2,2-Dimethyl-1,3-dioxan-5-phenylazo-4,6-dione(Meldrum acid I) (Fig. 1) was prepared following the “modified Meldrum method” reported by Davidson and Bernhard [Citation7]. To a suspension of 52 g (0.5 mole) of powder Malonic acid in 60 ml (0.6 mole) of acetic acid, anhydride was added, while stirring, 1.5 ml of conc. Sulfuric acid. Largest of the malonic acid dissolved with spontaneous cool. To the resulting solution, 40 ml (0.55 mole) of acetone was added while cooling to maintain the temperature at 20–25 °C. The reaction mixture was allowed to stay overnight in the refrigerator and the resulting crystals filtered by suction and washed three times with sufficient ice water to cover the cake; yield of air-dried product: 35 g (49%). Recrystallization is conveniently effected without heating by dissolving 10 g of the product in 20 ml of acetone, filtering and addition 40 ml of water. The recovery is about 70%, m.p. 94–95 °C.
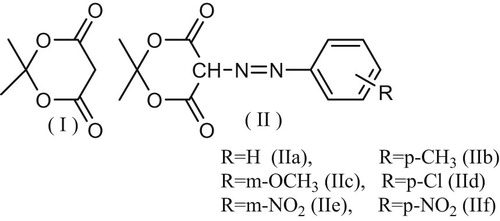
Compounds IIa–f (Fig. 1) were prepared by conventional coupling diazotized aniline or the corresponding aniline derivatives with Meldrum acid (I). Thus, aniline or the corresponding aromatic amine (20 mmol) was dissolved in 1 ml concentrated HCl and 5 ml of water cooled to 0 °C and then treated with a cold solution of 1.38 g NaNO2 in 5 ml water. The diazotized amine was then added step by step to an ice cold solution of 20 mmole of Meldrum acid (I) in alcohol, containing sodium acetate (pH 7–9 after coupling), where the corresponding coupling products separates. The reaction mixture was left overnight in a refrigerator, filtered and recrystallized from ethanol. Purity credit was checked by TLC and m.p. and was found concordant with those reported.
2.3 Polarographic square wave (SW) and cyclic voltammetric investigations
2.3.1 Apparatus
Square wave measurements were recorded with 693 VA processor and 694 VA stand with multimode electrode (MME) (METROHM-SWITZERLAND) product. This relatively up-to-date assembly allows:
| i. | Three types of mercury electrodes combined in a single unit: HMDE, DME and SMDE. | ||||
| ii. | Program-controlled, automatic switching and mixing of these three electrode configurations during a single analysis via a software commands. | ||||
| iii. | The complete electrode is pneumatically controlled. | ||||
2.4 Solution
Stock solution 10−3 M of the compound to be investigated was freshly prepared by dissolving an accurately weighed amount of material in the appropriate volume of pure ethanol. From this solution the required concentration was prepared by appropriate dilution. For the relatively less soluble compounds (IIe,f; p-& m-NO2), the least amount of DMF was used. The later does not exceed 0.4% (v/v) of the final solution. Britton-Robinson modified universal buffers [Citation8] (prepared from Analar grade products) were used as supporting electrolyte. The pH value of each buffer was measured using digital pH meter (Hanna, Italy, ± 0.01 pH unit).
2.5 Measurements
Ethanol and the appropriate buffer solution were introduced into the polarographic cell. The solution was deoxygenated by bubbling purified nitrogen gas at the rate of 2–3 bubbles for 10 minutes. The calculated volume of depolarizer was then introduced into the cell. Purified nitrogen gas was further passed for 2 minutes.
Peak Potential (Ep) and peak current (ip): These were read directly on the screen of the processor with ultimate accuracy. All values of Ep are expressed vs. Ag/AgCl electrode.
2.6 Spectrophotometric determination of the apparent dissociation constant
Spectrophotometric Measurement in the visible and UV ranges were carried out using processor NUICO 1200– UV/V. Spectrometer UV2.
For the determination of the acid dissociation constant of compound (I), (IIa–f), a fresh solution of the organic reagent 5 × 10⁻⁵M, in a 10 ml measuring flask with buffer solution (40% v/v ethanol), was prepared. The pH of the solution was determined and the spectrophotometric run was recorded at such pH within few minutes after measuring the pH. The procedure was carried out with buffer solution covering the pH ≈ 2–12. The pKa was then determined from the absorbance measured in different buffer solutions (at roughly increasing 0.5 pH unit) in equation Equation1(1)
(1) [Citation9]:
(1)
(1)
Where Amax is the absorbance of undissociated acid, A is the absorbance at different pH values and Amin is the absorbance of the completely dissociated acid; all being derived from the absorbance-pH relations. The intercept of pH vs. log [(Amax − A)/(A − Amin)] gives the pKa.
3 Results and discussion
3.1 Polarographic SQ reduction of (I) and (IIa–f)
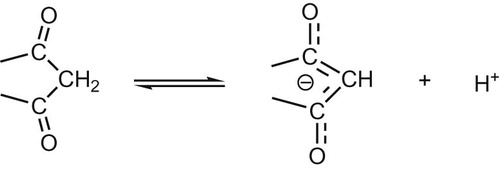
Well known documented polarographic behavior of β-dicarbonyl compounds reported no reduction waves for the carbonyl groups [Citation10]. This was renationalized since the negative charge of the anion spread over the carbonyl groups rendering it inactive as shown in Scheme 1.
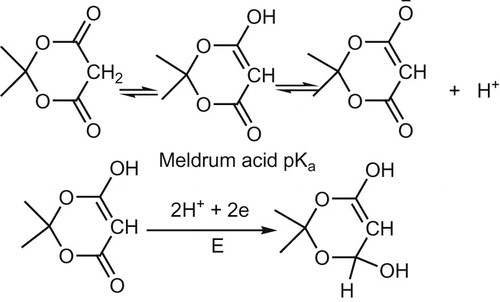
With Meldrum acid (I) which, nevertheless, a member of this class of compounds (β-dicarbonyl group), the results was in contrast to that previously stated. SW runs carried for 10−4M Meldrum acid (I) in 40% ethanolic buffer media in the whole pH range reflects well-defined 2e reduction wave. In contrast with DC measurements, peak potential showed pH dependence (dEp/dpH ~ 30mv). Peak potential as function of pH is described by equation Equation2(2)
(2) :
(2)
(2)
Such behavior is a mark difference which reflects the high precision of SW measurements over the DC polarography. Obviously the reduction sequence is (H+, e, H+, e) and not that (e, H+, e, H+) reported with DC mode of measurements.
The reduction pathway followed the pattern (Scheme 2).
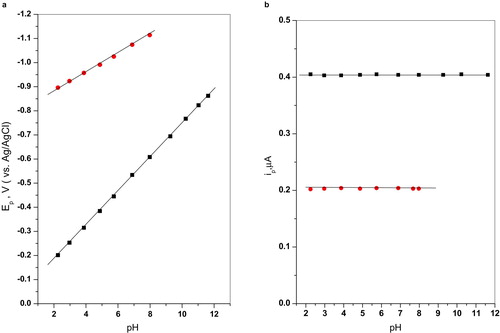
SW polarographic runs for 5 × 10⁻⁵ M of compounds IIa–f were carried in 40% v/v ethanolic Britton-Robinson buffers covering roughly the pH range 2–12 is schematically illustrated in Fig. 2. Results obtained with the parent compound IIa illustrating effect of pH on peak potential (Ep) and peak current (ip) are graphically shown in Fig. 3. Careful inspections of the polarograms reveal that this compound is reduced in the accessible pH range by two waves: the more positive wave (a) with practically twice peak current (ip) as that of the more negative wave (b). The more positive wave (a) was assigned to the azo group while the more negative wave (b) was assigned to the carbonyl group. This assignment is strongly sustained by the following evidences:
| i. | It is well known from literature [Citation11] that reduction of azo or hydrazone group occurs at much more positive potentials than the carbonyl group. | ||||
| ii. | Reduction of carbonyl group is less pH dependent and at higher pHs may be completely independent. | ||||
| iii. | Mostly reduction of azo linkage proceeds in 4e wave while that of the carbonyl is a 2e wave [Citation12]. | ||||
As disclosed from the plots, wave (a) remains a well-defined pH-dependent wave with approximately constant peak current (ip) in the whole pH range of study. Since Ep-pH is a straight line from the lowest to the highest pH, a fact which suggests that the reducible center described by this wave remains structurally the same all over the pH range of study. The shift in Ep with pH is described by equation Equation3(3)
(3) :
(3)
(3)
For wave (b), assigned to the carbonyl group Ep-pH showed clear dependence of peak potential on pH, although weak (dEp/dpH ~ 30mv/pH). The correlation is a well manifested straight line described by equation Equation4(4)
(4) :
(4)
(4)
This dependence strongly emphasizes the superiority of the high precision of SW measurements previously stating no dependence of E1/2-pH relation [Citation13].
Peak currents of both waves (a) and (b) are practically pH independent in the studied pH range as manifested graphically in Fig. 3b.
The diffusion nature of both waves (a) and (b) was tested from experiments carried for the effect of time (t) and concentration (C) on peak current (ip-t and ip-C dependence) for waves (a) and (b). The results showed that the peak current for both waves (a) and (b) remains practically constant even after as long as 90 min interval stay.
The ip-C relation for wave (b), well-defined straight line, yet shifted from the point of origin indicating, presumably some catalytic order.
3.2 Reversibility of the waves
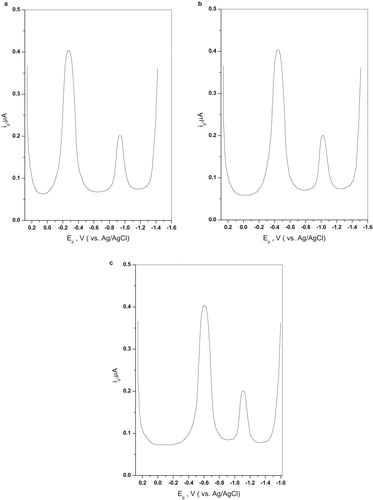
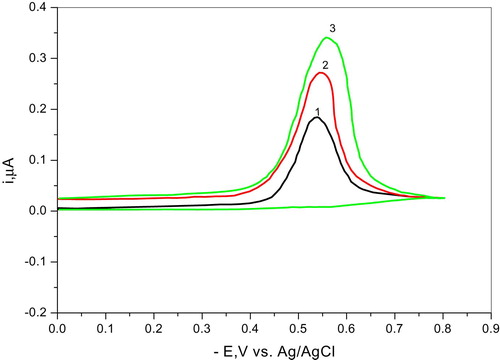
Although most polarographic waves associated with organic molecules are irreversible, ascertaining this point is of prime importance, particularly its need in discussing the mechanism of electrodic reduction. The mostly reliable cyclic voltammetric technique was adopted in this study. The irreversible nature was proven from cyclic voltammetric measurements at hanging mercury drop electrode (HMDE) at pH (pH ~ 5.3) and different scan rates ranging from 20 mv/s to 200 mv/s. The results are graphically shown in Fig. 4. As disclosed from the graphs in the three pH solutions only reduction wave in the forward direction is observed, while the reverse scan (oxidation) does not exhibit any sign of reactivity even at the lowest scan rate. Evidently, this is a firm proof for the irreversible nature of the electrodic reduction; even the electro chemical mechanism (EC) could not be assumed.
3.3 Determination of the number of electrons of the polarographic wave
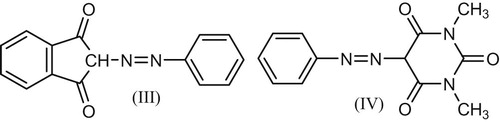
Methods reported for determination of the number of electrons of a polarographic wave includes controlled potential electrolysis (cpe), controlled potential coulometry (cpc) and comparison of wave height or peak current with previously reported compounds with known determined number of electrons. The last method is followed in the present study. Two compounds (III, IV) (Fig. 5) were selected: 2-phenylazo-indandione (III) [Citation12] and 5-phenylazo-1,3-dimethyl barbituric acid (IV) [Citation13].
SW wave measurements were carried for both compounds and the parent compound IIa under the same experimental conditions (depolarizer concentration, analyte composition and other measuring variables) at pH 3.07 and pH 6.42. In both cases registered peak potential was fairly concordant with that of wave a for the parent compound IIa. Consequently, wave (a) assigned for the azo group in IIa is reduced at the mercury electrode by 4e process; also wave (b) assigned for the carbonyl group is reduced by 2e, since its ip is half that of wave (a).
3.4 Effect of substituent on the reduction wave
The effect of substituent at the phenyl ring attached to the azo linkage was polarographically investigated. This was intended to demonstrate the effect of electron donating group (p-CH3, m-OCH3) and electron withdrawing group (m-NO2, p-NO2) on:
| i. | The ease of the electrodic process. | ||||
| ii. | The acid-base equilibrium. | ||||
| iii. | The actual tautomeric form of the azomethine linkage whether in the azo form CH–N = N–Ar or the hydrazone form C = N–NH–Ar. | ||||
Generally, the SW wave polarographic runs of compounds IIb–d (p-CH3, m-OCH3 and p-Cl) were identical in shape with that of the parent compound IIa.
Equations describing Ep-pH relation for all compounds were calculated from the respective Ep-pH plots for waves (a) and (b) are summarized in . The very small differences in ip values of the substituent as compared to those of the parent are most probably due to differences in the molecular dimension, diffusion coefficients and orientation of these molecules at the surface of the electrode [Citation14].
Table 1 Equations of peak potentials of pH for compounds I, IIa–f.
In addition to the polarographic reduction waves of IIa the m-NO2 (IIe) and p-NO2 (IIf) displayed additional wave (wave c) corresponding to reduction of their nitro group. Plots of Ep vs. pH for waves (a), (b) and (c) of the p-NO2 derivative is given in Fig. 6. Careful inspection of the results show that the more negative wave (c) for the p-NO2 substituent corresponding to 6 e, as the wave height ratio of wave (c) to that of (a) is 3:2, since the NO2 group is known to be reduced along 6 e, through dehydration of hydroxyl amine to the corresponding quinenoid structure [Citation15,Citation16]. Thus it is fair to assign the more negative 6 e wave (c) to reduction of the p-NO2 group and the more positive one (a) to the azomethine linkage.

3.5 Spectrophotometric acid dissociation constant pKa
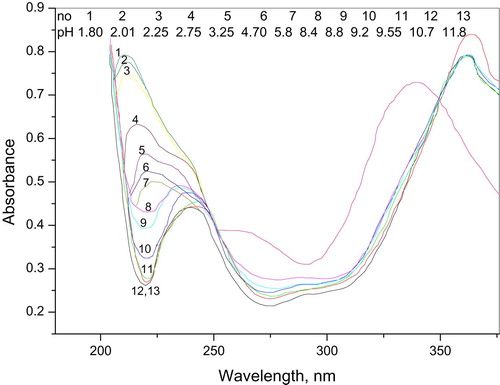
The spectrophotometric runs of 5 × 10⁻⁵ (IIa) in 20% ethanolic Britton Robinson buffers at roughly increasing 0.5 pH unit are illustrated in Fig. 7. The spectra are characterized by well-defined maxima at λ225 nm and two ill-defined maxima at λ360 nm and two isobestic points at 250 nm and 350 nm. These points cover all the pH range indicating the presence of equilibrium between the acid form and its conjugate base as the only equilibrium existing in such solutions. At each maximum (Amax), the absorption remains constant with pH increase up to a definite pH solution where it starts to decrease significantly to a minimum (Amin) at which the absorbance retains its constancy with solution pH increase. This functioning of absorbance-solution pH allows the determination of the acid-base equilibrium (Ka hence pKa); the method used for this calculation depends on the use of equation Equation1(1)
(1) [Citation9]. Plot of absorbance vs. pH is given in Fig. 8a and the respective log [(Amax − A) / (A − Amin)] vs. pH in Fig. 8b.
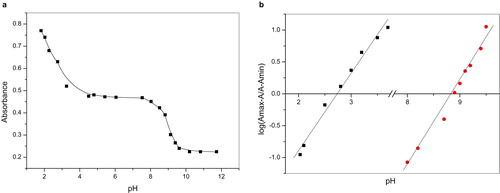
Obviously, the compound displayed two acid dissociation constant (pKa1 ~3, pKa2 ~8).
Spectrophotometric runs were carried for the rest series (compounds IIb–f). The obtained pKa1 and pKa2 values were not significantly different than the parent compound IIa.
3.6 Acid-base equilibrium and mechanism of electroreduction for compounds IIa–f
The acid-base equilibrium of Meldrum acid revealed a relatively high pKa value (pKa ≈ 2.93). Contrary to the well-known fact for the polarographic in activity of β-diketones, Meldrum acid (a member of this class of compounds) showed well-defined 2 electron pH-dependent wave (dEp/dpH = 0.038 v/pH) c.f. scheme 2. This dependence for the wave on pH registered by the present experimental measurements using SW mode is in contrast previous results with DC measurements where no dependence of E1/2 on pH.
The spectrophotometric acid base equilibrium for compounds IIa–f revealed two acid dissociation constants: pKa1~3and pKa2~8. The irreversible diffusion controlled nature of the polarographic reduction waves was ascertained from results obtained from cyclic voltammetry, ip-c and i-t experiments. The azomethine linkage of these compounds is in the azo–form (CH–N = N) and not the tautomeric hydrazone form (C = N–NH). This statement is evidenced from the results obtained with the p-NO2 substituent (IIf) where reduction of the nitro group along 6 e wave (wave c) is at more negative potential than that of the 4e reduction wave of the azomethine linkage (c.f. results). The importance of the nitro group for discrimination between an azo or hydrazone tautomeric structure of the azomethine linkage lies in the fact that literature survey of azo compounds containing a nitro substituent at any location of the molecule revealed that an azo (CH–N = N) linkage is always reduced before the nitro group [Citation17,Citation18], while if the linkage has a hydrazone form (C = N–NH), the opposite behavior occurs [Citation19,Citation20]. Taking in consideration the above results and discussions, the following Scheme 3 and 4 are thought to illustrate the most possible acid-base equilibrium and the electroreduction mechanistic pathway for compounds IIa–f.
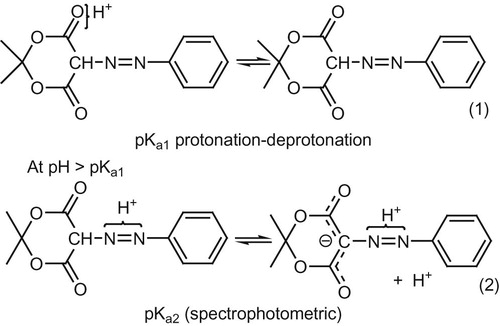
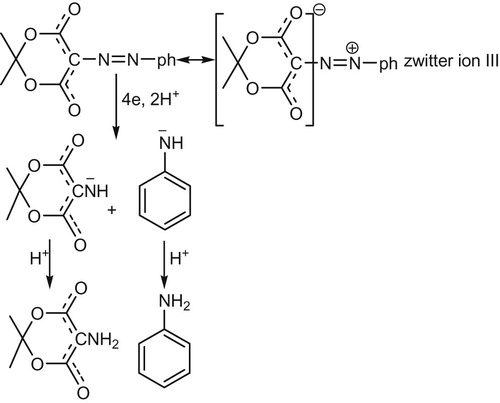
The assumption that a negatively charged ion is the diffusing reducible species at the cathode, although theoretically possible, is the least likely. In order to rationalize the high diffusion rate of IIa which enable it to compete effectively with charged species at pH > pKa1 it seemed to us most likely that these compound are best represented as the zwitter ion III, similar to those previously reported to for 4-phenyl azo-1-naphtal [Citation21] and α-arylhydrazononitrile [Citation19] accordingly, scheme 3 is proposed to illustrate the reduction sequence in such pH media.
The acid-base equilibrium and reduction mechanistic pathway for the coupling azomethine compound IIa is demonstrated in scheme 4. According to this proposed scheme, the azomethine linkage reduction sequence is cleavage followed by saturation. Earlier reports with DC measurements do not discriminate whether reduction-cleavage is followed by saturation or saturation of the azomethine linkage is followed by cleavage. Obviously, the present results refer that the first view (reduction followed by saturation) is that followed in the mechanistic pathway and not the second (saturation of the azomethine linkage followed by cleavage). Since if the second view is the case a separate wave for the saturated intermediate hydrazo compound (CH–NH–NH) which is not the case. This is because the high sensitivity and accuracy of SW mode of measurement can detect efficiently subsequent waves separating by less than 20 mv.
3.7 Structure–energy relationship for compounds IIa–f
Further insight into the mechanism was tried through Hammett's σ values and pKa and peak potential Ep at different pH values. Plots of Ep-σ are illustrated in Fig. 9 which reflects reasonable linearity with + p values 0.26, 0.30, 0.31. Statistical treatment of the data was carried out; the r and s values are fairly correlated with σ constants which is an indication that the substituents can affect the reaction center by their inductive effects.
pH 4 ■; pH 6 ●; pH 8 ▲.
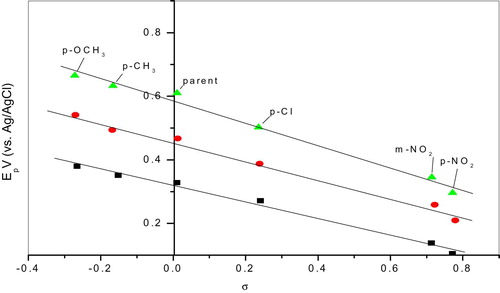
For pKa-σ correlation, since values of pKa1 and pKa2 are not significantly different, such correlation couldn't be expected and thus omitted.
4 Conclusion
The high accuracy of SW mode of measurement compared to classical DC polarography. The azomethine linkage of compounds IIa–f is in the azo form and not the tautomeric hydrazone form as evidenced from the result obtained with the p-NO2 substituent (IIf). LFER has been realized for Ep-σ correlation and failed with pKa-σ.
References
- J.StradinsStructure and tautomeric transformations of β-dicarbonyl compounds Zinat. Akad. Vestis,Riga, U.S.S.R.1977
- H.KabatE.F.StohlmanM.I.SmithHypoprothrombinemia induced by administration of indandione derivativesJ Pharmacol801944160170
- S.RosiniL.TralloriS.SilvestriPharmacological study of a series of indandione derivatives proposed as anti-inflammatory agentsFarmaco [Sci]3151976315321
- J.A.DurdenA.A.SousaSubstituted phenylindanediones as miticides U.S. Pat.1976 3:954-998; C. A. 1976;85:79467X
- J.P.FreemenA synthesis of cyclopropyl acetatesJ Org Chem296196413791382
- A.N.MeldrumA β-lactonic acid from acetone and malonic acidJ Chem Soc931908598601
- D.DavidsonS.A.BernhardThe structure of Meldrum's supposed β-lactonic acidJ Am Chem Soc70194834263428
- H.T.S.BrittonHydrogen ions1955Chapman and Hall365
- M.S.MasoudA.M.KaddahA.M.KhalilN.I.TawfikPotentiometric and Spectroscopic studies on B-diketone aryl azo compoundsInd J Chem17A1979502504
- J.StradinsI.TutaneG.VanagasPolarography Interscince, New York1964731
- G.NisliD.BarnesP.ZumanPolarographic reduction of aldehydes and ketones. Part XI. Acid-base equilibria accompanying electrolysis of 1-phenylbutane-1,3-dioneJ Chem SocB1970771777
- M.A.MorsiA.M.A.HelmyH.M.FahmyPolarographic and spectrophotometric behaviour of substituted 1,3-indandione: part I. 2-phenylazo-1,3-indandioneJ Electroanal Chem1481983123131
- M.A.MorsiA.M.A.HelmyM.A.MigahedElectrochemical behaviour of some pyrimidine derivatives: polarographic reduction of 1,3-dimethyl-2,4,6(1H,3H,5H)pyrimidinetrione and its substituted 5-phenylazo derivativeJ Electroanal Chem3881995109114
- P.ZumanSubstituent effects in organic polarographic1967Plenum Press.New York211
- D.StočesováPolarographic reduction of aromatic nitrocompoundsCollect Czech Chem Commun141949615625
- J.PearsonThe reduction of nitrocompounds at the dropping-mercury cathodeTrans Faraday Soc441948683967
- W.U.MalikP.N.GuptaPolarographic reduction of solochrome mordant dyesJ Electroanal Chem541974417426
- J.L.SadlerA.J.BardElectrochemical reduction of aromatic azo compoundsJ Am Chem Soc908196819791989
- M.H.ElnagdiH.M.FahmyEffect of substituents on the polarographic behaviour of α-arylhydrazononitriles: further evidence for the mechanism of polarographic reduction of α-arylhydrazononitrilesJ Electroanal Chem841977149157
- H.M.FahmyM.H.ElnagdiPolarographic behaviour of some α-phenylhydrazono-β-ketonitrilesElectrochim Acta231978255260
- S.MillefiariPolarographic reduction of azo compounds II 4-phenylazo-2-naphtholsAnn Chim (Rome)591969138154