
 ?Mathematical formulae have been encoded as MathML and are displayed in this HTML version using MathJax in order to improve their display. Uncheck the box to turn MathJax off. This feature requires Javascript. Click on a formula to zoom.
Abstract
Manganese oxide-coated sand, MOCS, was synthesized and characterized by XRD, FTIR, SEM, and EDX techniques, and was used for the adsorption of Pb(II) and Zn(II) from their aqueous solutions. The metal ion concentration, contact time, MOCS dose and pH of the solutions were optimized. Langmuir, Freundlich, Temkin and Dubinin–Radushkevich isotherms were studied and the maximum adsorption capacities for Pb(II) and Zn(II) were found to be 147.06 and 116.28 µg/g at 40 °C and 27 °C, respectively. These values are higher than many tested adsorbents. The energy 0.011 and 0.079 kJ/mol for Pb(II) and Zn(II) indicated adsorption as physical process. In thermodynamics the free energy change for Pb(II) ranged between −12.344 and −11.371 kJ/mol and that for Zn(II) ranged −9.638 to −11.155 kJ/mol between 27 and 40 °C that predicted the spontaneity of process. The enthalpy change −39.816 and 25.574 kJ/mol indicated the exothermic and endothermic nature of the adsorption of Pb(II) and Zn(II). Kinetic studies indicated that Pb(II) adsorption followed pseudo-second order, whereas Zn(II) followed partial pseudo-first and pseudo-second order rates. The adsorptions of both metals were controlled by film diffusion step.
1 Introduction
The extensive industrial growth during the last century has resulted into environmental pollution including water contamination. Waste water discharge from industries such as textiles, paper manufacturing, plastics, leather, food, antiseptics and dyes to water reservoirs has severely damaged water quality [Citation1]. Heavy metals are horrible non-biodegradable water pollutants which are toxic and affect human being greatly. Lead and zinc are two important heavy metals that are well-known toxics, used in metallurgy, tannery manufacturing, paper and pulp industries, metal products, paints and varnishes, battery manufacturing industries, galvanizing plants, etc. [Citation2]. Lead exists as Pb(II) in water that enters into food chains and accumulates in soft tissues of the body. It is a known metabolic poison and enzyme inhibitor that accumulates in bones, brain, kidney and muscles and causes a variety of health problems such as anemia, nervous system deterioration, reduction in fertility both in men and women, failure of kidneys, Alzheimer's disease and bone problems [Citation3]. Zinc is non-biodegradable and travels through the food chain via bioaccumulation and becomes harmful. Its unwanted ingestion for longer periods causes anemia, pancreatic damage, protein metabolism disturbance, arteriosclerosis and respiratory disorders. Zinc exposure can be dangerous to unborn and newly born babies through blood or milk of their mothers [Citation4]. Due to the toxicities associated with these ions WHO has recommended maximum permissible limit of Pb(II) and Zn(II) in drinking water as 0.01 and 5.0 mg/L [Citation5,Citation6]. Owing to the large industrial applications and toxicity associated with Pb(II) and Zn(II), these two ions were selected for the removal studies from water. Various treatment techniques are available, including reduction and precipitation [Citation7], coagulation–flocculation [Citation8], electro-coagulation [Citation9], adsorption [Citation10], ion-exchange [Citation11], reverse osmosis [Citation12], electrodialysis [Citation13], and membrane and ultra membrane filtration [Citation14]. These techniques are usually expensive and, sometimes, ineffective when the concentration of metals is high [Citation15]. Adsorption is universally accepted and the most widely used method of water treatment as it involves the least sophisticated instrumentation with easy operations and can be operated with a wide range of adsorbents [Citation16]. The simple design, nontoxic, eco-friendly, low cost adsorbents, treatment cost and mild conditions are criteria for selection of best mode and adsorbent [Citation17]. Researchers have developed various organic and inorganic adsorbents for the removal of Pb(II) and Zn(II) ions from aqueous solutions. Commercially available activated carbon has been studied, but it is expensive and not suitable at the industrial level. Therefore, the research is going on to find alternatives of activated carbon. The oxides and hydroxides of transition elements have been used as adsorbents owing to their good surface areas and affinity toward several heavy metals [Citation18]. These oxides may exist in colloidal form or in nonmaterial form in aqueous solution giving large surface areas for adsorption [Citation19]. Separation of adsorbents from water is a tedious job and requires costly sophisticated instruments; therefore, this situation has led to a growing interest in the application of metal oxide-coated adsorbents [Citation16]. Large numbers of absorbents have been prepared by coating metal oxides on sand grains. The prominent include iron oxide-coated sand [Citation20], aluminum oxide-coated sand, etc. [Citation21]. Metal oxide-based adsorbents with distinguished properties, including a high number of reactive sites, metal attractive behavior and high surface area, were the choice for the removal of Pb(II) and Zn(II) ions. MnO2, as a unique adsorbent, is an acidic oxide having negative surface charge in the normal pH range of water that can attract positively charged heavy metal ions [Citation22]. To have benefit of high surface area, negative surface charge, it was decided to use it for the adsorption of Pb(II) and Zn(II) ions from their respective solutions. Manganese oxide has been coated on bentonite [Citation23], resins [Citation24], granular activated carbon [Citation25], zeolite [Citation26] and carbon nanotubes [Citation27] to prepare adsorbents that have been exploited for pollutant removal. Li et al. [Citation28] prepared and used manganese oxide coated graphene oxide for the defluoridation of water. Dang et al. [Citation29] coated silica with amorphous manganese oxide and used as an efficient catalyst for degradation of organic pollutant. Abdel Salam [Citation30] used multi-walled carbon nanotubes/manganese oxide nanocomposite (MWCNTs/MnO2) for the removal of Pb(II) from aqueous solution. Manganese oxide is a versatile, low cost adsorbent that was coated on an inexpensive support, sand. Only few papers are available where manganese oxide has been coated on cheap source and used for the adsorption of Pb(II) or Zn(II). Even if few papers are available, these studies have some drawbacks, like high contact time, high dosage, low adsorption capacity and incapability to work under natural water conditions [Citation31]. No detailed mechanism had been given anywhere in literature. Therefore, in the present paper efforts were made to coat manganese oxide onto river sand for the preparation of an adsorbent for the removal Pb(II) and Zn(II) from aqueous solution. Detailed mechanism, isotherm and thermodynamic studies had been discussed herein.
2 Experimental
2.1 Materials and methods
A.R. grade Pb(NO3)2, Zn(NO3)2⋅4H2O, MnCl2, KMnO4, Cetyltrimethylammonium bromide (CTAB), Cetylpyridinium chloride (CPC), dithizone and Xylenol orange (XO) were purchased from Merck India (New Delhi). The pH meter (Model APX 175 E/C) by Control Dynamics Instrumentation Pvt. Ltd. (Bangalore, India) was used to measure pH of the solution. XRD diffraction of adsorbent was recorded on Philips PW-3710 Diffractometer using Cu-Kα radiation (λ = 1.54 Å) fitted with Cu filter, at a generator voltage of 35 kV and 30 mA current, and a counter detector. FESEM (Nova NanoSEM 450, FE1) equipped with EDX (Bruker 127 eV) was used to study the surface texture and elemental compositions. FT-IR spectrum was recorded on VERTEX 70/70v spectrophotometer (BRUKER). UV/Vis. spectrophotometer (model T80-UV/VIS) (PG Instruments Ltd., Leicestershire, England) was used for detecting lead and zinc ions in solution.
2.2 Preparation of MOCS
Manganese oxide was coated on the sand by following procedure reported in the literature [Citation32,Citation33]. Sand was collected from local river Yamuna which was sieved to get different size grains. The sand particles of size 106–125 µm was treated with H2O2 and HNO3 to remove any organic material and surface deposited oxide. Fifty grams of this sand was added to 250 mL of 0.05 M MnCl2 solution in a 500 mL beaker. The mixture was constantly stirred on magnetic stirrer at 60–70 °C and 0.1 N NaOH solution was added drop wise to keep pH at 9.0. Then, 200 mL of 0.05 M KMnO4 solution was added drop wise into the suspension while keeping vigorously stirred. The solution turned to dark brown upon addition of KMnO4 solution, indicating the formation of MnO2 according to the reaction:
The resulting MnO2 was to be deposited on the surface of sand grain. This mixture was continued under stirring for 24 h and then aged for 10 h. The coated sand was filtered, dried at room temperature and kept at 160 °C in a furnace for 5 h. It was subsequently cooled to room temperature, washed to remove loosely attached oxide and finally dried at 105 °C. This sand was called manganese oxide-coated sand, MOCS, and was kept in polypropylene bottles and used as adsorbent.
2.3 Preparation of Pb(II) and Zn(II) solutions
Of the stock solutions of Pb(II) and Zn(II), 100 ppm stock solutions of Pb(II) and Zn(II) were prepared by dissolving 0.1598 g Pb(NO3)2 and 0.3998 g of Zn(NO3)2⋅4H2O in one litre double distilled water. The different solutions of concentration 200–1000 µg/L were prepared from these stock solutions by diluting with double distilled water.
2.4 Determination of lead and zinc
The spectrophotometric method was used for the detection of lead in the solution by forming complex with dithizone in the presence of cationic micelles, CTAB [Citation34]. Of the dithizone solution, 5.0 mL was added to 100 mL neutral 1000 µg/L solution of Pb(II) in 250 mL flask. Then 2.0 mL of 0.1 M HCl was added to this mixture followed by the addition of 5.0 mL of 0.3 M CTAB. The violet-chelate complex was formed which absorbed at 500 nm and was measured against a blank. Similarly, 10 mL XO solution was added to 100 mL neutral 1000 µg/L solution of Zn(II) in 250 mL flask and then 5.0 mL of CPC was added at pH 6.0 [Citation35]. The colored Zn(II) solution absorbed at 580 nm. Concentrations of both metal ions in the solution were calculated by plotting a calibration curve using Microsoft Excel sheet. Absorbance for 100, 200, …, 1000 µg/L concentrations of both solutions were noted down at λmax and calibration curves were drawn, and then from straight line equation unknown concentration was calculated.
2.5 Batch adsorption studies
Batch experiments were carried out using a series of Erlenmeyer flasks of capacity 50 mL covered with Teflon sheet to prevent any foreign particle contamination or removal of metal solution from the flask during shaking. Each experiment was conducted twice, and the data given herein were the average values. The effects of metal concentration, dosage of adsorbent, temperature, contact time and pH on adsorption were studied by varying one variable while keeping all other parameters fixed. Isotherm experiments were performed by taking different concentrations of Pb(II) and Zn(II) and optimum dosage of adsorbent, contact time, fixed pH and at the desired temperature. For kinetic experiments the optimum dosage of adsorbent, contact time, and pH concentrations of Pb(II) and Zn(II) were allowed to react for fixed interval of time. After the completion of a particular experiment, solutions were centrifuged and concentrations of left out Pb(II) and Zn(II) were determined in supernatant using UV–Vis spectrophotometer. The metal uptake and percentage removal were calculated using relationships:(1)
(1)
(2)
(2) where Co and Ce are the initial and equilibrium concentrations of Pb(II) and Zn(II) in µg/L.
is the amount of Pb(II) and Zn(II) adsorbed onto unit mass of adsorbent in µg/g. V is volume of the sample in mL and m is weight of MOCS in g/L.
3 Results and discussion
3.1 Characterization of adsorbent
The prepared MOCS was characterized by X-ray diffraction (XRD), Fourier transform infrared spectroscopy (FT-IR), scanning electron microscopy (SEM) and energy-dispersive X-ray spectroscopy (EDX) techniques, and the point of zero charge of MOCS was determined.
3.1.1 FT-IR and XRD studies
The spectral analysis was carried out to study the change of surface of sand on coating with manganese oxide. FT-IR spectra for uncoated and coated sands, recorded in the range 4000–400 cm−1, are shown in Fig. 1A and 1B. The uncoated sand showed peaks at 460 and 525 due to Si–O–Si rocking, and peak at 780 cm−1 might be due to Si–O–Si asymmetric bending vibrations within the SiO4 tetrahedra of silica sand [Citation36,Citation37]. The broad band at 1085 and a shoulder at 1180 cm−1 were assigned to asymmetric Si–O–Si stretching vibrations. IR signals at 1680 and around 3280–3520 cm−1 were for bending and stretching vibrations, respectively, of water molecule attached to the surface of sand [Citation38]. The shoulder that appeared around 3680 to 3870 cm−1 was due to Si–OH stretching caused by the interaction between Si–OH groups due to hydrogen bonding located at the surface of sand [Citation39].
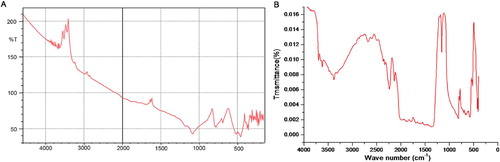
FT-IR spectrum of the MOCS (Fig. 1B) showed peaks around 380, 460, 540, 570, 632, 800, 1064, 1160, 1375, 1629, 2135, 2240, 2350, 2680, 3340, 3630 and 3700 cm−1. Absorption peaks observed at 380 and 460 cm−1 might be due to the characteristic bending and stretching of O–Mn–O bond, and the strong and sharp peak at 570 cm−1 in the spectrum was due to the Mn–O vibrational modes of MnO6-octahedra chain in MnO2 on the surface of sand. The peaks around 800 and 1064 cm−1 might have appeared due to Si–O–Si asymmetric bending and stretching vibrations within the SiO4 tetrahedra after coating of sand with MnO2 [Citation40]. An absorption peak at 1160 cm−1 was related to Mn–OH functional group [Citation41]. IR signals at 1629 and around 3330–3630 cm−1 were for bending and stretching vibrations of O–H of water [Citation42]. The peak at 2350 cm−1 is a combinational band that was due to bending and vibrational modes of H–O–H. Peaks at 2135, 2240, 2680, and 3700 cm−1 might be due to O–H bending and stretching vibrations of water bound on the manganese oxide structure [Citation43].
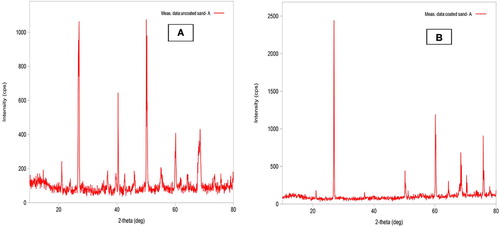
Powder X-ray diffraction patterns of native sand (Fig. 2A) showed peaks at 27.01 with d spacing = 3.30, 40.42 (d = 2.29), 50.10 (d = 1.82), 50.29 (d = 1.82), 55.19 (d = 1.66), 60.14 (d = 1.54), 67.74 (d = 1.38) and 68.61° (d = 1.37) (2θ). The peak at 50.10° (2θ) was major having the highest intensity (963 a.u.), and when the angular data were compared with XRD data of Indian standard sand, the test sand turned out to be quartz with some impurities [Citation44]. The XRD pattern of MOCS showed peaks at 13.6 (d = 6.5), 26.92 (d = 3.31), 50.19 (d = 1.82), 55.15 (d = 1.65), 60.15 (d = 1.537), 64.42 (d = 1.45), 68.46 (d = 1.37), 70.34 (d = 1.34) and 75.81° (d = 1.26) (Fig. 2B). Three peaks observed at 13.6, 26.92 and 68.46° (2θ) in the MOCS correspond to δ-MnO2 with significant deviations due to Mn–O and Si–O interactions. These peaks revealed that manganese oxide formed at the surface of sand was δ-MnO2 polymorph. Although the relative intensities were slightly different because of bonding with sand surface, the δ-MnO2 structure was intact, indicating that all of the oxide material deposited on sand grain had similar crystal structure; moreover, the strong XRD peaks indicated the well crystallized structure of MnO2 [Citation45].
3.1.2 SEM and EDX analysis
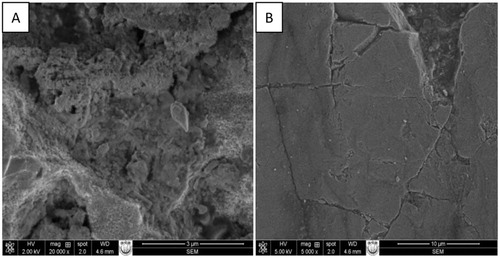
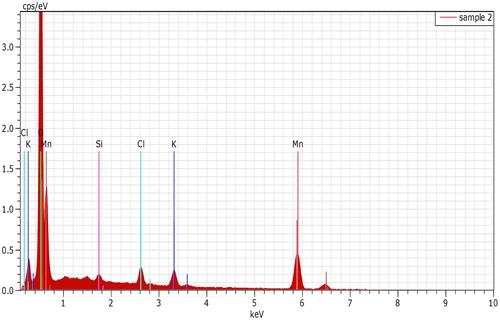
SEM image (Fig. 3A) of native sand at 20,000 magnifications showed rough texture with some pores. The images at 5000 magnifications (Fig. 3B) showed that sand grains after coating had become smooth and the surface had been covered by oxide of manganese. EDX graph showed the elemental composition of MOCS, with 53.05% Mn, 49.98% O, 0.57% Si, 1.67% Cl and 3.21% K (Fig. 4). The percentage of Mn and O suggested the presence of MnO2 on sand surface. Insignificant Si percentage suggested that the surface had been covered to the good extent. The presence of traces of Cl and K was due to trapping of these ions in the layered crystals of δ-MnO2.
3.2 Adsorption studies
3.2.1 Effect of adsorbent dose
The optimization of dosage of MOCS required for 500 µg/L concentrations of Pb(II) and Zn(II) was carried at room temperature in the range 2.0–12 g/L. The solutions of both metal ions at pH 6.0 were agitated for 90 min. The adsorption of Pb(II) increased from 37.77 to 83.33% when the amount of MOCS was increased from 2.0 to 8.0 g/L, and became almost constant after this dose, whereas adsorption of Zn(II) increased from 12.14 to 88.93% when MOCS amount was raised from 2.0 to 8.0 g/L and became nearly constant after 8.0 g/L. Therefore, 8.0 g/L amount of MOCS was an optimum dose for 500 µg/L concentration of Pb(II) and Zn(II) solutions. The increase in adsorption with the increase in the amount of MOCS was attributed to the number of binding sites available for both Pb(II) and Zn(II) ions [Citation46]. Higher adsorption of Zn(II) in comparison to Pb(II) might be due to difference in size and electro-negativities [Citation47].
3.2.2 Effect of initial concentration
Concentration of Pb(II) and Zn(II) solutions was optimized by using optimum dosage of MOCS in the concentration range 200–1000 µg/L. The pH of both solutions was fixed at 6.0, and the contents were agitated for 90 min at room temperature. The adsorption efficiency of MOCS highly depended on the initial concentrations of metal ions in the solutions. The adsorption of Pb(II) decreased from 95.0 to 78.57% when its concentration was increased from 200 to 700 µg/L and became almost constant. Therefore, 700 µg/L was an optimum concentration of Pb(II) solution for 8.0 g/L dose of MOCS. For the same concentration range the adsorption of Zn(II) decreased from 96.42 to 87.50% and became almost constant at 800 µg/L. Further decrease in adsorption with the increased amount of MOCS was not significant. Therefore, 800 µg/L was an optimum concentration of Zn(II) for 8.0 g/L dose of MOCS. The decrease in percentage adsorption of both Pb(II) and Zn(II) ions from their solutions was due to saturation of binding sites at particular concentration, and further added metal ions remained in the solution which caused lower percentage adsorption [Citation48].
3.2.3 Effect of contact time
Contact time, which determines the suitability of adsorption system, was optimized for the maximum removal of Pb(II) and Zn(II) at 800 µg/L concentrations, 8.0 g/L dose of MOCS, pH 6.0 and at room temperature. Pb(II) and Zn(II) solutions were agitated for contact time range 15–150 min. Adsorption of Pb(II) increased from 22.20 to 77.80% and that of Zn(II) increased from 24.55 to 87.05% when contact time was raised from 15 to 90 min. On further raising the contact time up to 150 min the adsorption increased, but was slow; therefore, 90 min was considered as optimum time for both metals. The adsorption process consisted of two phases, i.e. initial phase with rapid adsorption that involved 90 min time and the second phase started after 90 min, and there was no remarkable increase in the adsorption on augmenting the contact time up to 150 min. The first phase was instantaneous external surface adsorption, while in the second phase the pores on the surface of adsorbent were filled and the rate became slower and reached a plateau [Citation49].
3.2.4 Effect of pH
The pH of water determines the applicability of adsorption system on real situation. The pH of Pb(II) and Zn(II) solutions was fixed by adding 1 M HCl and NaOH as per requirement using pH meter. The pH effect on the adsorption of Pb(II) and Zn(II) was investigated with optimized experimental parameter at room temperature by varying pH in the range 2.0–12. The adsorption of Pb(II) increased from 31.43 to 88.57% when the pH value of the solution was raised from 2.0 to 12. But adsorption equilibrium was attained around pH 6.0 with 82.86% removal. Similarly, adsorption of Zn(II) increased from 69.20% to 87.50% when the pH value was changed from 2.0 to 7.0 and increased further to 95.09% at pH 12. The pH dependent adsorption behavior might be explained by considering the protonation of active sites on the surface of MOCS. At lower pH, MOCS surface was highly protonated; therefore, adsorption sites became positively charged. At lower pH there might have been competition between H+ and the Pb(II) and Zn(II) for binding sites which decreased the metal adsorption, whereas at higher pH the MOCS surface becomes negatively charged due to deprotonation caused by the presence of excessive OH− ions in the solution. At higher pH the electrostatic interaction between negatively charged MOCS surface and positively charged Pb(II) and Zn(II) ions might had increased which promoted adsorption. Moreover, the pHzpc of MOCS was found at pH 6.35 and the electrostatic interactions between MOCS surface and positively charged metal ions were less at lower pH, which increased at higher pH [Citation50]. Precipitation of the Pb(II) as [Pb(OH)]+ and Pb(OH)2, and Zn(II) as Zn(OH)+, Zn(OH)2 and Zn(OH)3 – at pH greater than 6.0 and could have resulted into increased adsorption [Citation51]. Therefore, for elimination of precipitation effect, and for considering the only adsorption efficiency, pH of Pb(II) and Zn(II) solutions were kept lower than the critical pH of hydroxide precipitation. Therefore, pH 6.0 was optimum pH for both Pb(II) and Zn(II) ions.
3.2.5 Effect of temperature
Temperature is an important factor that affects the adsorption greatly. For studying the temperature effect the experiments were performed at 27, 35 and 40 °C. Adsorption increased almost for all concentrations of Pb(II) when temperature was raised from 27 to 40 °C, indicating endothermic nature of the adsorption process. This could be due to activation and faster movement of Pb(II) toward the coordinating sites of adsorbent, MOCS, at high temperature [Citation52]. For Zn(II), the adsorption decreased with increase in temperature from 27 to 40 °C, suggesting the process to be exothermic type and less favorable at high temperature. Thorough effect of temperature was tested by applying various adsorption isotherms.
3.2.5.1 Langmuir isotherm
Langmuir isotherm is based on the assumption that adsorption occurs at specific homogeneous, active sites that are energetically equivalent on adsorbent surface and the capacity of the adsorbent is finite [Citation53]. The linearized mathematical form of Langmuir equation is:(3)
(3) where Qo is the amount of adsorbate adsorbed by a unit weight of adsorbent for the formation of monolayer on the surface. Qo is called adsorption capacity, which determines adsorbing behavior of the material, an important quantity used to compare different materials. b is Langmuir constant that is related to the energy of adsorption or affinity of adsorbent toward adsorbate. The values of these parameters were evaluated from the slope and intercept of the Ce/Qe vs Ce plots (Fig. 5) for Pb(II) and Zn(II). Qo for Pb(II) increased from 135.13 to 147.06 µg/g () when the temperature of the solution was raised from 27 to 40 °C, indicating adsorption as an endothermic process, which was inconsistent with temperature effect. It means more adsorption energy is supplied at higher temperatures to enhance the physical binding of Pb(II) ion to the active site on MOCS adsorbent. Thus, the adsorption capacity of Pb(II) increased with the rise in temperature. Whereas the adsorption capacity of Zn(II) decreased slightly from 116.28 to 113.63 μg/g when the temperature was raised in the same range, indicating exothermic adsorption process. The Langmuir constant, b, for Pb(II) were found to be 0.0071, 0.0092 and 0.0106 L/µg, and that for Zn(II) were 0.0209, 0.0157 and 0.0135 L/µg at 27, 35 and 40 °C. The values indicated good binding of these two metal ions to the surface of MOCS.
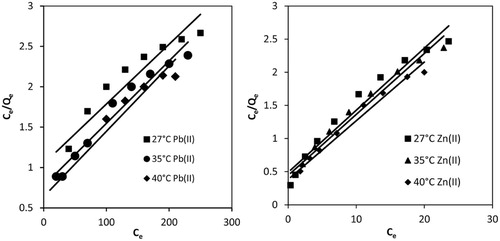
Table 1 Isotherm parameters for Pb(II) and Zn(II) adsorption on MOCS at different temperature.
Langmuir constants were also used to find separation factor (RL) using equation:(4)
(4)
RL value indicates the feasibility to be either unfavorable (RL > 1), favorable (0 < RL < 1) or irreversible (RL = 0). For Pb(II) the separation factor was found in the range 0.168–0.118 and for Zn(II) it ranged 0.056–0.0833 between 27 and 40 °C. RL values range between 0 and 1 for both metal ions, indicating favorability of adsorption process between test temperatures [Citation54]. Theregression coefficients for Pb(II) were 0.91, 0.97 and 0.93, whereas that for Zn(II) were 0.97, 0.98 and 0.9927 at 27, 35 and 45 °C, respectively. The regression coefficients for Pb(II) ions did not approach unity, which indicated poor fitting of adsorption data to Langmuir model. However, these coefficients for Zn(II) ions approached unity and hence data fitted well to Langmuir model.
3.2.5.2 Freundlich isotherm
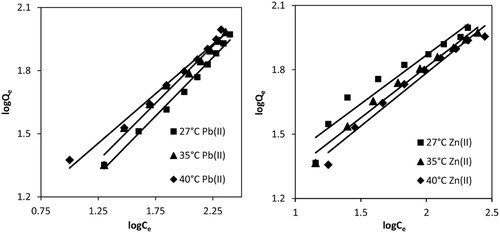
Freundlich isotherm describes adsorption on both homogeneous and heterogeneous surface of adsorbent. Linearized form of Freundlich isotherm is:(5)
(5) where kF {(µg/g) (L/g)1/n} and n are Freundlich constants. kF represents multilayer adsorption capacity at unit concentration of adsorbate and is a relative measure of adsorption capacity of adsorbents. n represents adsorption intensity which varies with heterogeneity of the adsorbent surface. When n approaches to zero, the surface site heterogeneity increases. For a favorable adsorption process n should be in the range 1–10 [Citation55]. Both kF and n () were calculated from the intercept and slope of the plot of logQe vs logCe (Fig. 6) for both metal ions at test temperature. For Pb(II), the values of n (1.8–2.1) come out higher than unity, which indicated good adsorption intensity over the concentration range 200–1000 µg/L. n values increased when temperature was raised from 27 to 40 °C; indicating higher favorability of Pb(II) adsorption at higher temperature, i.e. endothermic process. Thus, Freundlich isotherm supplemented the results of Langmuir isotherm. kF values increased from 4.064 to 7.345 µg/g when the solution temperature was raised from 27 to 40 °C, which further indicated endothermic nature of Pb(II) adsorption. The regression coefficients (R2 = 0.98–0.99) were very close to unity (), showing the well fitting of adsorption data for Pb(II) to Freundlich model, as compared to Langmuir isotherm. For Zn(II), n values (2.2–2.0) were also in the range of 1–10; however, it decreased slightly with the rise in temperature of the solution from 27 to 40 °C. Thus Zn(II) showed less favorability at higher temperature (exothermic adsorption) and similar results had been concluded from Langmuir isotherm. Therefore, Freundlich isotherm supplemented Langmuir isotherm for both metal ions. kF values (2.6–2.2 µg/g) decreased with the rise in temperature, suggesting low adsorption capacity of MOCS for Zn(II) at higher temperature and the results were again similar to Langmuir isotherm. The regression coefficients (R2 = 0.92–0.98) were not very close to unity (), showing the poor fitting of adsorption data for Zn(II) to Freundlich model, as compared to Langmuir isotherm.
3.2.5.3 Temkin isotherm
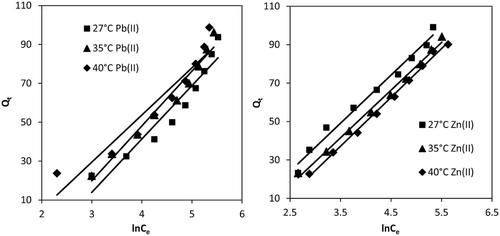
Temkin isotherm is based on the assumption that the heat of adsorption of all molecules in the layer decreases linearly with the coverage of adsorbent surface. The isotherm is applicable for adsorption on heterogeneous solid adsorbent surface and liquid adsorbate. The linearized mathematical form of Temkin isotherm is:(6)
(6) where R and T are universal gas constant (8.341 J/mol/K) and temperature in Kelvin scale. AT (L/g) and bT (kJ/mol) are Temkin constants that are related to the maximum binding energy and heat of adsorption, respectively. Constants, bT and AT, for Pb(II) and Zn(II) were calculated from the slope and intercept of Qe vs lnCe plots (Fig. 7), respectively. AT values for Pb(II) increased from 0.0828 to 0.168 L/g when the temperature of the solution was raised from 27 to 40 °C, suggesting stronger bonding between MOCS and Pb(II) at higher temperature. The bT values or heat of adsorption for Pb(II) increased with the rise in temperatures (). These results were consistent with Langmuir and Freundlich isotherms. AT for Zn(II) also increased from 4.856 to 5.186 L/g when temperature was raised from 27 to 40 °C. The values of bT decreased from 0.119 to 0.102 when temperature was raised from 27 to 40 °C (); therefore, heat of adsorption decreased with the rise in temperature, indicating less adsorption feasibility at higher temperature. Similar conclusions were obtained from Langmuir and Freundlich isotherms. The regression coefficients for Pb(II) varied between 0.83 and 0.87; therefore, adsorption data did not fit to Temkin isotherm. However, for Zn(II), the regression values ranged 0.95–0.977, and thus adsorption data fitted to Temkin isotherm model.
3.2.5.4 Dubinin–Radushkevich isotherm
Dubinin–Radushkevich (D–R) isotherm was applied to determine the nature of bonding between adsorbate and adsorbent. The linear form of D–R isotherm is represented as:(7)
(7) where QD-R is theoretical saturation capacity of adsorbent (µg/g) and β (mol2/kJ2), a constant that is related to mean free energy of adsorption per mole of the adsorbate. ε is Polanyi potential, a function of adsorbate concentration that is represented by the relationship:
(8)
(8)
Slope and intercept of lnQe vs ε2 plot (Fig. 8) give the values of β and QD-R, respectively. QD-R values for Pb(II) decreased from 79.36 to 73.04 µg/g, whereas for Zn(II) QD-R decreased slightly from 72.97 to 68.10 µg/g () with the rise in temperature of solution from 27 to 40 °C. The change in free energy involved for the transfer of one mole of metal ions from infinity in the solution to the surface of MOCS was calculated from β value using the following relationship:(9)
(9)
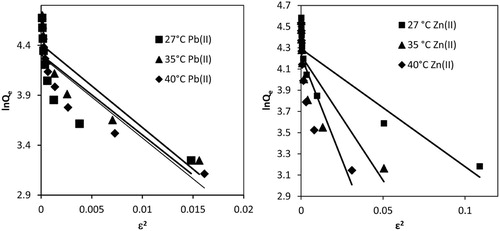
For Pb(II) and Zn(II), E values came out 0.079, 0.077 and 0.078, and 0.21, 0.14 and 0.11 kJ/mol at 27, 35 and 40 °C, respectively. These energy values were less than 8.0 kJ/mol, suggesting physical nature of adsorption process for both Pb(II) and Zn(II) ions [Citation56,Citation57]. However the regression coefficients for Pb(II) were 0.667, 0.823 and 0.821, and that for Zn(II) were 0.801, 0.711 and 0.717; therefore, the adsorption data did not fit to isotherm Dubinin–Radushkevich isotherm.
4 Adsorption thermodynamics
Thermodynamic parameters including Gibbs free energy change (ΔG°), enthalpy change (ΔH°) and entropy change (ΔS°) were calculated to evaluate the feasibility and nature of the adsorption process. Thermodynamics of Pb(II) and Zn(II) adsorption from their solutions onto MOCS with optimized parameters was studied at 27, 35 and 40 °C. The change in free energy is related to Langmuir constant, b, as given in the following relationship:(10)
(10)
ΔG° for Pb(II) slightly increased from −12.344 to −11.371 kJ/mol (), whereas that of Zn(II) increased from −9.638 to −11.155 kJ/mol when the temperature of their solutions was raised from 27 to 40 °C. ΔG° values indicated slightly higher spontaneity for Pb(II) adsorption than Zn(II) when the temperature of their solutions was raised from 27 to 40 °C. Similar observations were concluded from Langmuir and Freundlich isotherms. However, the negative values of ΔG° confirmed the spontaneity of the adsorption process for Pb(II) and Zn(II) ions. ΔG° is also related to ΔS° and ΔH° by the following equation:(11)
(11)
Table 2 Thermodynamic parameters for Pb(II) and Zn(II) adsorption.
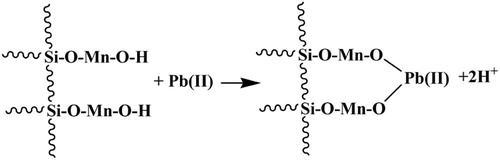
Intercept and slope of plot ΔG°/RT vs 1/T (not shown) give the values of ΔS° and ΔH°, respectively. ΔH° for Pb(II) and Zn(II) were found to be −39.816 and 25.574 kJ/mol, respectively. ΔH° values suggested that the adsorption of Pb(II) was more spontaneous than Zn(II). These values further suggested that Pb(II) adsorption might have followed ion-exchange mechanism, whereas Zn(II) followed physical process [Citation58]. ΔS° for Pb(II) and Zn(II) were found to be 0.0914 and −0.1174 kJ/mol/K, respectively. The positive entropy change for Pb(II) might be attributed to the release of two H+ ions by one Pb(II) on the hydrated surface of MOCS [Citation59], whereas Zn(II) might have electrostatic interaction and electrons present in d orbitals might be playing a role.
5 Adsorption kinetic studies
Kinetic study of process is necessary to obtain information about the adsorption mechanism, which is crucial for the practicality of the process. The mechanism of the adsorption process depends on the physical and chemical characteristics of the adsorbent and adsorbate. The mechanism and rate of adsorption were proposed by fitting the experimental kinetic data to pseudo-first, pseudo-second and Elovich kinetic models.
5.1 Pseudo-first order model
The pseudo-first order rate equation was proposed by Lagergren and is widely used for the adsorption of liquid/solid system [Citation60]. The linear form of Lagergren equation is generally expressed as:(12)
(12) where k1 (min−1) is pseudo-first order rate constant at equilibrium. Qe, and Qt are adsorption uptake of adsorbate at equilibrium and at time t (min), respectively. Slope and intercept of the straight line plot log(Qe−Qt) vs t give the values of k1 and Qe, respectively. The pseudo-first order plots for Pb(II) and Zn(II) are shown in Fig. 9. The values of k1 for Pb(II) and Zn(II) obtained from the straight line plot were 0.0529 and 0.0368 min−1, respectively. The values of regression coefficients were 0.930 and 0.964, which suggested that plots for Pb(II) and Zn(II) were linear over a wide range of initial concentrations. But values of Qe calculated from this straight line differed appreciably from the values of Qe obtained experimentally. The Qe for Pb(II) was 50.5% higher than the experimental values (). However, for Zn(II) the two values matched closely. Therefore, pseudo-first order kinetic model described Zn(II) adsorption, whereas Pb(II) adsorption did not followed pseudo-first order kinetics.
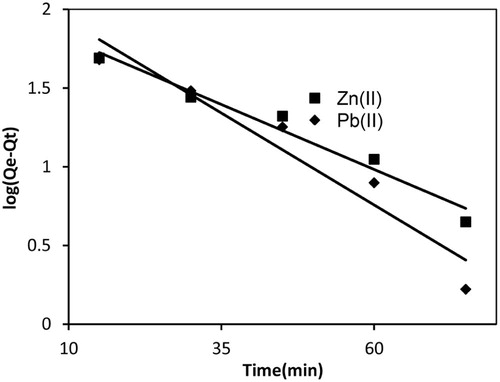
Table 3 Kinetics parameter for Pb(II) and Zn(II) adsorption.
5.2 Pseudo-second order model
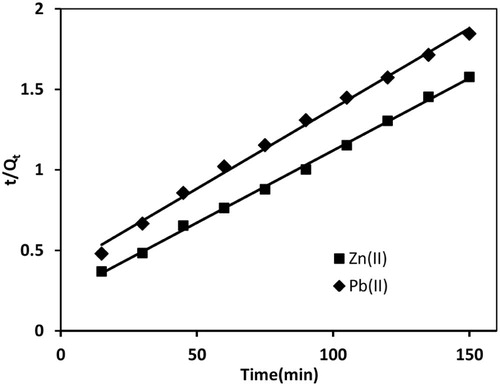
The metal species are held at appropriate ion-exchange sites on the surface by chemical bond formation. Pseudo-second order model [Citation61] suggests that both number of adsorption sites on the material surface and concentration of adsorbate ions in the liquid phase determine the rate. The linearized form of model is:(13)
(13) where h = k2Qe2 and k2 are initial and overall rate constants for adsorption which can be calculated from slope and intercept of plot t/Qt vs t. Pseudo-second order plots for Pb(II) and Zn(II) are shown in Fig. 10. k2 for Pb(II) adsorption was found to be 2.594 × 10⁻⁴ µg/g/min and smaller than initial rate constant, h = 2.595 µg/g/min. This showed that the rate of Pb(II) adsorption was much faster at the beginning and slowed down with the passage of time. The regression coefficient values () for Pb(II) and Zn(II) were 0.996 and 0.998, which indicated the better suitability of pseudo-second order kinetics in the adsorption process, as compared to pseudo-first order model. Moreover, theoretical value of Qe for Pb(II) was 100.0 µg/g and experimental value at 90 min was 68.75 µg/g. Therefore, Pb(II) adsorption followed pseudo-second order kinetics. For Zn(II) adsorption the theoretical value of Qe was 111.11 µg/g, which differs significantly from experimental values of Qe (). Thus Pb(II) adsorption followed pseudo-second order kinetics, whereas Zn(II) adsorption followed partially pseudo-first order and pseudo-second order kinetics [Citation55].
5.3 Elovich kinetic model
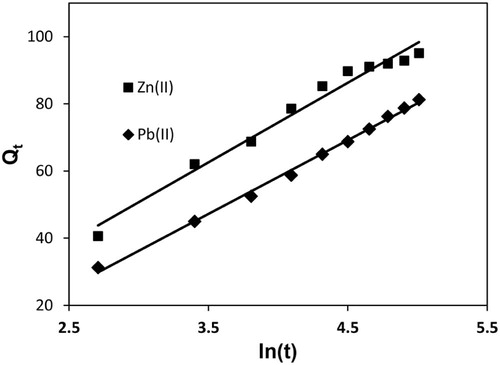
Elovich kinetic relationship, developed by Zeldowitsch in 1934, is suitable to describe second order kinetics assuming that the actual solid surfaces are energetically heterogeneous. Thus the model describes the rate of chemical adsorption on energetically heterogeneous surface [Citation62]. The mathematical relationship in linearized form is:(14)
(14) where α (µg/g/min) is the initial adsorption rate and β (g/µg) is related to the extent of surface coverage and activation energy for chemisorption. The initial adsorption rate, α, and the desorption constant, β, were calculated from slope and intercept of straight line plot between Qt and ln(t) for Pb(II) and Zn(II) (Fig. 11). α value for Pb(II) was found to be 84.942 µg/g/min, which was greater than β value (0.0455 g/µg); therefore, the rate of adsorption was much higher than the rate of desorption. This showed the viability of adsorption process. On the other hand, for Zn(II), α value was 10.0255 µg/g/min, which was greater than β (0.0422 g/µg); therefore, the rate of adsorption was again much higher than desorption. Thus α and β values showed the viability of Pb(II) and Zn(II) adsorption onto MOCS. High regression coefficients of 0.996 and 0.977 () for Pb(II) and Zn(II) indicated well fitting of adsorption data to Elovich kinetic model.
5.4 Adsorptive diffusion
Transfer of metal ions from solution to the adsorbent surface is a complex phenomenon, the mechanism of which involves external mass transfer, film diffusion, intraparticle diffusion and chemical binding. Single or combinations of these steps controls the rate of adsorption. In most cases mass transfer is a fast process, and therefore liquid film diffusion or intraparticle diffusion might control the adsorption.
5.4.1 Intraparticle diffusion
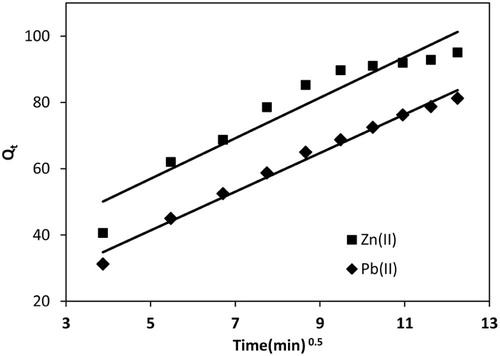
Once adsorbed on the surface, solute particles diffuse into the pores on the surface of adsorbent and form bonding, which may be the rate determining step [Citation63]. Weber and Morris intraparticle diffusion model is given:(16)
(16) where kipd (µg/g/min1/2) is the rate constant for intraparticle diffusion. kipd can be found from slope of plot Qt vs t0.5. For an adsorbing system the straight line should pass through the origin and the intercept value provides an idea about the deviation from intraparticle diffusion model or contribution of the film diffusion mechanism [Citation64]. kipd for Pb(II) and Zn(II) adsorption were observed to be 5.843 and 6.113 mg/g/min1/2 (Fig. 12). The regression coefficients for Pb(II) and Zn(II) were 0.986 and 0.910; therefore, plots were straight line but did not pass through the origin and had intercepts 12.15 and 26.39, which suggested that adsorption of Pb(II) and Zn(II) did not depend on intraparticle diffusion step. The intraparticle process depends on the size of the particle to be adsorbed and size of the pores on the surface of adsorbent. Therefore, in the present case size of Pb(II) and Zn(II) ions should be larger than the size of pores on the adsorbent, and SEM image showed that the MOCS surface is smooth.
5.4.2 Liquid film diffusion
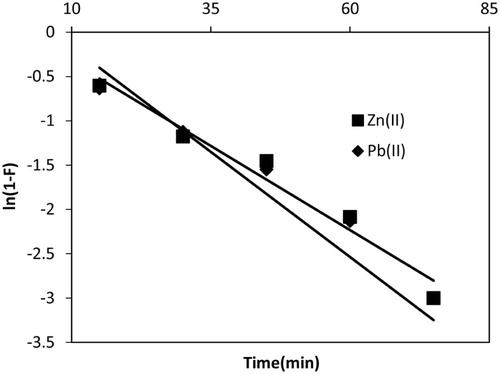
The liquid film diffusion model [Citation65] was employed to investigate whether interface between solid and aqueous phase played a role during the transportation of the adsorbate from solution to the adsorbent. If film diffusion is rate controlling step, then the rate will depend on the thickness of film surrounding the adsorbent particle. The linearized mathematical form is:(15)
(15) where F = Qt/Qe and kfd are fractional attainment of equilibrium and film diffusion rate constant, which can be obtained from slope of the plot ln(1 − F) vs t. Straight line plots (Fig. 13) gave the values of kfd = 0.047 µg/g/min for Pb(II) with intercept 0.310 and that for Zn(II) 0.038 µg/g/min with intercept 0.047. The insignificant non-zero intercept values indicated that the film diffusion mechanism might be followed by both metal ions. Smaller deviations might be due to the shear on the particles during agitation, which considerably reduced the thickness of the aqueous layer surrounding the particles. Thus boundary layer resistance or film diffusion might be rate-limiting step in both metal ions adsorption.
6 Regeneration of adsorbent
For economical viability, MOCS was regenerated and used in a cyclic operation [Citation66]. MOCS was subjected to adsorption process at 10 mg/L concentration of both Pb(II) and Zn(II). The exhausted MOCS was regenerated using 1.0 N NaOH and 70% Zn(II) and 56% Pb(II) desorption was achieved. The regenerated MOCS was used for the second cycle of adsorption–desorption. In the second cycle adsorption for Pb(II) and Zn(II) reduced by about 10% of the first cycle.
7 Conclusion
The water pollution caused globally by toxic heavy metals due to discharge of industrial wastewater may be resolved by adsorption onto adsorbents. Two most toxic heavy metals, Pb(II) and Zn(II), had been removed by MOCS. Adsorption depended on pH and temperature and followed both Langmuir and Freundlich isotherms. High Langmuir monolayer adsorption capacities for Pb(II) and Zn(II) at three temperatures indicated suitability of the adsorbent. Pb(II) adsorption followed pseudo-second-order, whereas Zn(II) followed pseudo-first order kinetics. The spent MOCS was regenerated using 1.0 N NaOH and reused. Thus, MOCS represents a class of recyclable low cost adsorbents that can be safely used for the removal of heavy metals from industrial wastewater.
References
- F.N.AzadM.GhaediK.DashtianS.HajatiA.GoudarziM.JamshidiEnhanced simultaneous removal of malachite green and safranin O by ZnO nanorod-loaded activated carbon: modeling, optimization and adsorption isothermsNew J Chem39201579988005
- A.AsfaramM.GhaediA.GoudarziM.RajabiResponse surface methodology approach for optimization of simultaneous dye and metal ion ultrasound-assisted adsorption onto Mn doped Fe3O4-NPs loaded on AC: kinetic and isothermal studiesDalton Trans4420151470714723
- A.Navas-AcienE.GuallarK.E.SilbergeldJ.S.RothenbergLead exposure and cardiovascular disease-a systematic reviewEnviron Health Perspect1152007472482
- V.C.SrivastavaI.D.MallI.M.MishraRemoval of cadmium(II) and zinc(II) metal ions from binary aqueous solution by rice husk ashColloids Surf A3122008172184
- WHO (World Health Organization)Guidelines for drinking water quality4th ed2011 978 92 4 154815 1327397 Geneva, Switzerland
- A.HawariZ.RawajfihN.NsourEquilibrium and thermodynamic analysis of zinc ions adsorption by olive oil mill solid residuesJ Hazard Mater168200912841289
- E.KatsouS.MalamisK.J.HaralambousIndustrial wastewater pre-treatment for heavy metal reduction by employing a sorbent-assisted ultrafiltration systemChemosphere822011557564
- PangF.M.P.KumarTengT.T.A.K.M.OmarK.L.WasewarRemoval of lead, zinc and iron by coagulation-flocculationJ Taiwan Inst Chem Eng422011809815
- N.AdhoumL.MonserN.BellakhalJ.-E.BelgaiedTreatment of electroplating wastewater containing Cu2+, Zn2+ and Cr6+ by electro coagulationJ Hazard MaterB1122004207213
- I.SahinS.Y.KeskinC.S.KeskinBiosorption of cadmium, manganese, nickel, lead, and zinc ions by Aspergillus tamariiDesalin Water Treat51201345244529
- A.DabrowskiZ.HubickiP.PodkoscielnyE.RobensSelective removal of the heavy metal ions from waters and industrial wastewaters by ion-exchange methodChemosphere56200491106
- Y.BenitoM.L.RuizReverse osmosis applied to metal finishing wastewaterDesalination1422002229234
- T.MohammadiA.RazmiM.SadrzadehEffect of operating parameters on Pb2+ separation from wastewater using electrodialysisDesalination1672004379385
- S.MalamisE.KatsouM.StylianouK.J.HaralambousM.LoizidouCopper removal from sludge permeate with ultrafiltration membranes using zeolite, bentonite and vermiculite as adsorbentsWater Sci Technol612010581589
- T.A.KhanS.A.ChaudhryI.AliEquilibrium uptake, isotherm and kinetic studies of Cd(II) adsorption onto iron oxide activated red mud from aqueous solutionJ Mol Liq2022015165175
- T.A.KhanS.A.ChaudhryI.AliThermodynamic and kinetic studies of As(V) removal from water by zirconium oxide-coated marine sandEnviron Sci Pollut Res Int20201354255440
- S.DashamiriM.GhaediK.DashtianM.R.RahimiA.GoudarziR.JannesarUltrasonic enhancement of the simultaneous removal of quaternary toxic organic dyes by CuO nanoparticles loaded on activated carbon: central composite design, kinetic and isotherm studyUltrason Sonochem312016546557
- A.A.BazrafshanS.HajatiM.GhaediSynthesis of regenerable Zn(OH)2 nanoparticle-loaded activated carbon for the ultrasound assisted removal of malachite green: optimization, isotherm and kineticsRSC Adv520157911979128
- A.AsfaramM.GhaediA.GoudarziM.SoylakS.M.LangroodiMagnetic nanoparticle based dispersive micro solid-phase extraction for the determination of malachite green in water samples: optimized experimental designNew J Chem39201598139823
- HuangY.YangJ.-K.A.A.KellerRemoval of arsenic and phosphate from aqueous solution by metal (hydr-)oxide coated sandACS Sustain Chem Eng2201411281138
- W.-H.KuanS.-L.LoWangM.K.LinC.-F.Removal of Se(IV) and Se(VI) from water by aluminium oxide-coated sandWater Res321998915923
- S.BaipaiM.ChaudhuryRemoval of arsenic from manganese dioxide coated sandJ Environ Eng (New York)1251999782784
- E.ErenB.AfsinY.OnalRemoval of lead ions by acid activated and manganese oxide-coated bentoniteJ Hazard Mater1612009677685
- DongL.ZhuZ.MaH.QiuY.ZhaoJ.Simultaneous adsorption of lead and cadmium on MnO2-loaded resinJ Environ Sci222010225229
- FanH.J.P.R.AndersonCopper and cadmium removal by Mn oxide-coated granular activated carbonSep Purif Technol4520056167
- HanR.P.ZouW.H.LiH.K.LiY.H.ShiJ.Copper(II) and lead(II) removal from aqueous solution in fixed-bed columns by manganese oxide coated zeoliteJ Hazard Mater1372006934942
- WangS.-G.GongW.-X.LiuX.-W.YaoY.-W.GaoB.-Y.YueQ.-Y.Removal of lead(II) from aqueous solution by adsorption onto manganese oxide-coated carbon nanotubesSep Purif Technol5820071723
- LiY.DuQ.WangJ.LiuT.SunJ.WangY.et alDefluoridation from aqueous solution by manganese oxide coated graphene oxideJ Fluor Chem14820136773
- DangT.D.A.N.BanerjeeM.A.CheneyQianS.S.W.JooB.K.MindBio-silica coated with amorphous manganese oxide as an efficient catalyst for rapid degradation of organic pollutantColloids Surf B Biointerfaces1062013151157
- M.Abdel SalamCoating carbon nanotubes with crystalline manganese dioxide nanoparticles and their application for lead ions removal from model and real waterColloids Surf A41920136979
- HanR.ZouW.ZhangZ.ShiJ.YangJ.Removal of copper(II) and lead(II) from aqueous solutions by manganese coated sand I. Characterization and kinetic studyJ Hazard Mater B1372006384395
- S.M.MaliyekkalA.K.SharmaL.PhilipManganese-oxide-coated alumina: a promising sorbent for defluoridation of waterWater Res40200634973506
- XiangS.WangS.G.GongW.X.LiuX.W.GaoB.Y.Removal of fluoride by hydrous manganese oxide-coated alumina: performance and mechanismJ Hazard Mater168200910041011
- H.KhanM.J.AhmedM.I.BhangerA rapid spectrophotometric method for the determination of trace level lead using 1,5-Diphenylthiocarbazone in aqueous micellar solutionsAnal Sci232007193199
- M.BenamorK.BelhamelM.T.DraaUse of xylenol orange and cetylpyridinium chloride in rapid spectrophotometric determination of zinc in pharmaceutical productsJ Pharm Biomed Anal23200010331038
- B.J.SaikiaG.ParthasarathyN.C.SharmaFourier transform infrared spectroscopic estimation of crystallinity in SiO2 based rocksBull Mater Sci312008775779
- S.MusicN.Filipovic-VincekovicL.SekovanicPrecipitation of amorphous SiO2 particles and their propertiesBraz J Chem Eng2820118994
- M.DastkhoonM.GhaediA.AsfaramA.GoudarziS.M.LangroodiI.Tyagiet alUltrasound assisted adsorption of malachite green dye onto ZnS: Cu-NPAC: equilibrium isotherms and kinetic studies-response surface optimizationSep Purif Technol1562015780788
- D.S.SarmaM.R.MohanP.S.R.PrasadInfrared spectroscopic studies on the mobility of metamorphic fluid in quartz veins of Dharwar CratonOpen Mineral J4201018
- F.ZareM.GhaediA.DaneshfarA.OstovanMagnetic molecularly imprinted polymer for the efficient and selective pre-concentration of diazinon before its determination by high-performance liquid chromatographyJ Sep Sci38201527972803
- A.AsfaramM.GhaediS.HajatiA.GoudarziTernary dye adsorption onto MnO2 nanoparticle loaded activated carbon: derivative spectrophotometry and modelingRSC Adv520157230072320
- E.A.DilM.GhaediA.M.GhaediA.AsfaramA.GoudarziS.Hajatiet alModeling of quaternary dyes adsorption onto ZnO-NR-AC artificial neural network: analysis by derivative spectrophotometryJ Ind Eng Chem342016186197
- F.N.AzadM.GhaediK.DashtianM.MontazerozohoriS.HajatiE.AlipanahpourPreparation and characterization of MWCNTs functionalized by N-(3-nitrobenzylidene)-N′-trimethoxysilylpropyl-ethane-1,2-diamine for the removal of aluminum(III) ions via complexation with eriochrome cyanine R: spectrophotometric detection and optimizationRSC Adv520156106061069
- GaoT.M.GlerupF.KrumeichR.NesperH.FjellvagP.NorbyMicro structures and spectroscopic properties of cryptomelane-type manganese dioxide nanofibersJ Phys Chem C11220081313413140
- M.JamshidiM.GhaediK.DashtianA.M.GhaediS.HajatiA.Goudarziet alHighly efficient simultaneous ultrasonic assisted adsorption of brilliant green and eosin B onto ZnS nanoparticles loaded activated carbon: artificial neural network modeling and central composite design optimizationSpectrochim Acta A Mol Biomol Spectrosc1532016257267
- LiuY.LuoC.SunJ.LiH.SunZ.YanS.Enhanced adsorption removal of methyl orange from aqueous solution by nanostructured proton containing δ-MnO2J Mater Chem A Mater Energy Sustain3201556745682
- W.S.W.NgahM.A.K.M.HanafiahRemoval of heavy metal ions from wastewater by chemically modified plant wastes as adsorbents: a reviewBioresour Technol99200839353948
- R.BalasubramanianS.V.PerumalK.VijayaraghavanEquilibrium isotherm studies for the multi component adsorption of lead, zinc, and cadmium onto Indonesian peatInd Eng Chem Res48200920932099
- HuangK.ZhuH.Removal of Pb2+ from aqueous solution by adsorption on chemically modified muskmelon peelEnviron Sci Pollut Res Int20201344244434
- FengQ.LinQ.GongF.S.SugitaM.ShoyaAdsorption of lead and mercury by rice husk ashJ Colloid Interface Sci278200418
- ZhuZ.L.MaH.M.ZhangR.H.GeY.X.ZhaoJ.F.Removal of cadmium using MnO2 loaded D301 resinJ Environ Sci192007652656
- S.A.KosaG.Al-ZhraniaM.A.SalamRemoval of heavy metals from aqueous solutions by multi-walled carbon nanotubes modified with 8-hydroxyquinolineChem Eng J181–1822012159168
- F.N.AzadM.GhaediK.DashtianS.HajatiV.PezeshkpourUltrasonically assisted hydrothermal synthesis of activated carbon-HKUST-1-MOF hybrid for efficient simultaneous ultrasound-assisted removal of ternary organic dyes and antibacterial investigation: Taguchi optimizationUltrason Sonochem312016383393
- M.RoostaM.GhaediF.YousefiOptimization of the combined ultrasonic assisted/adsorption method for the removal of malachite green by zinc sulfide nanoparticles loaded on activated carbon: experimental designRSC Adv52015100129100141
- M.GhaediH.Z.KhafriA.AsfaramA.GoudarziResponse surface methodology approach for optimization of adsorption of Janus Green B from aqueous solution onto ZnO/Zn(OH)2-NP-AC: kinetic and isotherm studySpectrochim Acta A Mol Biomol Spectrosc1522016233240
- P.C.MishraR.K.PatelRemoval of lead and zinc ions from water by low cost adsorbentsJ Hazard Mater1682009319325
- RaoR.A.K.S.SinghB.R.SinghW.KhanA.H.NaqviSynthesis and characterization of surface modified graphene-zirconium oxide nanocomposite and its possible use for the removal of chlorophenol from aqueous solutionJ Environ Chem Eng22014199210
- D.H.K.ReddyK.SeshaiahaA.V.R.ReddyS.M.LeeOptimization of Cd(II), Cu(II) and Ni(II) biosorption by chemically modified Moringa oleifera leaves powderCarbohydr Polym88201210771086
- XuP.ZengG.M.HuangD.L.LaiC.ZhaoM.H.WeiZ.et alAdsorption of Pb(II) by iron oxide nanoparticles immobilized phanerochaete chrysosporium: equilibrium, kinetic, thermodynamic and mechanisms analysisChem Eng J2032012423431
- H.MazaheriM.GhaediS.HajatiK.DashtianM.K.PurkaitSimultaneous removal of methylene blue and Pb2+ ions using ruthenium nanoparticle-loaded activated carbon: response surface methodologyRSC Adv520158342783435
- Y.S.HoG.McKayPseudo-second order model for sorption processesProcess Biochem341999451465
- M.JamshidiM.GhaediK.DashtianS.HajatiA.A.BazrafshanSonochemical assisted hydrothermal synthesis of ZnO: Cr nanoparticles loaded activated carbon for simultaneous ultrasound-assisted adsorption of ternary toxic organic dye: derivative spectrophotometric, optimization, kinetic and isotherm studyUltrason Sonochem322016119131
- A.AsfaramM.GhaediS.HajatiA.GoudarziA.A.BazrafshanSimultaneous ultrasound-assisted ternary adsorption of dyes onto copper-doped zinc sulfide nanoparticles loaded on activated carbon: optimization by response surface methodologySpectrochim Acta A Mol Biomol Spectrosc1452015203212
- ZhuY.HuJ.WangJ.Competitive adsorption of Pb(II), Cu(II) and Zn(II) onto xanthate-modified magnetic chitosanJ Hazard Mater221–2222012155161
- G.E.BoydA.W.AdamsonL.S.MyersThe exchange adsorption of ions from aqueous solutions by organic zeolites, II. KineticsJ Am Chem Soc69194728362848
- SuQ.PanB.S.WanaZhangW.L.LvUse of hydrous manganese dioxide as a potential sorbent for selective removal of lead, cadmium, and zinc ions from waterJ Colloid Interface Sci3492010607612