
Abstract
A reverse flow injection analysis (RFIA) spectrophotometric method have been developed and compared with batch method for the determination of lorazepam (LOR) at the microgram level in pure and pharmaceutical dosage forms. The methods are based on the reaction of LOR with 3-methyl-2-benzothiazolinone hydrazone hydrochloride (MBTH) in the presence of ferric chloride in aqueous medium. The water soluble green color product was measured at λmax 659 nm. Under the optimum conditions, linearity was observed from 2 to 40 and 25 to 400 µg/mL LOR with detection limits of 0.61 and 2.29 µg/mL LOR by batch and RFIA procedures respectively. All the chemical and physical parameters related with reverse flow system were carefully considered and both methods were successfully applied for the determination of LOR in its dosage forms. These simple and high throughput methods could be utilized for pharmaceutical analysis of LOR.
1 Introduction
Lorazepam (7-chloro-5-(2-chlorophenyl)-3-hydroxy-2,3-dihydro-1H-1,4-benzo-diazepin-2-one) is a benzodiazepine indicated for the treatment of anxiety disorders and preoperative sedation [Citation1]. LOR has the chemical formula C15H10Cl2N2O2 ().
Fig. 1 Chemical structure of lorazepam.
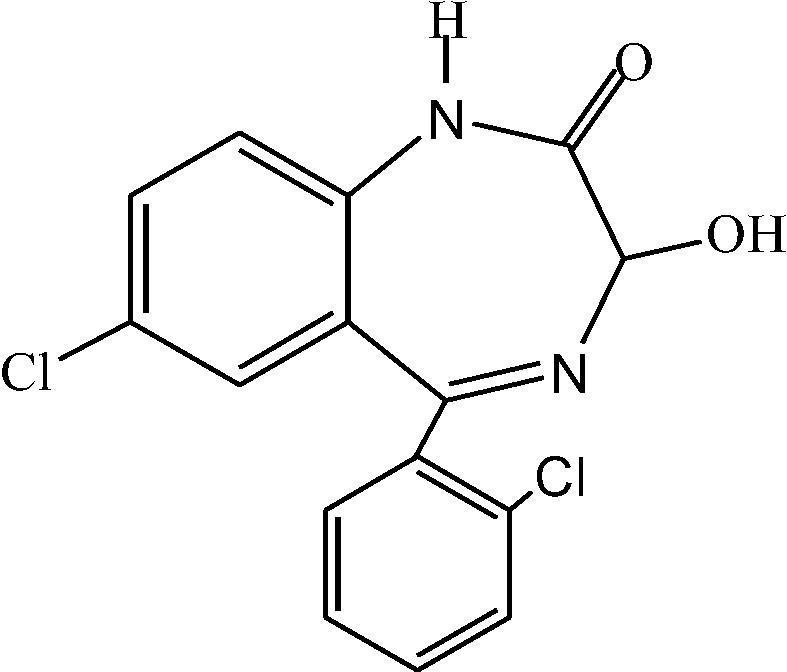
It is applied in a wide range of indications and patient categories, because of its sedative and anticonvulsant properties. Within pediatrics, it is administered to children with status epilepticus and for intubated and mechanically ventilated patients [Citation2]. Lorazepam is inexpensive, long acting (up to 72 h) [Citation3] and has less risk of seizure recurrence. Lorazepam has a shelf life of 3 years and can be given intravenously (IV), intramuscularly (IM), and intranasal (IN) [Citation4].
Determination of LOR concentration in pharmaceutical preparations was previously done using potentiometry and multi- wavelengths spectrophotometry [Citation5], high-performance liquid chromatography (HPLC) [Citation6Citation[7]–Citation8] , gas chromate-graphy- mass spectrometry (GC-MS) [Citation9Citation[10]–Citation11] , micellar electrokinetic capillary chromatography [Citation12] and voltametry [Citation13]. Among various methods available for trace analysis, FI analysis methods provide a fast, simple and inexpensive analysis of trace amounts of different chemicals and pharmaceutical forms [Citation14]. The literatures reported only a few FIA methods [Citation15,Citation16] available for the determination of LOR, one of them [Citation15] was not specific, only one wavelength in the UV region being chosen for the spectrophotometric detection of LOR. until now the literature contains no reverse flow injection-spectrophotometric methods for the determination of LOR in pure or dosage forms. This study describes fast and simple batch and reverse FI methods as a direct methods that utilize a colorimetric reaction for the determination of LOR in pharmaceutical preparations.
2 Experimental
2.1 Apparatus
| • | A digital double beam spectrophotometer a type of Shimadzu UV–VIS 260 (Shimadzu, Kyoto-Japan) had been used for all spectral and absorbance measurements of FIA procedures. The absorbance measurements were carried out using 1 cm path length of quartz flow matched cells (Cecil, 50 μL internal volume), and for the absorbance measurements of the batch method, a matched 1 cm silica cells were used. | ||||
| • | A peristaltic pump of six channels (Ismatec, Labortechnik-Analytic, type CH-8152, Glatbrugg Zurich-Switzerland) used for pumping the solutions of reagents. A 6-ways injection valve with different loops (Rheodyne, Altex 210, Supelco -USA) was used for injected samples. | ||||
| • | A flexible vinyl tubing (0.8 mm i.d.) was used for the peristaltic pump, while a tubes of Teflon material with an internal diameter of 0.5 mm was used for made different lengths of reaction coil (RC). | ||||
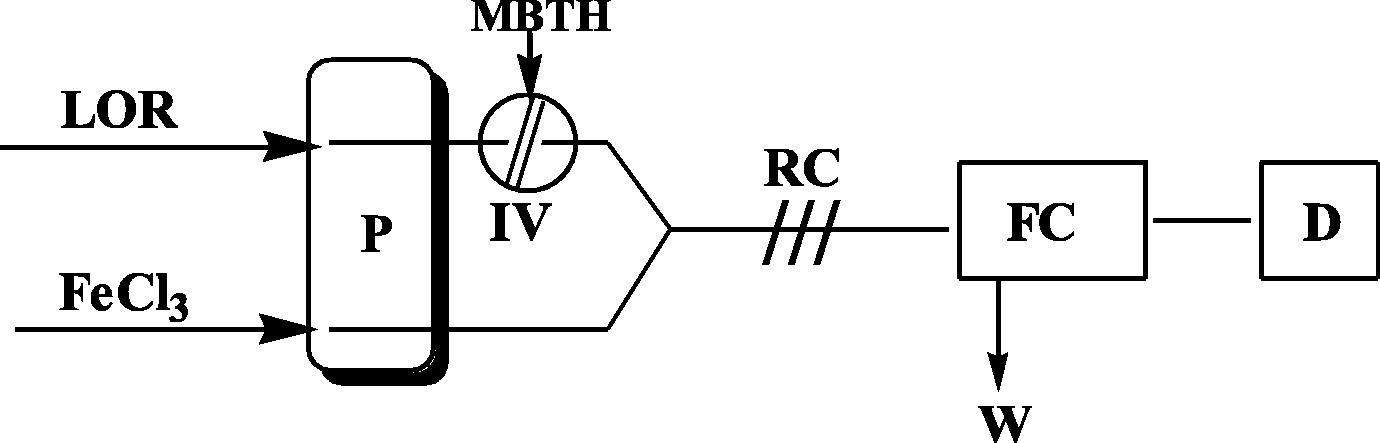
A two-channel manifold () was employed for the RFIA spectro-photometric determination of LOR drug. The solution of drug (LOR) was transported through one of the two channels in this setup. On the other hand, the second channel was used to transport ferric chloride solution. The reagent solution of methyl-2-benzothiazolinone hydrazone hydrochloride (MBTH) was injected through the system of valve into a stream of LOR then mixed with oxidant in the reaction coil. The resultant solutions were propelled by peristaltic pump at a total flow rate of 0.6 mL/min into the detector. A green colored product was formed and absorbance was measured at 659 nm.
Fig. 2 Manifold employed for RFIA-Spectrophotometric determination of LOR by reaction with MBTH and FeCl3, where: IV, injection valve; RC, reaction coil; P, peristaltic pump; FC, flow cell; D, detector; W, waste.
2.2 Materials and chemicals
An analytical grade reagents, chemicals and distilled water were used usually through the work. Pharmaceutical grade LOR and excipients were received from state company for Drug Industries and Medical Appliance, SDI, Samara-Iraq.
Pharmaceutical dosage forms containing LOR were purchased from local commercial sources. Two generic versions each contains LOR as its active constituent were used for analysis in this study (Lorativan®, 2 mg, Domina pharmaceuticals, Syria and Lorazesam®, 1 mg, SDI, Iraq).
2.2.1 LOR solution (500 µg/mL)
For batch and RFIA methods, LOR standard solution (500 µg/mL) was freshly prepared by dissolving 0.025 g of pure LOR powder in 50 mL ethanol. More dilute solutions can be prepared daily by appropriate dilution using distilled water.
2.2.2 Methylbenzothiazoline-2-one hydrazone hydrochloride (0.05 M)
The acidic solution of this reagent was prepared by dissolving 1.08 g of MBTH (Sigma Aldrich, Missouri, United States) in a 100 mL of 0.2 M HCl (Merck, Germany). More dilute solutions can be prepared daily by appropriate dilution using the same solvent (this solution is stable more than two weeks).
2.2.3 Ferric chloride (2% V/V)
This solution was prepared by diluted 2 mL of ferric chloride solution (60% W/V FeCl3, BHD, UK) in 100 mL distilled water for batch and RFIA methods. More dilute solutions can be prepared daily by appropriate dilution using the same solvent.
2.2.4 Solutions of pharmaceutical dosage forms
Twenty Lorativan retard tablets (2 mg LOR) or forty Lorazesam tablets (1 mg LOR) were weighed and finally powdered. An amount of resultant powder equivalent to 0.0125 g of LOR was dissolved in 25 mL of ethanol and the resultant solution was shaked and filtered into a 50 mL volumetric flask, the residue was washed and diluted to volume with ethanol to obtain 250 µg/mL of LOR. More dilute solutions can be prepared daily by appropriate dilution using distilled water for batch and RFIA methods.
3 Procedures
3.1 General batch procedure
An aliquot of sample containing 20–400 μg of LOR was transferred into a series of 10 mL standard flasks. A volume of 2.0 mL of 0.02 M MBTH solution, and 1.5 mL of 2% V/V ferric chloride solution were added. The contents of the flasks were diluted to the mark with distilled water, mixed well and kept for 10 min. The absorbance was measured at 659 nm (at room temperature 25 °C) against reagent blank containing all materials except LOR. The drug concentration was computed using a standard calibration graph. For the optimization of conditions and in all subsequent experiments, a solution of 25 μg/mL was used.
3.2 General RFIA procedure
Working solutions of LOR in the range 25–400 μg/mL were prepared from stock solutions. A 150 μL portion of 0.04 M of MBTH was injected into the stream of LOR which then mixed with the oxidant solution (ferric chloride of 8% V/V), with a total flow rate of 0.6 mL/min (). The resulting absorbance of the green product was measured at 659 nm and a calibration graph was shown in . Optimization of conditions was carried out on 100 μg/mL of LOR.
Table 1 Analytical features of the procedures developed for the estimation of LOR.
4 Results and discussion
4.1 Reaction mechanism of the method
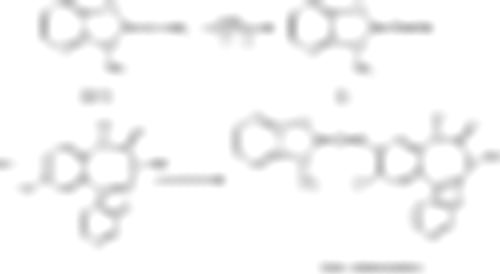
LOR was found to react directly with MBTH in the presence of ferric chloride as oxidant agent to produce a green colored product with absorbance measured at λmax 659 nm. MBTH has been utilized for the spectrophotometric determination of several other compounds [Citation17]. An electrophilic intermediate was formed when MBTH loses two electrons and one proton under oxidation process, which can be substituted on LOR under the reaction conditions to form a green colored product at room temperature. The proposed pathway of the reaction [Citation18] is shown in .
Fig. 3 Schematic representation of the proposed reaction mechanism.
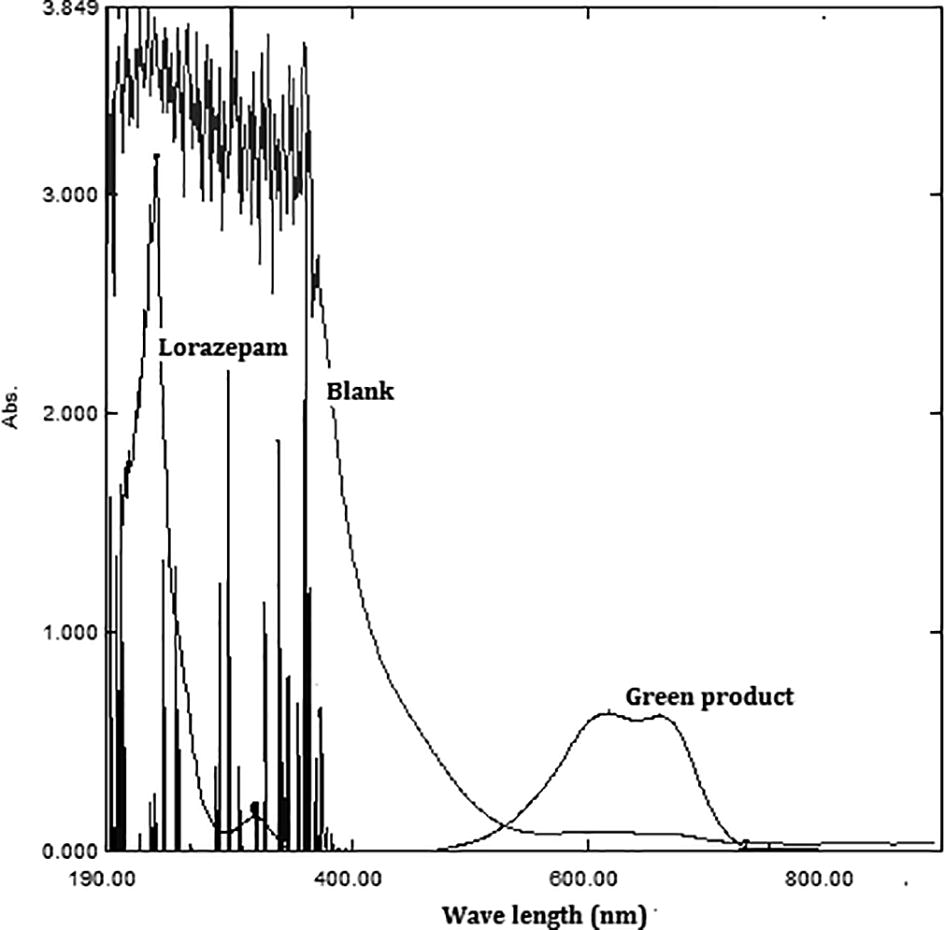
All the variables that may affecting mainly the sensitivity and stability of the colored product were optimized by variable one parameter with the time, and keeping others fixed. A typical spectrum for LOR reaction product against reagent blank is shown in .
Fig. 4 Absorption spectra of the green colored product obtained from the reaction of 25 µg/mL of LOR with MBTH/ferric chloride measured against the reagent blank. The reagent blank was measured against distilled water. (For interpretation of the references to color in this figure caption, the reader is referred to the web version of this article.)
4.2 Optimization of reaction conditions
4.2.1 Batch spectrophotometric method
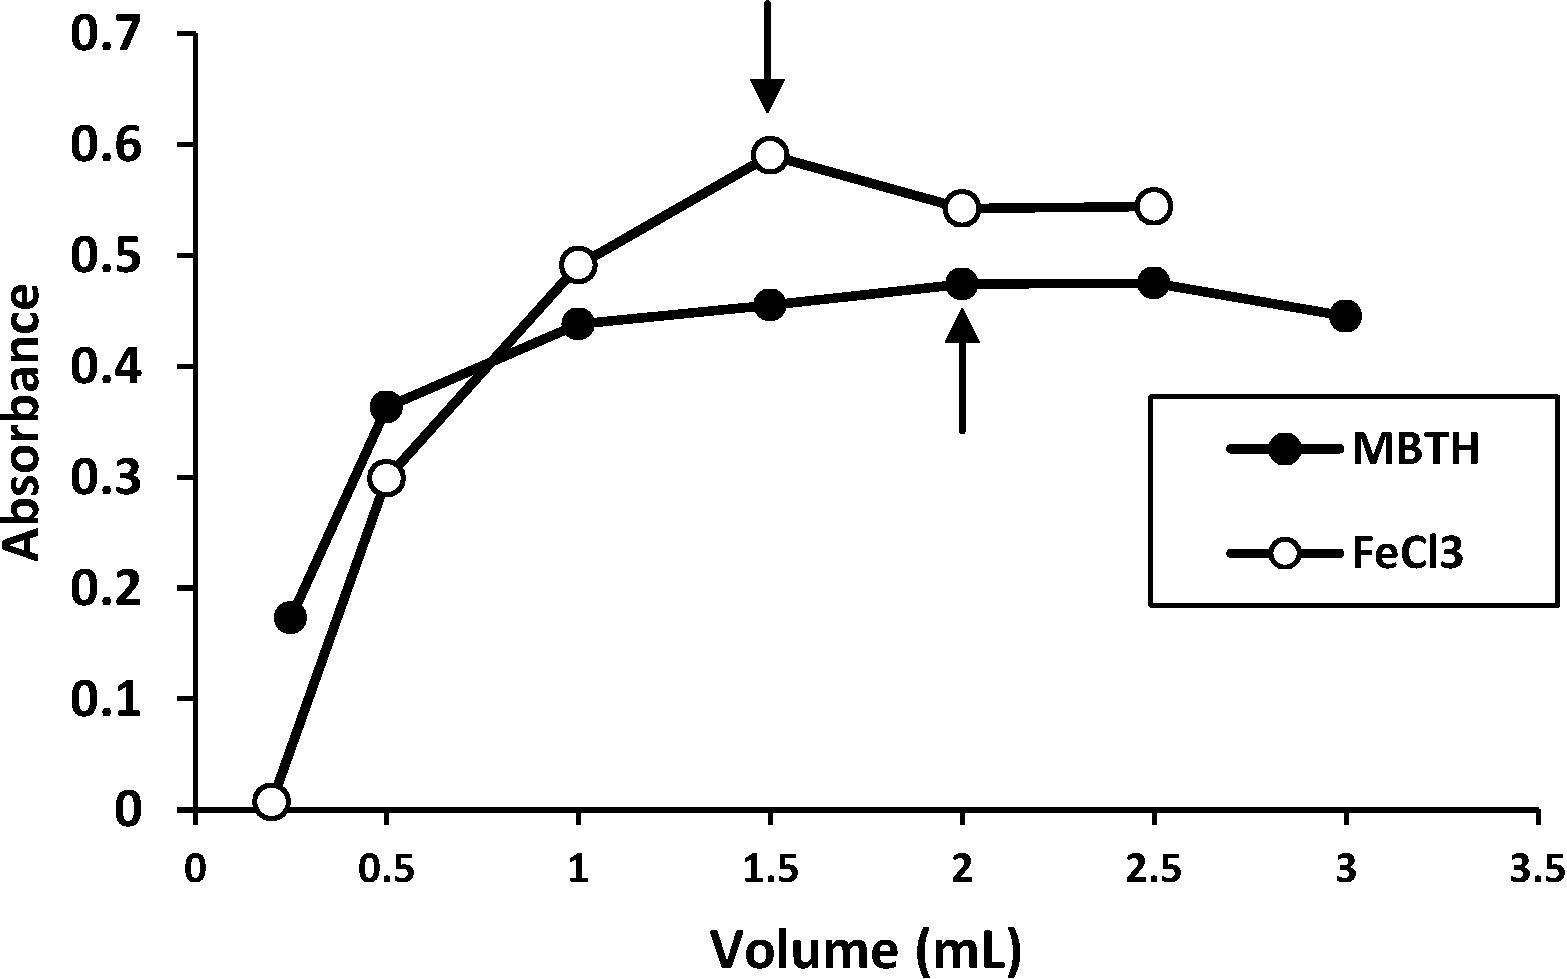
The proposed method was optimized to achieve complete reaction formation, the highest sensitivity and maximum absorbance. The best experimental conditions for the determination of LOR were established for MBTH 0.02 M (from 0.25 to 3 mL), FeCl3 2% V/V (from 0.1 to 2.5 mL) by adding various volumes of their solutions to a fixed concentration of LOR and measuring the absorbance at 659 nm. The results obtained () showed that 2.0 mL of 0.02 M of MBTH and 1.5 mL of 2% V/V of FeCl3 gave the maximum color intensity and led to the maximum color stability of the dye product for 25 μg mL−1 of LOR.
Fig. 5 Effect of the volume of reagent (MBTH 0.02 M) and oxidant (FeCl3 2% V/V).
The color intensity reached a maximum after LOR (25 µg/mL) had been reacted immediately with MBTH and FeCl3 in aqueous medium and became stable after 10 min, and it remained stable for 50 min at least. The effect of order of addition is also studied using different order of addition and according to the results, it was found that the order of addition of reagents (Drug + MBTH + OX) as shown in , gave the maximum absorbance and stability in measurement.
Fig. 6 Effect of order of addition.

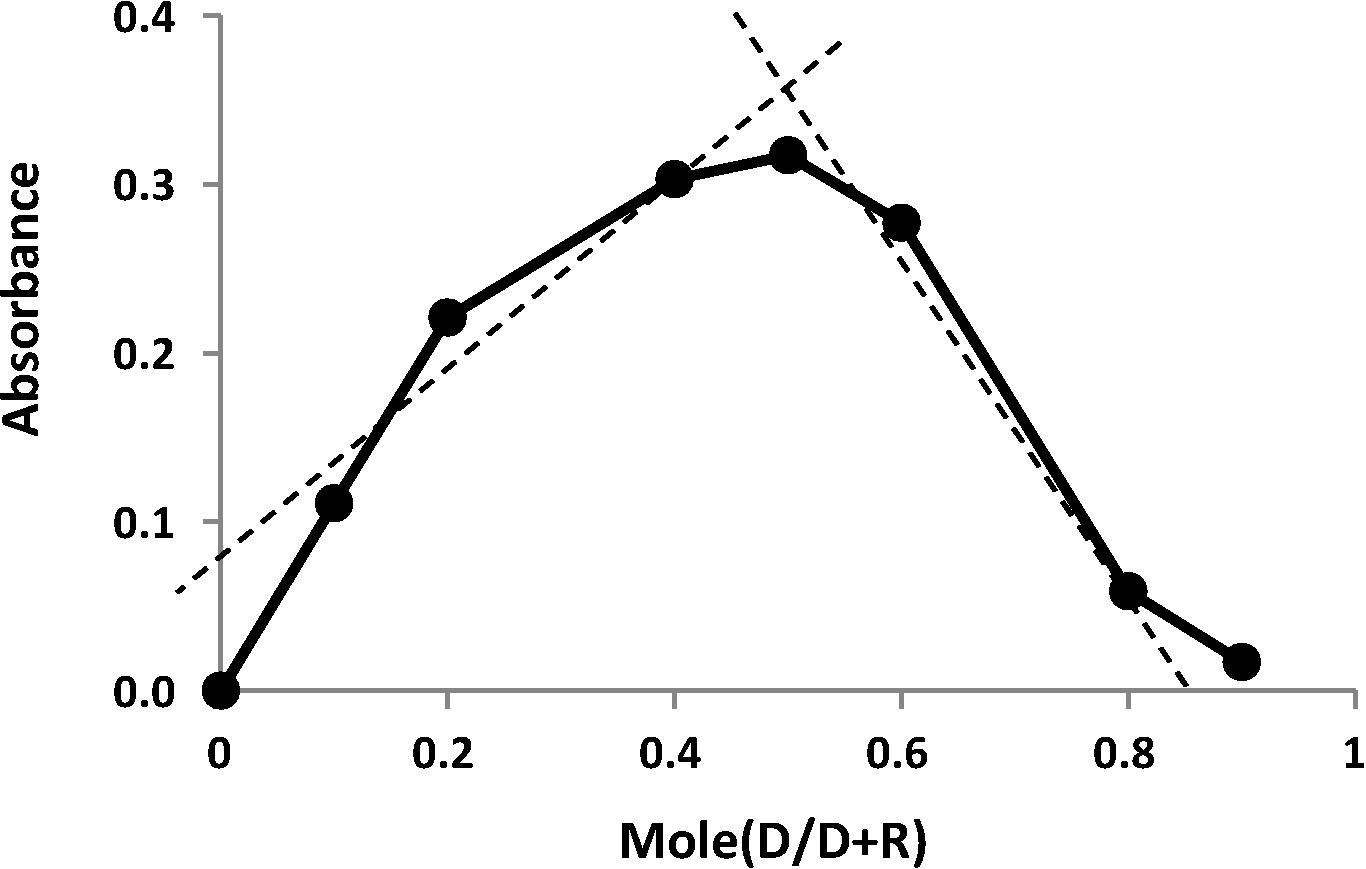
Three different temperatures (5, 25 and 65 °C) were used to study effect of temperature on the reaction. In practice, a higher absorbance was obtained when the color was developed when the calibrated flasks placed in a water bath at (65 °C) than at room temperature (25 °C) or at (5 °C). Further study shows that the colored product was unstable and dissociation quickly at higher temperature, therefore the room temperature was chosen for carried out all the next experiments. The structure of the product was adopted based on the mole continuous variation method (Job’s method), using 1 × 10⁻³ M solution of equimolar of each LOR and MBTH reagent. The results obtained in show that 1:1 LOR to reagent was formed.
Fig. 7 Job method.
The regression equation was derived using the least-squares method. The intercept, slope, and correlation coefficient values for the calibration curve are calculated and listed in and also compared with the RFIA proposed method.
In order to examine the usefulness of the method, and freedom from interference by tablets additives, a recovery testing for LOR was accomplished in the existence of (10-fold) of excipients. The good percentage recoveries were obtained indicating no interference was observed and the method have good selectivity for analysis the LOR in its dosage forms ().
Table 2 Determination of LORTable Footnote* in presence of common interferences by batch method.
4.2.2 RFIA-Spectrophotometric determination
The previous method (batch) for the assay of LOR, was used as the basis for the development of reverse flow injection (RFIA) procedure. MBTH has been frequently utilized for the spectrophotometric determination of several compounds, but this reagent is expensive, therefore, a reverse flow manifold had been adopted for estimation LOR. First of all the selection of the best manifold of flow system is very essential, therefore various manifolds reaction were used to perform different paths and the results obtained showed that the manifold in gave the best absorbance for reaction, and was chosen for further use. Maximum absorbance intensity was obtained when the 150 µL of 0.04 M of MBTH was injected into the stream of 100 μg/mL LOR which then mixed with the oxidant solution (ferric chloride of 8% V/V) in reaction coil as given in . Each sample was injected three times and different physical or chemical parameters were optimized by changing individually while the others were kept constant.
4.2.3 Optimization of the RFIA system conditions
4.2.3.1 Effect of the chemicals variables
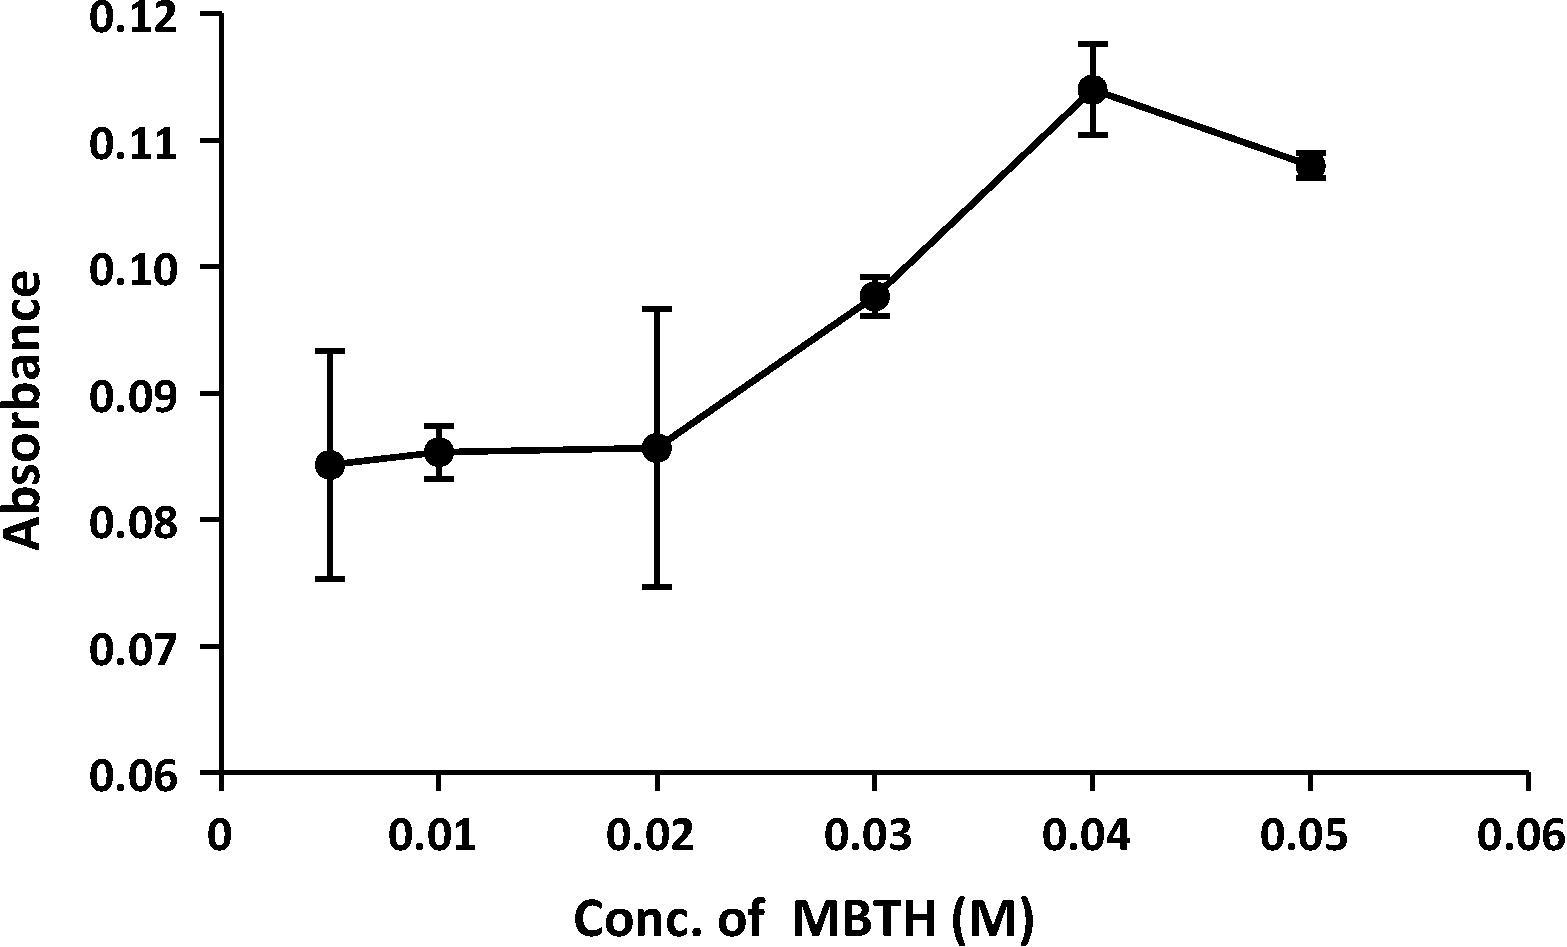
Chemical parameters were also optimized and studied to improve the sensitivity of the adopted reaction. The best concentration of the reagent (MBTH) was studied through injected different concentrations (from 0.005 to 0.05 M) through the injection valve. The results in indicated that the concentration of 0.04 M gave a high absorbance and good precision and was chosen for further use.
Fig. 8 Effect of concentration of reagent.
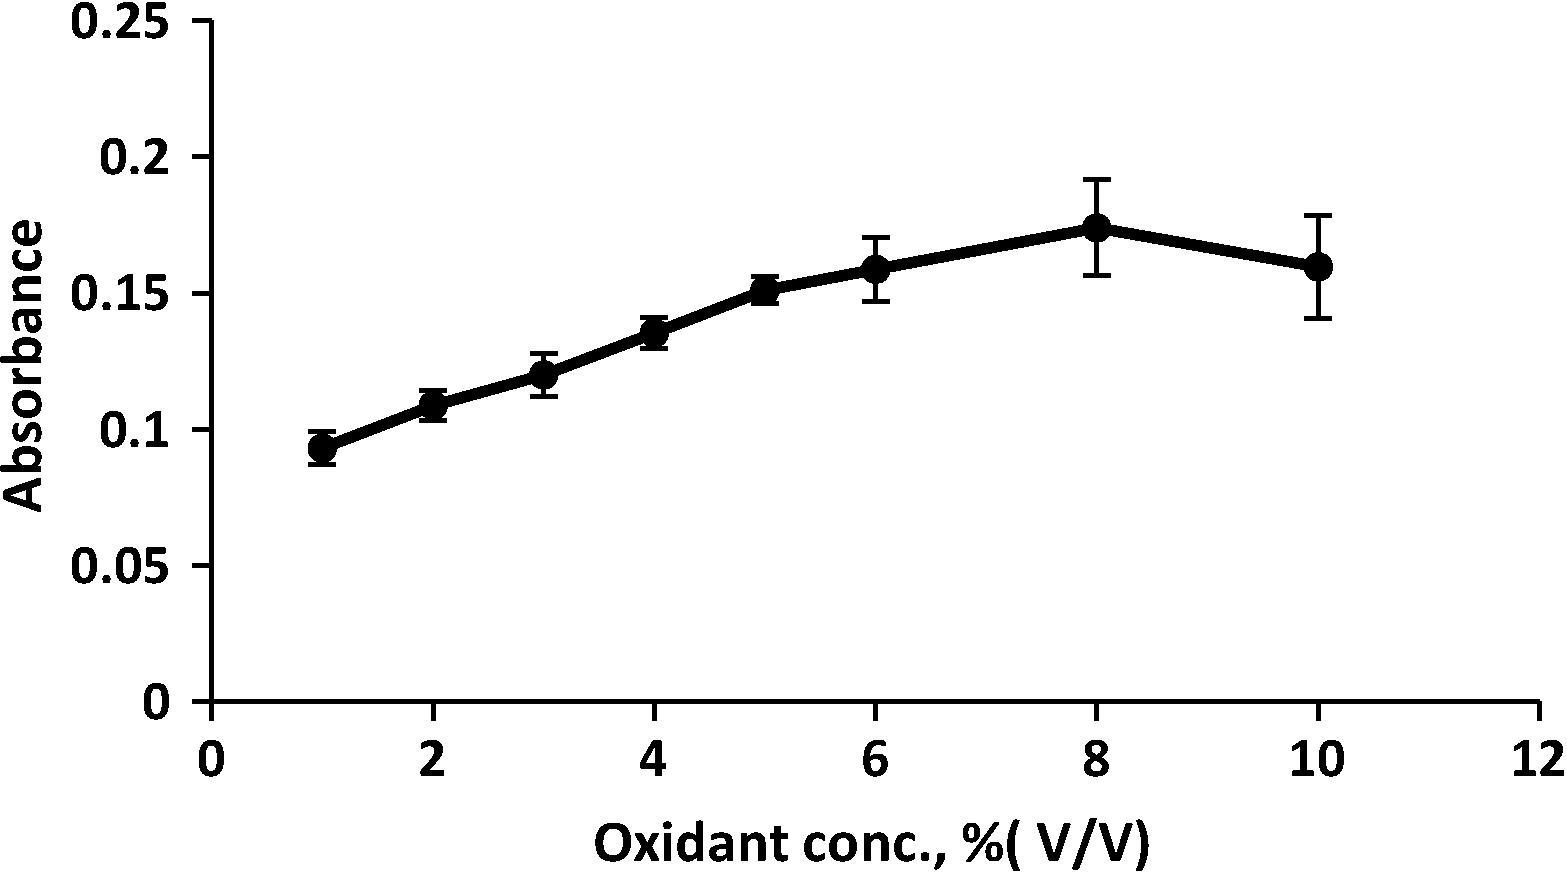
Different concentration of oxidant (ferric chloride) were also studied in the range of concentration (from 1 to 10% V/V) FeCl3 were investigated; the optimum concentration of 8% V/V gave the best results and minimum blank value as shown in and was considered as optimum value.
Fig. 9 Effect of concentration of oxidant.
4.2.3.2 Effect of the physical variables
The physical parameters were also studied and different coil lengths using for mixing the reagents and complete the reaction was studied in the range of 50–200 cm. The results obtained showed that a coil length of 80 cm gave the highest absorbance as shown in and was used then in all experiments. After this length the absorbance of colored product decrease with increase coil length because of increase the dilution resulting from dispersion.
Fig. 10 Effect of reaction coil length.

The effect of different flow rate () on the reaction was studied in the range of 0.6–4.2 mL/min. The results obtained showed that the absorbance of the total flow rate of 0.6 mL/min gave the highest absorbance and good precision. After this value the absorbance decrease with increase the flow rate because the high speed would never get the reactants a sufficient time for mixing (i.e. the sample zone would form and get out the flow cell quickly) therefore, 0.6 mL/min, (total flow rate) was selected to be the best value.
Fig. 11 Effect of total flow rate.

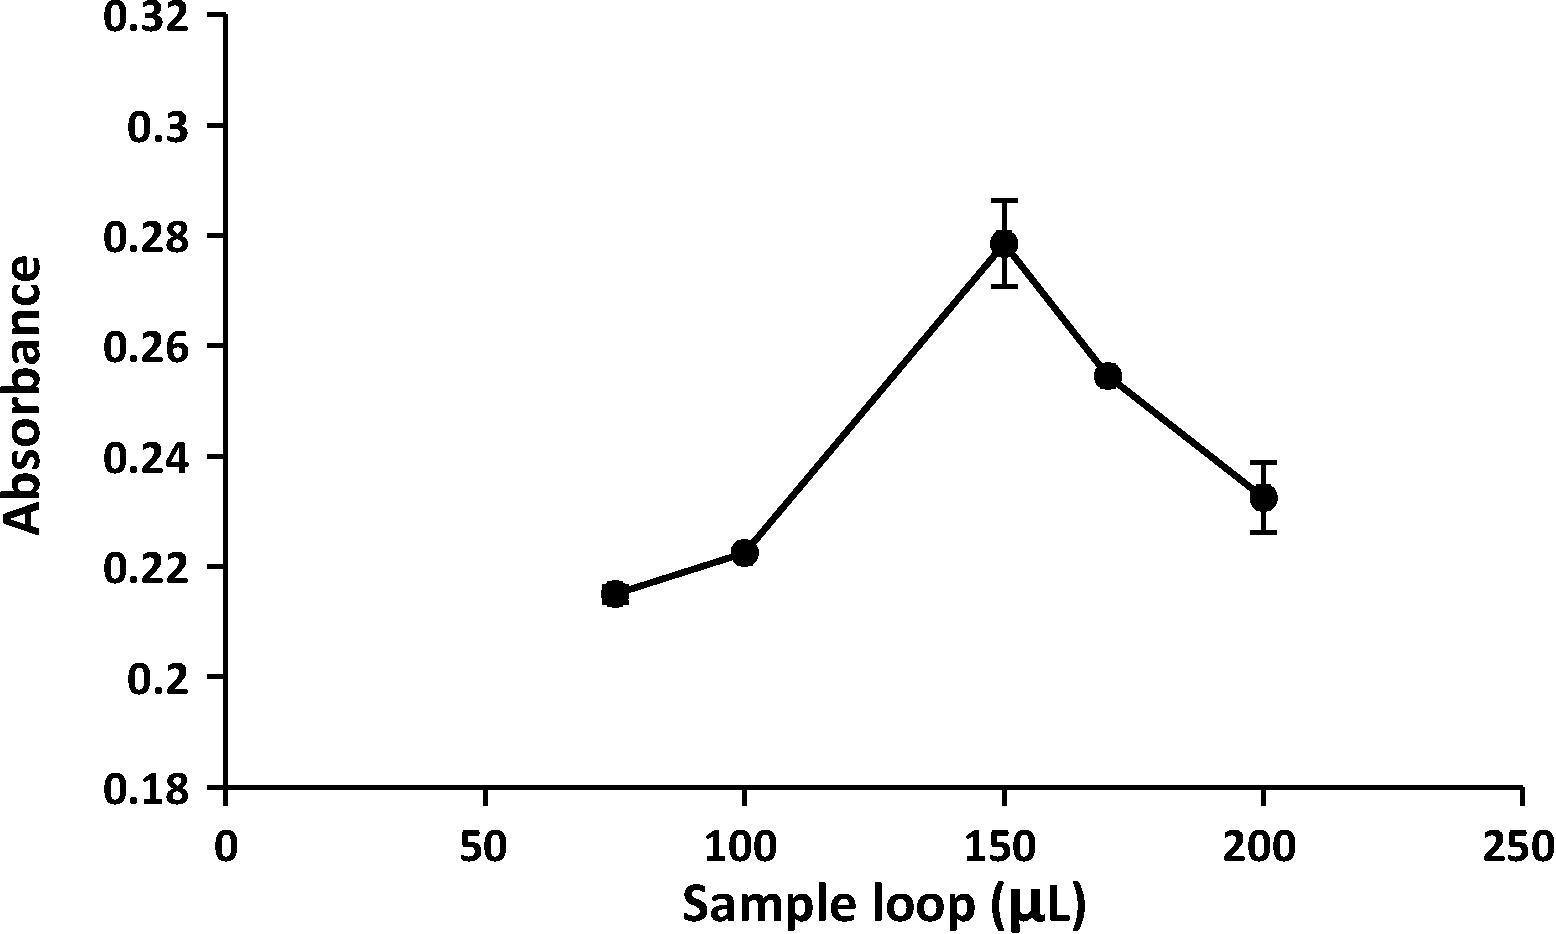
The volume of the injected sample was investigated using five sample loops (75–200 μL) and the results obtained showed that the injected sample of 150 µL gave the best absorbance and was chosen for further experiments ().
Fig. 12 Effect of sample volume.
After studied all variables, and under the optimized conditions () the sampling frequency or sampling rate can be calculated theoretically by measuring the time calculated from the moment of sample injection to the appearance of the maximum absorbance. The calculated time was 2.13 min; therefore the sampling frequency was 28 sample per hour.
Table 3 Optimum conditions for the determination of LOR.
4.3 Validation of the current method
Analytical characteristics such as linearity, detection limit, sampling rate, correlation coefficient and relative standard deviation (RSD) of each method were determined for the above optimized conditions as shown in . A linear range of the calibration graph was obtained using a series of solutions of LOR (25–400 μg/mL) which prepared from the stock solution. In comparison of the batch with RFIA procedure, the later is more convenient than the former method because of its speed (sample throughput of 26 injections per hour) and wider linear range of calibration graph although the batch method is more sensitive than flow injection method.
4.4 Accuracy and precision
Evaluation of the accuracy and precision of the proposed methods, accomplished by prepared and analyzed solutions containing three different concentrations of LOR were in five replicates. The analytical results of this investigation are summarized in . The low values of percentage relative standard deviation (% RSD) as precision and percentage relative error as accuracy indicated that the proposed methods show a good accuracy and precision.
Table 4 Accuracy and precision of the proposed methods.
4.5 Analytical applications
Batch and RFIA methods were also successfully applied for determination of LOR in pharmaceutical dosage forms (tablets) by the analysis of two different concentrations of pharmaceutical preparations using the analytical procedures directly. The results are given in .
Table 5 Application of the proposed and official methods to the determination of LOR in different dosage forms.
To examine the efficiency and success of the suggested methods, the obtained results compared with those obtained from applying the USP standard method [Citation19]. The performance of the current method was refereed by calculating the Student’s t-and F-values[Citation20]. Values of calculated t-and F-tests did not exceed the theoretical values as illustrated by .
Table 6 The statistical comparison between the current methods and standard method.
5 Conclusion
The literatures reported only a few spectrophotometric methods and two FIA methods for the determination of LOR in dosage forms and in biological fluids and these methods either need extraction or using a complicated and expensive techniques and until now the literature contains no reverse flow injection-spectrophotometric method for the determination of LOR in pure or dosage forms. The suggested methods, which are simple and rapid, offers the advantages of sensitivity more than the reported methods, and a wide range of determination without the need for extraction or heating. The wide applicability of the new method for routine quality control is well established by the assay of LOR at microgram concentration level in pharmaceutical formulations. The reaction can be carried out in batch and RFIA and in this paper both approaches were compared.
References
- Lexicomp Online®, Pediatric & Neonatal Lexi-Drugs®. Lexi-Comp Inc, Hudson, Ohio; 2016.
- A.C.van der VossenI.van der VeldeO.S.N.M.SmeetsD.J.PostmaM.EckhardtA.Vermeset al.Formulating a poorly water soluble drug into an oral solution suitable for paediatric patients; lorazepam as a model drugEur J Pharm Sci1002017205210
- Joint Formulary CommitteeBritish National Formulary2012BMJ Group and Pharmaceutical PressLondon
- E.S.BjörnssonO.M.BergmannH.K.BjörnssonR.B.KvaranS.OlafssonIncidence, presentation and outcomes in patients with drug-induced liver injury in the general population of IcelandGastroenterology144201314191425
- A.YazdanipourStudy of protonation equilibrium of lorazepam by potentiometry and multi-wavelengths spectrophotometryJ Iran Chem Res22009293297
- J.FengR.ShenD.ZhangZ.DongD.D.ZhangH.WangQuantification of Lorazepam in human plasma using HPLC: application to a pharmacokinetic studyLat Am J Pharm3432015622626
- H.A.MashayekhiF.KhalilianDevelopment of solid-phase extraction coupled with dispersive liquid-liquid microextraction method for the simultaneous determination of three benzodiazepines in human urine and plasmaJ Chroma Sci54620160681073
- D.SrikanthaR.R.RajuDevelopment and validation of RP-HPLC method for lorazepam in tablet dosage formInt J Ayu Pharm Chem1120146575
- B.A.GoldbergerC.W.ChronisterM.L.MervesQuantitation of benzodiazepines in blood and urine using gas chromatography-mass spectrometry (GC-MS)Methods Mol Biol60320107587
- I.I.PapoutsisS.A.AthanaselisP.D.NikolaouC.M.PistosC.A.SpiliopoulouC.P.MaraveliasDevelopment and validation of an EI-GC-MS method for the determination of benzodiazepine drugs and their metabolites in blood: applications in clinical and forensic toxicologyJ Pharm Biomed Anal5242010609614
- M.AcikkolS.MercanS.KaradayiSimultaneous determination of benzodiazepines and ketamine from alcoholic and nonalcoholic beverages by GC-MS in drug facilitated crimesChromatography70200912951303
- J.J.B.NevadoG.C.PenalvoM.S.P.CalderonDetermination of lorazepam and its main metabolite in serum using micellar electrokinetic capillary chromatography with direct injection and ultraviolet absorbance detectionJ Chromatogr B7732002151158
- L.M.D.CarvalhoD.CorreiaS.C.GarciaA.V.D.BairrosP.C.D.NascimentoD.BohrerA new method for the simultaneous determination of 1,4-benzodiazepines and amfepramone as adulterants in phytotherapeutic formulations by voltammetryForensic Sci Int20220107581
- P.ThongsrisomboonB.LiawruangrathS.IawruangrathS.Satien-perakuDetermination of nitrofurans residues in animal feeds by flow injection chemiluminescence procedureFood Chem1232010834839
- D.PradaE.LorenzoM.HernandezL.HernandezRapid determination of some 1,4-benzodiazepines by flow injection analysisMicrochem J371988257262
- P.NorouziM.R.GanjaliA.S.E.MeibodiA novel adsorptive square wave voltammetric method for pico molar monitoring of lorazepam at gold ultra microelectrode in a flow injection system by application of fast fourier transform analysisAnal Lett41200812081224
- H.MallikarjunaK.H.ShivaprasadK.R.Venugopala ReddyK.S.LokeshSpectrophotometric determination of somenonsteroidal anti-inflammatory drugs by oxidative coupling reactionAustin J Anal Pharma Chem3201616
- B.RamachandraN.V.NaiduSpectrophotometric method for the determination of furazolidone in pharmaceutical formulations and human blood samples with MBTHInt J Sci Res4201510261031
- USP (United States Pharmacopoeia, 30th revision); 2012.
- J.N.MillerJ.C.MillerStatistics and chemometrics for analytical chemistry2010Ashford Colour Press Ltd.Gosport, UK