 ?Mathematical formulae have been encoded as MathML and are displayed in this HTML version using MathJax in order to improve their display. Uncheck the box to turn MathJax off. This feature requires Javascript. Click on a formula to zoom.
Abstract
The major disadvantage of using ordinary reinforced concrete (RC) elements is the corrosion of steel, which occurs due to effect of cracks in tension zones. The main advantage of the fully prestressed concrete system is the absence of cracks in the concrete at the nominal service load and therefore better durability will be achieved. Combining the PC system with the use of high strength concrete is a milestone, which will potentially result in a new design approach. The disadvantage of the use of this combination is referred to the reduced ductility of concrete members.
This paper presents an experimental program conducted to study the behavior of bonded and unbounded prestressed normal strength (NSC) and high strength concrete (HSC) beams. The program consists of a total of nine beams; two specimens were reinforced with non-prestressed reinforcement, four specimens were reinforced with bonded tendons, and the remaining three specimens were reinforced with unbonded tendons. The overall dimensions of the beams are 160 × 340 × 4400-mm. The beams were tested under cyclic loading up to failure to examine its flexural behavior. The main variables in this experimental program are nominal concrete compressive strength (43, 72 and 97 MPa), bonded and unbonded tendons and prestressing index (0%, 70% and 100%). Theoretical analysis using rational approach was also carried out to predict the flexural behavior of the specimens. Evaluation of the analytical work is introduced and compared to the results of the experimental work.
Introduction
The development of reliable prestressing techniques has certainly been an important innovation in the field of structural concrete. It enabled concrete construction to compete successfully within areas that had previously been dominated by steel constructions, including long span bridges, high rise buildings, pressure vessels and offshore structures. Today, prestressing and, in particular, post-tensioning is a mature technology, providing efficient, economic and elegant structural solutions for a wide range of applications. The difference between fully and partially prestressed concrete beams is referred to the allowable permissible tension stresses [Citation1]. Fully prestressing is defined as a complete elimination of tensile stresses in members at full service load or allow small tension stresses, which can be resisted by concrete only, while partially prestressing allow for higher tension stresses in concrete and cracking under full service loads [Citation2,Citation3]. In this research, the partially prestressed concrete beams were achieved with a combination of prestressed and non-prestressed reinforcement while fully prestressed concrete beams contained prestressed reinforcement only. Manalip et al. [Citation3], studied the behavior of the compression zone of reinforced and prestressed HSC elements and concluded that HSC has a brittle behavior in case of specimens subjected to axial compression, while different behavior was observed for reinforced or prestressed beams. It was also reported that use of HSC results in doubling the plastic rotation capacity, for reinforced or prestressed concrete beams subjected to pure flexural stresses.
| Notation | ||
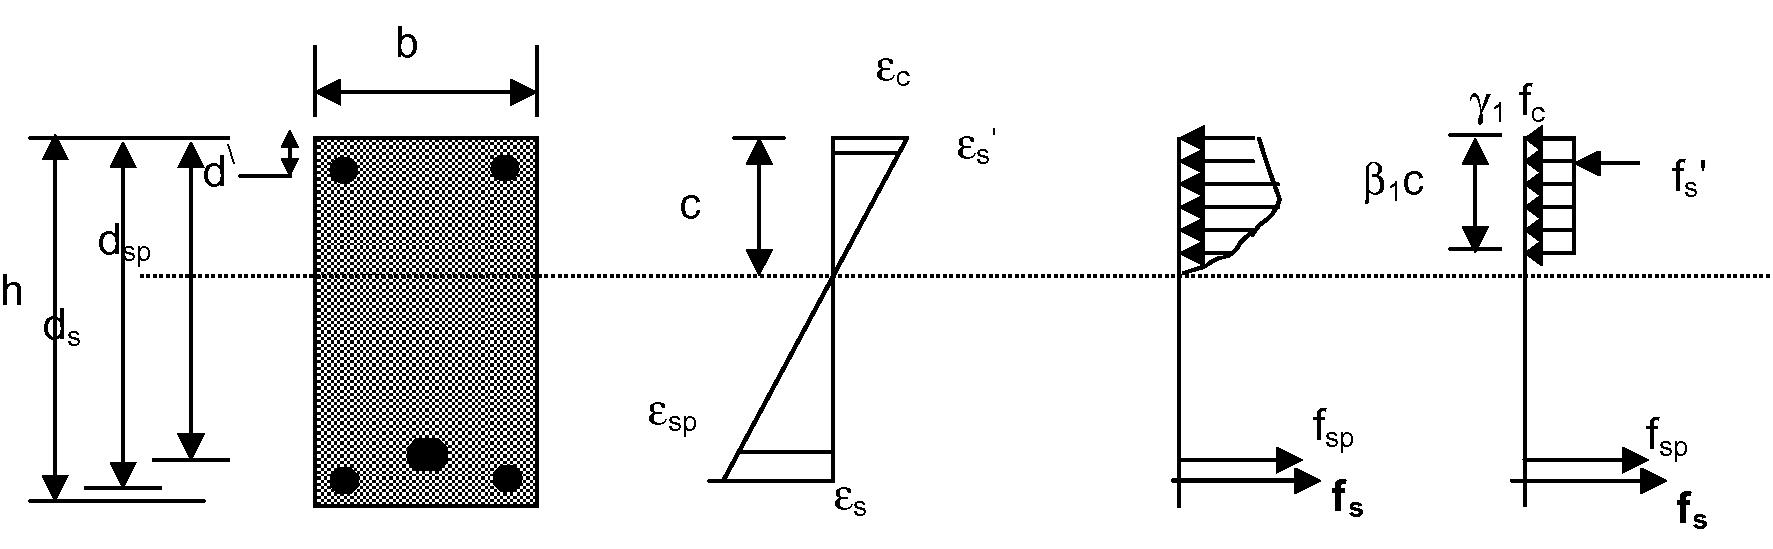
| = | area of non-prestressing compression reinforcement Fig. 7a Test set-up. 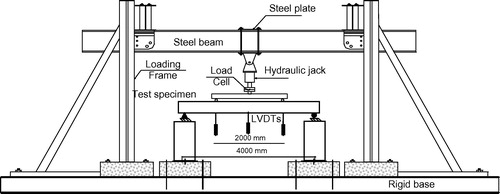 Fig. 7b Test set-up of beam specimens. 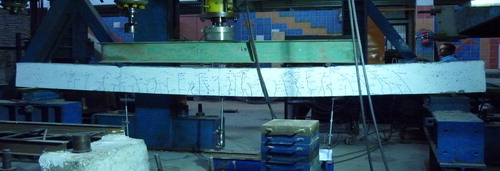 | |
| As | = | area of non-prestressing tension reinforcement |
| b | = | width of section |
| c | = | neutral axis depth from the extreme compression fiber in concrete |
| dp | = | distance from extreme compression fiber to centroid of prstressed reinforcement |
| dp | = | depth of prestressing reinforcement from extreme compression fiber |
| ds | = | depth of non-prestressing reinforcement from extreme compression fiber |
| Eps | = | modulus of elasticity of prestressing reinforcement |
| fps | = | stress in prestressing reinforcement at ultimate |
| fse | = | allowable prestressing stress at time of transfer |
| = | concrete compressive strength | |
| fy | = | yield stress in non-prestressing reinforcement |
| f | = | coefficient with regard to the loading type = 3 for two point loading or uniform loading |
| fpy | = | yield stress of the prestressing reinforcement |
| K | = | 100 for L/d ≤ 35; K = 300 for L/d ≥ 35 |
| L | = | span |
| L1 | = | the sum of lengths of loaded spans containing tendons |
| L2 | = | total length of tendons between anchorages |
| ɛcu | = | assumed failure strain of concrete in compression = 0.003 |
| ρps | = | ratio of prestressing reinforcement Aps/bdp |
| Ωu | = | strain reduction factor |
Use of high strength concrete is considered a modern trend in construction. Many researchers have investigated experimentally and theoretically high strength concrete members. Compared to normal strength concrete, high strength concrete has several advantages. For example, it is characterized by a high density, strength, as well as, good workability. Combining the advantage of using HSC with prestressing shall result in more durable and elegant structures. Moreover, the use of replaceable unbonded tendons allows for future upgrade, maintenance, and rehabilitation of concrete structural elements. In case of bonded prestressed beams, the stress changes in the prestressing steel can be determined from the strain compatibility between concrete and steel, which means that the analysis is section dependent. However, in case of beams with unbonded tendons, it is necessary to formulate the global deformation compatibility between the anchorages of tendons. The stress change in tendon is member dependent and is influenced by initial cable profile, span to depth ratio, deflected shape of the structure and beam end conditions. This makes the analysis of beams with unbonded tendons more complicated. ACI 423.7-07 [Citation4] presents recommendations for materials, design, and construction for concrete structures prestressed with unbonded tendons. Since the early 1950s, many experimental and analytical researches have been conducted to evaluate the stress at ultimate in unbonded tendons such as:
| (1) | The ACI-ASCE committee 423.7-07 [Citation4] proposed the following equation:
| ||||
| (2) | Namman et al. [Citation5] proposed the following equation to accommodate many of the factors, which were ignored in the ACI equation such as the combined presence of reinforcing and prestressing steel in partially prestressed members, type of tendons either steel or FRP, span to depth ratio, loading conditions, loaded spans, and the effect of the elastic modulus of the used prestressing tendons.
where: for simply supported beam with uniform loading L1 = L2 | ||||
| (3) | Lee et al. [Citation6] proposed the following equation to take into consideration plastic hinge length and effect of bonded reinforcements.
| ||||
| (4) | Ozgur et al. [Citation7] presented the generalized incremental analysis GIA, which is an incremental loading procedure that can be applied at various load levels to calculate unknowns in a prestressed beam with unbonded tendons or a combination of bonded and unbonded tendons. | ||||
This paper presents an experimental investigation to investigate the difference in the behavior between partially prestressed concrete beams with bonded and unbonded tendons having various compressive strengths (43, 72 and 97 MPa). In addition, this research investigats the difference between partially and fully prestressed concrete beams using bonded tendons with various compressive strengths (72 and 97 MPa) and comparing the results with reinforced concrete beams. The program consists of a total of nine rectangular beams with overall dimensions equal to 160 × 340 × 4400-mm. Modes of failure, ultimate capacities, deflections and strains of the main reinforcement and concrete at mid-span for each specimen were examined. Strain compatibility approach was used to predict the ultimate carrying capacity of the beams that reinforced with bonded prestressing strands. ACI-ASCE committee 423.7-07 [Citation4], Naaman et al. [Citation5] and Lee et al. [Citation6] equations were used in this research to predict the ultimate strength of the partially prestressed beams with unbounded tendons. Deflection of the beams was calculated using integration of the curvature along the span of the beams.
The experimental work
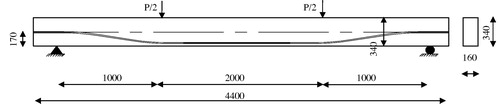
The experimental program consists of nine prestressed and non-prestressed beams with overall depth, width and length of 340, 160 and 4400-mm, respectively, as shown in . The beams were simply supported with a clear span of 4000-mm. The flexural non-prestressed steel and steel stirrups were made of deformed high tensile steel with yield stress of 470 MPa and ultimate strength of 610 MPa. The top longitudinal reinforcement of the specimens was two 10-mm diameter bars with a ratio of 0.29%. The stirrups were 10-mm diameter bars every 200 and 100-mm at mid-span and beam ends, respectively, with a volumetric percentage of 0.34% and 0.68%, respectively. The concrete cover of the stirrups was 25-mm.
Fig. 1 Concrete dimensions and cable profile of prestressed beams.
The selection of mixture properties for normal and high strength concrete was based on several trail mixes and their dry-cured 28-day compressive strength. The average dry-cured 28-day compressive strengths of the selected mixes were 43, 72 and 97 MPa.
The main reinforcement of the specimens changed according to the prestressing index (ip), which was defined as the ratio of the yield strength of the prestressing reinforcement to the sum of the yield strength of the prestressing and non-prestressing reinforcement, as given by the following equation [Citation9]:(4)
(4)
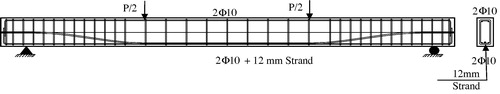
One strand with diameter 15.24-mm was used to reinforce the fully prestressed beams, one strand with diameter 12-mm in addition to two 10-mm diameter non-prestressed bars were used to reinforce the partially prestressed beams and six 10-mm diameter bars were used to reinforce the non-prestressed beams, as shown in , . The yield and ultimate stress of the prestressing steel strands were 1674 and 1860 MPa, respectively.
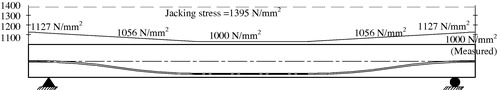
The prestressing steel strand had a profile similar to the bending moment induced from the concentrated loads, as shown in . Additional horizontal stirrups were added at the anchor zone to resist the splitting force; these stirrups were calculated according to the recommendation of the ACI code [Citation1]. The prestressing strand was placed inside a polyethylene duct and fixed with the beam stirrups using horizontal steel chairs, as shown in . The grouting fitting was placed at distance of 300 mm from each side of beam. The prestressing force was applied at both ends of each beam using 250 kN jack capacity after the concrete reached an age of 28 days on four steps up to 1395 MPa stress level, which is equal to 75% of the ultimate stress for bonded and unbonded strands, as shown in . During prestressing, the strand elongation was measured using digital measurement tool with accuracy of 0.01 mm and the prestressing force was monitored by load cells with 250 kN capacity. presents the measured and the calculated force based on the measured elongation taking into consideration the friction losses. also includes the measured elongation of each specimen. The specimens with bonded strands were grouted under pressure using grout with 36 MPa compressive strength, as shown in .
Fig. 3 The prestressing strand placed inside the polyethylene duct.
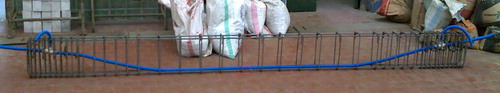
Fig. 4 Application of the prestressing force.
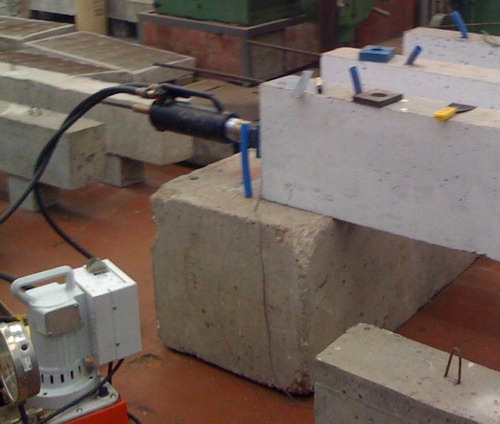
Fig. 5 Grouting process.
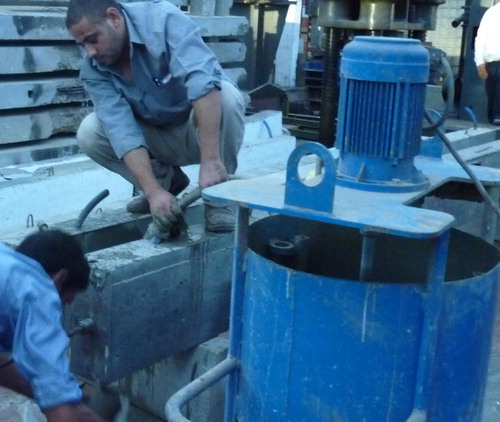
Table 1 Experimental program for beams.
shows the calculated and measured prestressing force along the beam span.
Fig. 6 The calculated and measured prestressing stress along the beam span for Partially prestressed beam with compressive strength 72 MPa.
Test specimens
The variables considered in this study, were concrete compressive strength (43, 72 and 97 MPa), bonded and unbonded tendons and prestressing index (0%, 70% and 100%), as given in . The details of the tested specimens are as follows:
| □ | Specimens B1 and B4 had six 10-mm diameter non-prestressed bars installed in two layers, as shown in . The volumetric percentage of non-prestressed bars is 0.87%. The concrete compressive strength of these specimens was 72 and 97 MPa, respectively. | ||||
| □ | Specimens B3 and B6 had one strand with 15.24-mm diameter, as shown in . The volumetric percentage of prestressed bars is 0.26%. The concrete compressive strength of these specimens was 72 and 97 MPa, respectively. | ||||
| □ | Specimens B2, B5, B7, B8 and B9 had one strand with 12-mm diameter and two 10-mm diameter non-prestressed bars, as shown in . The volumetric percentage of prestressed and non-prestressed bars is 0.18 and 0.29%, respectively. The concrete compressive strength of specimen B7 was 43 MPa, while for specimens B2 and B8 was 72 MPa. Specimens B5 and B9 had concrete compressive strength equal to 97 MPa. The specimens B2 and B5 were reinforced with bonded prestressing strands, while specimens B7, B8 and B9 were reinforced with unbonded prestressing strands. | ||||
Fig. 2a Reinforcement details of non-prestressed beams.
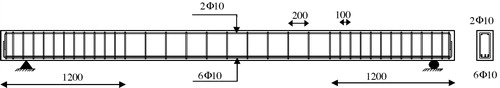
Fig. 2b Reinforcement details of fully prestressed beams.
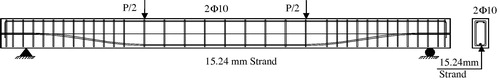
Fig. 2c Reinforcement details of partially prestressed beams.
Test set-up
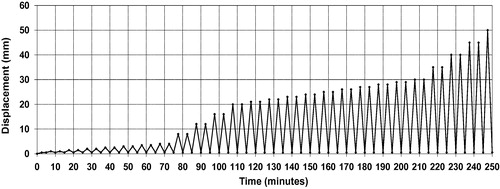
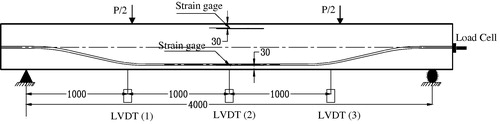
The beams were subjected to a cyclic loading up to failure using a hydraulic machine of 300 kN capacity. The load was measured using a load cell of 1000 kN capacity, as shown in . Two concentrated loads at 1000 mm from mid span were applied on the beam using a stroke control system. The cyclic loading was achieved by increasing the stroke at 0.5-mm increments up to 4 mm, 4 mm increments up to 20 mm, 0.5 mm increments up to 40 mm, 5 mm increments up to 100 mm and finally with 10 mm increments. Two cycles were applied at each load increment, as shown in . The data was collected using a data acquisition system and “lab view” software at a rate of 1 sample per s.
Fig. 8 Cyclic loading pattern.
The longitudinal and transverse strains of the specimens were measured by two different methods; linear variable differential transducers, (LVDT), and electric strain gauges. The strains of non-prestressed steel reinforcement were measured in the longitudinal direction. Deflection was measured at the mid-span and under the concentrated loads. shows location of the different instrumentations.
Fig. 9 Location of the different instrumentations.
Experimental results
The parameters used in this study are the concrete compressive strength, the prestressing index and bond of the prestressing strands. Effect of the concrete compressive strength is presented by the specimens B1 and B4, B2 and B5 as well as B3 and B6 for non-, partially and fully bonded prestressed beams, respectively. In addition specimens B7, B8 and B9 present the effect of the concrete compressive strength for partially unbonded prestressed beams. Effect of the prestressing index is presented by the specimens B1, B2 and B3 as well as B4, B5 and B6 for concrete compressive strength equal to 72 and 97 MPa, respectively. Effect of bond of the prestressing strands is presented by the specimens B2 and B8, B5 and B9 for concrete with compressive strength equal to 72 and 97 MPa, respectively. summarizes the experimental results: the cracking load Pcr at the mid span and the corresponding vertical deflection Δcr, the maximum load Pmax and the corresponding vertical deflection Δ, the yielding load and the corresponding vertical deflection Δy and the vertical deflection at failure Δu. The table also shows the initial stiffness, which represented by the slope of load deflection curve before cracking, post cracking stiffness, which represented by the slope of load deflection curve after cracking up to yielding of reinforcement and the modes of failure for the tested beams.
Table 2 Experimental results.
Naaman and Jeong [Citation8] defined the ductility of the prestressed beams using uploading path of the load deflection relationship of concrete beams. The proposed ductility index given by Eq. (5) is based on the elastic and inelastic energies released at failure. The elastic and inelastic energies released at failure (Eel, Einel, Et) were calculated based on the area under the load deflection relationships of beams. The cyclic loading carried out for each specimen was used to calculate the energies. Failure load is defined as 80% of the maximum load measured on the descending branch of the curve.(5)
(5)
Most common ductility index calculation method presented by Park and Pauley [Citation10] is as follow:(6)
(6)
The ductility factor was calculated with both methods and the results were evaluated. shows ductility index.
Table 3 Ductility index.
Crack pattern and failure modes
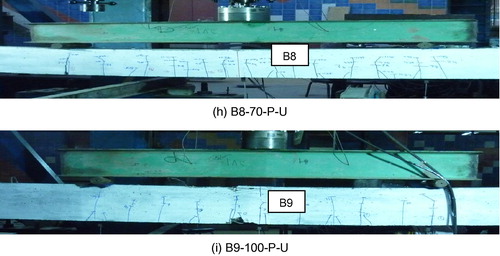
Failure of all non- and partially prestressed specimens started by yielding of the main bottom steel reinforcement followed by crushing of concrete at the top surface. At onset of concrete crushing, the top reinforcement buckled and the stirrups were exposed. Sudden collapse was observed for specimens B3 and B6, which were reinforced with prestressing strands only due to rupture of the steel strand after crushing of the concrete top chord. Failure modes of the non- and partially prestressed beams were more ductile than that of fully prestressed beams. This is mainly due to the ductility of the non- prestressed steel reinforcement. The crack pattern of the non- and partially prestressed beams in the region between the two concentrated loads was distributed along this length with small width and large number, as shown in a, b, d and e, compared to the fully prestressed concrete beams in the same region, where the cracks were few and with large width as shown in c and f. This is again due to the presence of non-prestressed steel in the non- and partially prestressed beams, which it controls the cracks in the tension zone. In unbonded prestressed beams the crack pattern was the same as in non- and partially prestressed beams with bonded tendons having distributed cracks along the beam length between the two concentrated loads with small width and large numbers as shown in g–i.
Fig. 10 Failure modes of tested specimens.
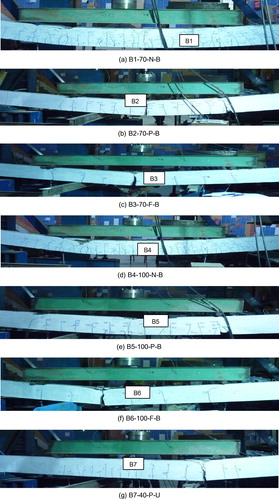
According to the pervious observations the non-prestressed steel improves serviceability of the beams, because it decreases the crack width and distributes it along the beam length. In addition, the small crack width produces lower stress concentration at the location of cracks. These results are complying with those given in the literature for the prestressed beams with different prestressing indices.
Discussion of the experimental results
The load deflection curves for all tested beams are given to discuss the effect of prestressing index, grouting and the concrete compressive strength. Results are presented through –.
Effect of prestressing index
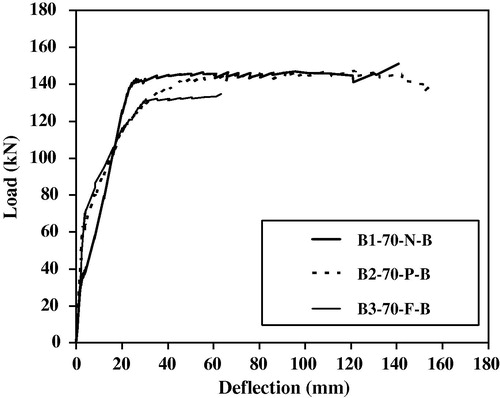
shows the load-deflection of beams B1, B2 and B3 with prestressing indices of 0, 70 and 100, respectively and average concrete compressive strength equal to 72 MPa. The cracking loads of the specimens B1 and B2 were lower than B3 by 53% and 9%, respectively. This is due to the prestressing force effect, which concludes that the cracking loads increase by increasing the prestressing level. The maximum loads of specimens B1 and B2 were higher than B3 by 13% and 10%, respectively. The slight difference in the failure load is attributed to the little variation in the designed cross section of partially, fully and non-prestressed concrete beams based on the commercially available prestressed and non-prestressed reinforcement in Egypt. The maximum deflection at the failure load of specimens B1 and B2 were higher than B3 by 223% and 239%, respectively. This is due to the presence of non-prestressed steel, which is more ductile than the prestressing reinforcement.
Fig. 11 Load deflection relationship for specimens B1-70-N-B, B2-70-P-B and B3-70-F-B.
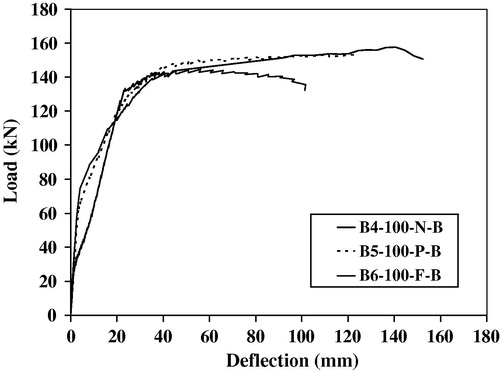
shows the load-deflection of beams B4, B5 and B6, with prestressing indices of 0, 70 and 100%, respectively and average concrete compressive strength equal to 97 MPa. This figure presents the same conclusions that were presented by for beams with compressive strength 72 MPa. The cracking loads of specimens B4 and B5 were lower than B6 by 47% and 10%, respectively and the maximum loads of specimens B4 and B5 were higher than B6 by 8% and 6%, respectively. The maximum deflection at the failure load of specimens B4 and B5 were higher than B6 by 149% and 119%, respectively.
Fig. 12 Load deflection relationship for specimens B4-100-N-B, B5-100-P-B and B6-100-F-B.
The initial stiffness of the fully and partially prestressed beams was higher than that of non-prestressed beam. This is due to the presence of the prestressing force, which delays the concrete cracking. The opposite phenomena were observed after cracking, where the post-cracking stiffness was higher for non-prestressed beam than that of the fully and partially prestressed beams. This is due to the larger area of non-prestressed in B1 and B4 compared to other beams. In the tested specimens, the initial stiffness of partially prestressed beam was slightly higher than that of fully prestressed beam. This slight increase can be explained by the effect of non- prestressed steel, which overcome the effect of the difference in the prestressing force between partially and fully prestressed beams.
For beams with 72 MPa average compressive strength, the initial stiffness of the non-prestressed beam B1 was 304% and 278% lower than that of partially (B2) and fully (B3) prestressed beams, respectively. The initial stiffness of partially prestressed beam B2 was higher than that of fully prestressed beam B3 by 10%. In post cracking stiffness, non-prestressed beam B1 was higher than that of B2 and B3 by 184% and 194% respectively, as shown in .
For beams with 97 MPa average compressive strength, the initial stiffness of the non-prestressed beam B4 was 223% and 199% lower than that of partially (B5) and fully (B6) prestressed beams, respectively. The initial stiffness of partially prestressed beam B5 was higher than that of fully prestressed beam B6 by 12%. In post cracking stiffness, non-prestressed beam B4 was higher than that of B5 and B6 by 163% and 195% respectively, as shown in .
Ductility of partially prestressed concrete beams B2 and B5 were higher than that of the fully prestressed concrete beams B3 and B6 by 249% and 124%, respectively. This increase in ductility was due to the presence of non-prestressed reinforcement. Using of non-prestressed reinforcement in partially prestressed beams enhanced the ductility and also control crack formation and reduce the crack width at service loads.
Effect of grouting
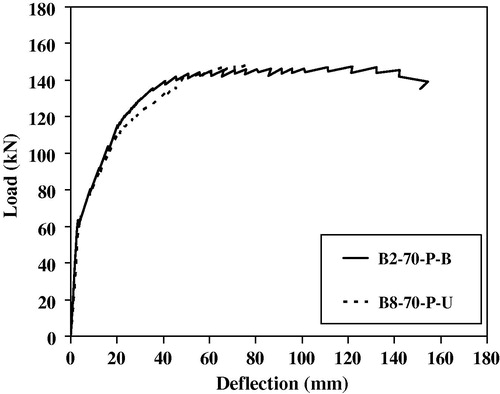
shows the load-deflection of beams B2 and B8 to compare the partially prestressed beams with bonded and unbonded tendons of beams with average concrete compressive strength equal to 72 MPa. The presence of grout validates the fact that plane sections remain plane after bending and the stress distribution is linearly related across the concrete section. The cracking loads of specimens B2 and B8 were almost the same 64 and 63 kN, respectively. The maximum loads of specimens B2 and B8 were the same 148 kN. The effect of grouting appears obviously in the maximum deflection at failure load, which was higher in the bonded beam B2 than B8 by 199%. This can be translated automatically in increase in the ductility of B2 than B8 by 265%. The initial stiffness of B2 was higher than B8 by 13%, due to presence of grouting.
Fig. 13 Load deflection relationship for specimens B2-70-P-B and B8-70-P-U.
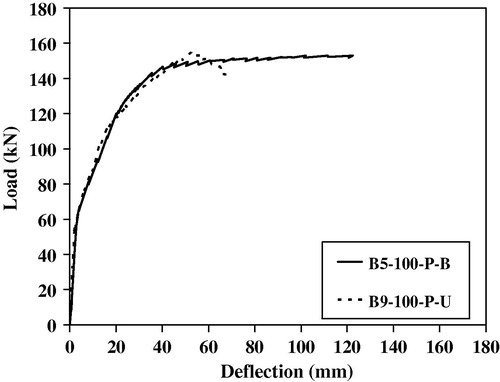
shows the load-deflection of bonded and unbonded beams B5 and B9 with average concrete compressive strength equal to 95 MPa. This figure presents the same conclusions that were presented by in the previous statement. The cracking loads of B5 and B9 were also almost the same 67 and 65 kN. The maximum loads of the specimens B5 and B9 were almost the same 153 and 155 kN. The maximum deflection at the failure load was higher for B5 than B9 by 173% and the ductility of B5 was higher than B9 by 217%. The initial stiffness of B5 was higher than B9 by 6%.
Fig. 14 Load deflection relationship for specimens B5-100-P-B and B9-100-P-U.
Effect of compressive strength
shows the load-deflection of beams B1 and B4 with concrete compressive strength 72 and 97 MPa, respectively. The increase in the concrete compressive strength from 72 MPa to 97 MPa led to an increase in the maximum load by only 4% and in the cracking load by 18%. The maximum deflection at the failure load of the specimen B4 with higher compressive strength was higher than B1 by 8%. The initial stiffness of beam B4 was higher than that of B1 by 48%, as well as post-cracking stiffness for B4 was higher than that of B1 by 2%.
Fig. 15 Load deflection relationship for specimens B1-70-N-B and B4-100-N-B.
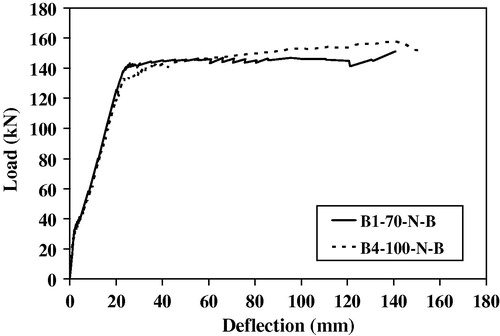
The ductility index μΔ for B4 with higher compressive strength was lower than that of B1 by 5%, which complies with the conclusion made by Naaman and Jeong [Citation8], that the significant increase in the compressive strength of concrete may lead to decrease in member ductility.
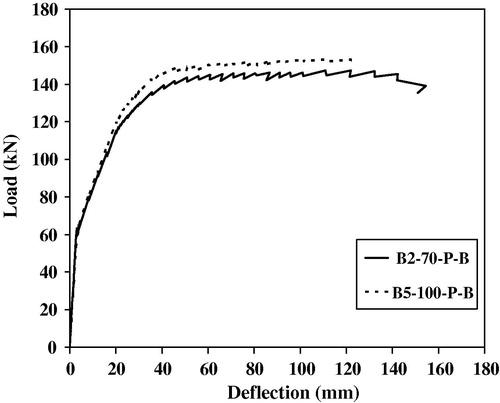
shows the load-deflection of partially prestressed beams B2 and B5 with average concrete compressive strengths 72 and 97 MPa, respectively. This figure presents the same conclusions that were presented by in the previous statement. The maximum load of the specimen B5 was higher than B2 by 4%. The cracking loads of the specimens B5 was higher than B2 by 5%. On the contrary of expected the maximum deflection at the failure load of the specimen B5 was lower than B2 by 20% that is because there was a problem in the machine test during testing this beam. The initial stiffness of beam B5 was higher than that of B2 by 9%. Post-cracking stiffness for B5 was higher than that of B2 by 15%. The ductility index μΔ for B5 was lower than that of B2 by 23%.
Fig. 16 Load deflection relationship for specimens B2-70-P-B and B5-100-P-B.
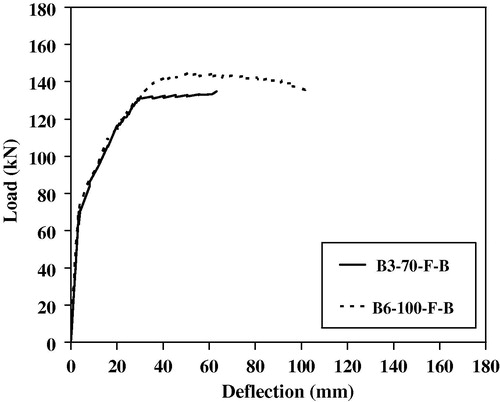
shows the load-deflection of fully prestressed beams B3 and B6 with concrete compressive strengths 72 and 97 MPa, respectively. The mode of failure of fully prestressed beams was premature failure, which means that the failure was mainly due to rupture of prestressing steel strands. The variation in the ultimate strain of steel strands may have led to the results given in the graph, which shows that the maximum deflection of beam with higher fcu B6 is larger than that of beam with smaller fcu B3 by 62%. The maximum load of specimen B6 was higher than B3 by 8%. The cracking loads of specimens B6 was higher than B3 by 6%. The maximum deflection at the failure load of specimen B6 was higher than that of B3 by 62%. The initial stiffness of beam B6 was higher than that of B3 by 6%. The post-cracking stiffness of B6 was higher than that of B3 by 1%.
Fig. 17 Load deflection relationship for specimens B3-70-F-B and B6-100-F-B.
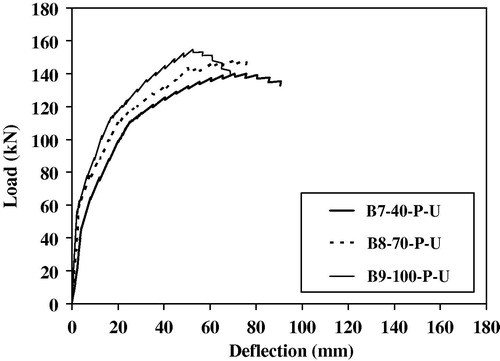
shows the load-deflection of beams B7, B8 and B9, which were studied the effect of nominal compressive strength. This figure presents the same conclusions that were presented by in the previous statement. The maximum loads of the specimens B8 and B9 were higher than B7 by 5% and 10%, respectively. The cracking loads of the specimens B8 and B9 were higher than B7 by 34% and 38%, respectively. The maximum deflections at the failure loads of the specimens B8 and B9 were lower than B7 by 16% and 23%, respectively. This is mainly due to the absence of grouting, which can be seen obviously when increasing of the nominal compressive strength. The initial stiffness of specimens B8 and B9 were higher than that of B7 by 43% and 65%, respectively. The ductility index of specimens B8 and B9 were lower than that of B7 by 25% and 31%, respectively.
Fig. 18 Load deflection relationship for specimens B7-40-P-U, B8-70-P-U and B9-100-P-U.
Theoretical analysis
Beams with bonded tendons
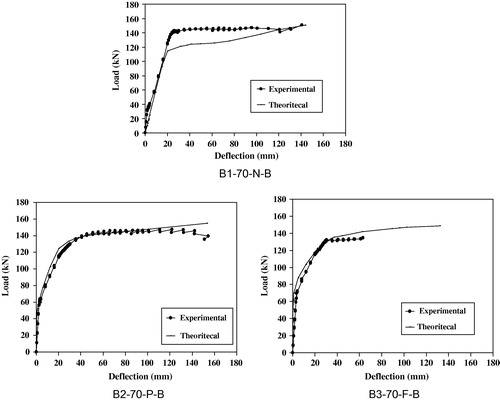
Analysis of the tested specimens was carried out to predict the deformational behavior of partially and fully prestressed high strength concrete beams. Deflections and curvatures at the mid-span sections were calculated. Concrete was modeled using a parabolic stress-strain curve, while steel was modeled using a bi-linear stress–strain relationship. Strain compatibility and force equilibrium were carried out using an iterative process to establish the moment–curvature relationship at each section. For each load increment, the curvature at different sections along the length of the beam was determined. Maximum deflection of the beam was calculated by integration of the curvature from the support section to the mid-span section under the specified incremental load. The stress–strain relationship for the strands is taking into account according to the formula presented by Abdelrahman [Citation9].where: for low relaxation strand with fpu = 1860 MPa, A = 0.03; B = 0.97; C = 102; D = 10.
A very good correlation between the predicted and measured behavior was observed and presented in .
Fig. 19 The measured and predicated load-deflection curves of tested beams.
Beams with unbonded tendons
Namman and Alkhairia [Citation5] proposed the following procedure for beams with unbonded tendons:
| (1) | Calculate the stress in the unbonded tendons at nominal resistance of the beam using ACI equation. Eq.(1) | ||||
| (2) | Apply the force equilibrium equation on the section at nominal bending resistance assuming rectangular section behavior and get equation with unknown “c”.
| ||||
| (3) | Apply in the equation by Naaman et al. [Citation5] to calculate fps Eq. (2). | ||||
| (4) | Solve the two equations simultaneously. | ||||
| (5) | Get the values of C and then get the value of fps | ||||
| (6) | Calculate Mmax theo | ||||
| (7) | Calculate Pmax theo The values of Pmax theo were calculated by ACI, Namaan and Lee equations and the results are presented in . | ||||
Table
The equation presented by ACI to predict fps is based on the past experience with steel tendons and don’t account for a number of important parameters, such as partial prestressing, span-depth ratio, loading conditions loading pattern and the presence of As or its value. According to ACI-ASCE committee 423.7-07 [Citation4], when the fps > fpy use fps = fpy. Accordingly, Pmax was computed using fpy in the ACI and Lee equations. The results were given by Naaman’s equation compared with the experimental results give the lesser value than thought given by the ACI and Lee equations.
Conclusions
From the analysis and discussion of the test results obtained from this research, the following conclusions can be drawn:
| (1) | The partially prestressed concrete beams with bonded tendons provide better behavior than those of undonded tendons such as increase ductility, initial stiffness and the ultimate deflection up to 265%, 13% and 199%, respectively. | ||||
| (2) | Presence of non-prestressed reinforcement in partially prestressed beams enhanced the ductility up to 92% in comparison to that of fully prestressed concrete beams and controlled the crack formation and crack width. | ||||
| (3) | Increasing the nominal compressive strength from 72 to 97 MPa for bonded prestressed beams led to a slight increase in the ultimate and cracking loads by 4% and 18%, respectively. | ||||
| (4) | Increasing the nominal compressive strength from 43, 72 to 97 MPa for unbonded prestressed beams decreased the maximum deflections at the failure loads by 16% and 23%, respectively. | ||||
| (5) | The theoretical analysis based on strain compatibility and force equilibrium gave good prediction of the deformational behavior of non-prestressed, partially and fully prestressed high strength reinforced concrete beams. | ||||
| (6) | The presented equations by ACI, Lee and Naaman to predict fps in unbonded tendons gave good prediction for the maximum stress in the tendons compared with the experimental results up to 95% in ACI and Lee equations and up to 88% in Naaman’s equation. | ||||
Notes
Peer review under responsibility of Housing and Building National Research Center.
References
- ACI Committee 318. Building Code Requirements for Structural Concrete (ACI 318–2008) and Commentary (ACI 318–2008). American Concrete Institute, 2008.
- A.E.NaamanPresressed Concrete Analysis and Design1982McGraw HillNYp.670
- H.ManalipM.PinglotM.LorrainBehavior of the compressed zone of reinforced and prestressed high strength concrete beamsACI Journal1491994209226 (SP149-12)
- ACI Committee 423.7-07. Specification for Unbonded Single-Strand Tendon Materials and Commentary. ACI 423.7-07, American Concrete Institute, 2008.
- A.E.NaamanN.BurnsC.FrenchL.W.GambleH.A.MattockStress in unbonded prestressing tendons at ultimate: recommendationACI Structural Journal9942002518529
- L.H.LeeJ.H.MoonJ.H.LimProposed methodology for computing of unbonded tendon stress at flexural failureACI Structural Journal966199910401048
- O.OzgurH.NassifF.MalhasDeflection prediction and cracking of beams prestressed with unbonded tendonsServiceability of Concrete: A Symposium Honoring Dr. Edward G. Nawy, SP-2252005American Concrete InstituteFarmington Hills, MI93118
- A.E. Naaman, S. Jeong. Structural ductility of concrete beams prestressed of with FRP tendons. in: L. Taerwe, E.F.N. Spon (ed.), Proceeding of The Second International RILEM Symposium, Ghent, Belgium 1995, p. 379–386.
- A.A. Abdelrahman. Serviceability of concrete beams prestressed by fiber reinforcement plastic tendons. PhD Thesis, University of Manitoba, 1995.
- R.ParkT.PaulayReinforced Concrete Structures1975John Wiley and SonsNew York, N. Y.