
 ?Mathematical formulae have been encoded as MathML and are displayed in this HTML version using MathJax in order to improve their display. Uncheck the box to turn MathJax off. This feature requires Javascript. Click on a formula to zoom.
Abstract
Water distribution systems are aging and deteriorating over time. Deterioration of water mains causes reduction in the structural capacity and the hydraulic capacity of the water distribution systems. Municipalities face the greatest challenges to define the deterioration processes and the factors that can affect the rate of deterioration. To face these challenges municipalities need to define methodologies and technologies for water distribution systems planning, design, construction, management, assessment and rehabilitation, that consider local economic, environmental and social factors. Therefore, it is important to implement mitigation measures in a timely manner to extend the useful service life of water distribution systems. This paper presents a model that prioritizes the rehabilitation of water mains as well as assists in rehabilitation technology selection. A series of interviews and questionnaire surveys are conducted to identify the most important factors that affect water mains deterioration and selection of the rehabilitation technology. The weighted factors scoring model is carried out using the Simos’ procedure to develop the priority index model and the alternative evaluation model. The priority index model is integrated with the Geographic Information System (GIS) technology to visualize the condition severity of the water pipes to help the decision maker to decide the course of action. A case study of water mains sample of a set of the collected data for this research has been used to implement the proposed model.
Introduction
Water distribution systems are deemed an important infrastructure system that is used in delivering potable water to consumers. Water distribution systems are aging and deteriorating over time. Each year, hundreds of kilometers of pipes are upgraded and replaced across the world. The Best practice [Citation1] mentioned that the deterioration of water distribution systems becomes evident through the impaired water quality, reduced hydraulic capacity, high leakage rate, and frequent breaks. A wide range of efforts have taken place to contribute in improving the performance of water distribution systems over the past decades. Shamir and Howard [Citation2] developed a procedure to schedule pipe replacement based on the forecasted number of breaks for existing and new pipes, cost of repairing one break and replacing existing pipes, and discount rate. Walski and Pellicia [Citation3] provided a slightly different economic criterion, whereby a pipe should be replaced if its failure rate is above a critical value. Ramos [Citation4] introduced a benefit–cost ratio analysis that can be used to determine whether a pipe should be replaced. Male et al. [Citation5] used a net present value analysis to investigate the best replacement policy or the number of bursts that that should be allowed to occur before replacement is necessary. Rajani and Makar [Citation6] indicated that the decision on the pipe maintenance is typically based on performance indicators that determine the adequacy of water supply in a distribution system. These indicators are structural integrity, hydraulic efficiency, system reliability, and water quality. Al-Barqawi and Zayed [Citation7] developed a condition rating model for underground infrastructure of sustainable water mains based on the intelligent of the neural network by using some of factors influencing water mains deterioration. Wang et al. [Citation8] developed a prediction models for annual break rates of water mains based on the annual break rate, pipe age, length, diameter, depth of installation, and material. The Best practice [Citation1] classified the factors that contribute in water mains deterioration and failure into three categories: (1) physical factors such as: pipe length, pipe diameter, pipe wall thickness, pipe vintage, dissimilar metals, thrust restraint, type of joints, pipe lining and coating, pipe installation, and manufacturing; (2) Environmental factors such as: pipe bedding, trench backfilling, soil type, ground water, climate, pipe location, disturbance, stray electrical current; and (3) operational factors such as: internal pressure, pipe leakage, flow velocity, back flow potential, water quality, and O&M practices [Citation1]. Rajani and Kliener [Citation9] classified the water mains deterioration factors into static and dynamic factors. The former types of factors are static over time due to properties of pipe and installation practices. They include: pipe material, diameter, wall thickness, soil (backfill), and installation practices. Whereas, dynamic factors include replacement rate, protection method, such as catholic protection, and water pressure. The best practice [Citation10] classified water main problems into four types: structural condition, hydraulic capacity adequacy, leakage, and water quality. By reviewing the literature [Citation10-Citation11] water mains rehabilitation technologies are classified into: open cut technology, slip lining technology, cured in place technology, pipe bursting technology, horizontal drilling technology, micro-tunneling technology, internal joint seal technology, spray lining technology, and trenching and repair technology. This paper presents a water main priority index model and alternative evaluation model that aims at improving the water mains performance. To achieve this target, a series of interviews are conducted, questionnaire surveys are designed to identify the most important factors that affect water mains deterioration and technology selection. Also, it presents a weighted scoring factors model that aids in evaluating the rehabilitation technology alternatives The weighted factors scoring model is integrated with the Simos’ procedure to develop the priority index and alternative evaluation models [Citation14-Citation20]. The priority index model is impeded in GIS environment to visualize the condition severity of the water pipes [Citation21].
Research methodology
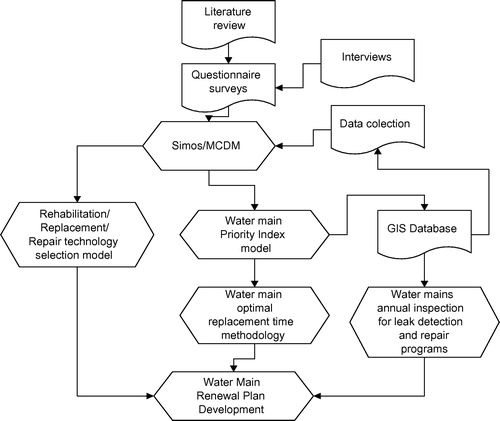
The methodology of the overall research is illustrated in . The developed methodology uses the following steps: literature review, data collection, development of integrated Simos/weighted scoring factors model, development of the water mains rehabilitation technology selection model, development of an expert system for selecting the appropriate technology, and development of water mains renewal plan. Because of size limitation, the presented research in this paper will only focus on developing a water mains rehabilitation priority index model and water mains rehabilitation technology selection model using the following steps:
| 1. | Literature review: the literature includes research works in the field of water distribution systems rehabilitation and replacement, Simos’ procedure, multi-criteria decision modeling, water main rehabilitation technology selection, and the application of geographical information system technology in water mains project management. | ||||
| 2. | Interviews with experts in the field of water distribution systems to get a list of factors that contribute in the deterioration of water mains and a list of factors that contribute in the selection of water mains rehabilitation technology. | ||||
| 3. | Questionnaire surveys to collect data related to water mains rehabilitation priority index model and water mains rehabilitation technology selection model. | ||||
| 4. | Water mains rehabilitation priority index model development. | ||||
| 5. | Water mains rehabilitation technology selection model. | ||||
| 6. | The integration of water mains rehabilitation priority index model and the geographical information technology. | ||||
Fig. 1 Overall research methodology.
Rehabilitation priority index model development
The proposed model was developed by integrating Simos’ procedure and the weighted scoring factors model as shown in . The proposed model is generated mathematically by Eq. (Equation1(1)
(1) ).
(1)
(1) where, PI: is the total weighted score value of the pipe condition severity, Wj: is the jth factor weight, and Cij: is the score of the jth factor of the ith pipe assigned by experts. The proposed model development has been taken place through three stages: (1) factors identification; (2) factors weight by using Simos’ procedure; (3) development of factors system scoring; and (4) development of a classification system for the priority index level. In the factors identification stage, factors that contribute to water mains deterioration was gathered from the literature and reviewed by experts specialists in the water distribution system. In the factor’s weight calculation stage, Simos’ procedure was used for calculating the weight of factors. A questionnaire was designed for collecting the relative weight of factors by asking the experts to rank the factors in ascending order from the least important to the most important factors. The relative importance technique is essential in calculating the factor’s weight by the Simos’ procedure. The non-normalized weight of a factor is calculated by dividing the total sum of the factor’s positions by the number of factors. The normalized weight is calculated by dividing the non-normalized weight by the total position. In the development of factor scoring system, a numerical scoring value from one to five (1–5) is assigned to the factor’s grades which was identified by experts. The factor’s grades were identified by experts, literature and municipality’s references as shown in . The last stage of rehabilitation priority index model development is calculating the priority index (PI) by using Eq. (Equation1
(1)
(1) ). The PI is the total weighted scoring value of the pipe condition severity. The PI values are classified into three levels: high level, medium level, and low level as shown in . The development of the proposed model is presented in detail in the later sections.
Fig. 2 Steps of water mains rehabilitation priority index model development.
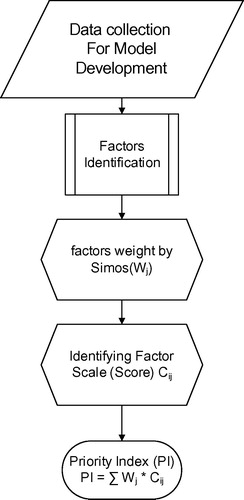
Table 6 Factors weights and grading scale (score).
Table 7 Calculation of the pipe priority index for a water main sample.
Factor’s identification
A list of 26 factors that influence water mains deterioration was gathered from the literature [Citation1Citation[2]Citation3,Citation7] as listed in . These factors are reviewed by ∗∗∗∗expert’s specialists in the field of water distribution systems. A questionnaire survey was designed to gather the importance of each factor. The questionnaire sample size was calculated using Eq. (Equation2(2)
(2) ).
(2)
(2) where;
, p is the ratio of specialized engineers in water distribution systems (2000) to the total civil and mechanical engineers (180,000), and d is the accepted error = 10%. By substituting in Eq. (Equation2
(2)
(2) ), the estimated sample equals 3. In this study, fifty (50) questionnaires have been sent to experts’ specialist in the field of water distribution systems. Twenty-four responses (48%) were received. The main purpose of the questionnaire survey is to identify the degree of importance that each factor influences the deterioration of water mains. The factors were listed as shown in . The expert was asked to assign an important value from one to five for each factor. The value one represents the very low important degree; value two for the low important factor, value three is the medium value, value four for the very important factor, and value five for the most important factor. Screening the gathered factors is an important phase in order to get on a list contains the most important factors that contribute in the water mains deterioration processes. Low important factors have been eliminated. They are those factors whose frequency cells appear in and verification of the equation [(1 + 2 + (0.5 * 3)) ⩾ ((0.5 * 3) + 4 + 5)] was done as reported in [Citation11-Citation12]. The left side of the equation represents the factor’s low important votes of experts and the right side represents the factor’s most important votes of experts. If the left side ⩾ the right side, it means that the factor is low important. Frequency cells reflect the number of votes for each level of importance (from 1 to 5) related to each factor. The number of votes has been gathered from the questionnaire feedback. lists the result of the screening process (importance frequency). The eliminated factors are: (1) pipe vintage factor: the left side of the equation = [(8 + 4 + (0.5 * 1)] = 12.5, the right side of the equation = [(0.5 * 1) + 6 + 4] = 10.5, the left side of the equation > the right side; (2) dissimilar metals factor: the left side of the equation = [7 + 5 + (0.5 * 2)] = 13 and the right side = [(0.5 * 2) + 6 + 4] = 11, the left side > the right side; (3) climate factor: the left side of the equation = [11 + 3 + (0.5 * 3)] = 15.5, the right side = [(0.5 * 3) + 3 + 2] = 6.5, the left side > the right side; (4) disturbance factor: the left side = [3 + 6 + (0.5 * 7)] = 12.5, the right side = [(0.5 * 7) + 1 + 7] = 11.5, the left side > the right side; (5) the seismic factor: the left side of the equation = [14 + 4 + (0.5 * 3)] = 19.5, the right side of the equation = [(0.5 * 3) + 1 + 2] = 4.5, the left side of the equation > the right side; (6) and back flow potential factor: The left side = [4 + 6 + (0.5 * 7)] = 13.5, the right side = [(0.5 * 7) + 3 + 4] = 10.5, the left side > the right side. The final list of the key factors is classified into three categories (clusters) which are; physical, environmental and operational factors as per .
Fig. 3 Final list of the priority index factors.
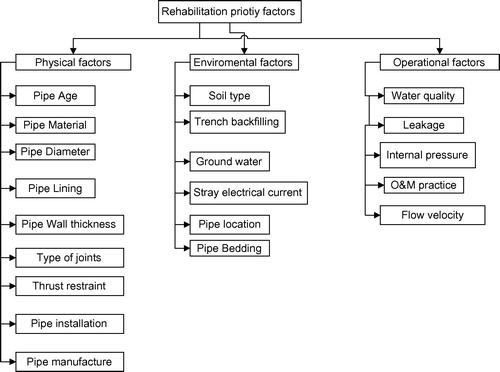
Table 1 Preliminary list of the condition factors for water mains [Citation1].
Table 2 Factor’s frequency of importance (The questionnaire’s feedback).
Factor’s weights by using Simos’ procedure
After having the list of the key factors that contribute in water mains deterioration processes, the relative importance of the remaining factors is obtained. contains the second questionnaire feedback. The relative importance is essential for assigning the weight of each factor. Weights allocation of factors is consequently essential since it will be integrated with a ranking technique. A procedure called the Simos’ procedure has been followed to calculate the weight of factors [Citation13]. The first step in the Simos’ procedure is to get the relative importance of the factors. The second questionnaire is designed to collect the relative importance of the factors. The list of key factors consists of three clusters: (1) physical factors; (2) environmental factors; and (3) operational factors. The expert is asked to rank the physical factors, the environmental factors, and the operational factors from the least important one to the most important one in ascending order from his point of view. The expert is also, asked to rank the main clusters: (1) physical; (2) environmental; and operational in ascending order from his point of view. All responses have been compiled to reflect all assigned relative importance. According to the average column, a sorting process has been performed based on the algorithm of Simos. The results of the sorting process have been added to the Simos’ Rank column in . For example Q1 represents the feedback of the second questionnaire from the first expert. Q1 ranked the physical factors (F1, F2, F3, F4, and F5) in ascending order from the least important to the most important as follows: F3 has the position (1), F1 has the position (2), F2 has the position (3), F5 has the position (4), and F4 has the position (5). Q1 ranked the environmental factors in ascending order as follows: F11 has the position (1), F10 has the position (2), F9 has the position (3), F6 has the position (4), F7 has the position (5), F8 has the position (6). Q1 ranked the operational factors in ascending order as follow: F14 has the position (1), F15 has the position (2), F13 has the position (3), and F12 has the position (4). Q1 ranked the main clusters in ascending order as follows: the operational cluster has the position (1), the environmental cluster has the position (2), and the physical cluster has the position (3). Q2, Q3, Q4, Q5, and Q6 ranked the factors from their point of view. For each factor, the factors’ average relative weight = [Q1 + Q2 + Q3 + Q4 + Q5 + Q6]/6. The Simos’ rank column contains ranking of factors and clusters according to the average column’s values. The first Rank named Rank 1 is assigned for the small average relative weight of a factor in a certain cluster, the second one Rank 2 is the higher average relative weight than Rank 1, and so on. The same steps will be followed for the clusters also as shown in . Factors that have the same average relative weight will take the same rank. In the later section the Simos’ Rank algorithm will be followed to demonstrate the questionnaire feedback in . By reviewing the physical factors in we observe that: the average relative weight of the factor (F1) is 1.8 and took a Rank 1, the average relative weight of the factor (F2) is 1.8 and took the same Rank 1, F3 has 2.3 as average weight and Rank 2, F4 has an average weight 4 and Rank 5, and F5 has 4.2 as average weight and Rank 3. By reviewing the environmental factors in we get: F6 has an average weight 4.5 and Rank 5, F7 has 4.2 as average weight and Rank 5, F8 has an average weight 4 and Rank 3, F9 has an average weight 3.3 and Rank 2, F10 has an average weight 2.8 and Rank 1, and F11 has an average weight 3 and Rank 3. By reviewing the operational factors in we get: F12 has an average weight 2.8 and Rank 2, F13 has an average weight 2.8 and Rank 2, F14 has an average weight 1.8 and Rank 2, and F15 has an average weight 2.5 and Rank 1. By reviewing the main clusters in we observe that : the physical factor cluster has an average weight 2.5 and Rank 3, the environmental factors cluster has an average weight 2.167 and Rank 2, and the operational factors cluster has an average weight 1.667 and Rank 1. The Simos’ Rank for a factor is the position of the factor in the cluster that includes this factor. The Simos’ Rank of a cluster is the position of the cluster relative to the other clusters. Getting weights of factors is the second part in the Simos’ procedure as listed in . Factors that have the same Rank are grouped together in a subset. Attributing a position (in the position column , called weight by Simos) to each factor, subset, and cluster is done as shown in . Determining the non-normalized weight (called average weight by Simos) by dividing the sum of the positions of each factor, subset, and cluster is done as shown in . Determining the normalized weight (called relative weight by Simos) by dividing the non-normalized weight of the factor, subset, and cluster by the total sum of the positions is done as shown in . Normalized weights are written with no decimals. The technique consists of rounding off to the lower or higher nearest integer value (this is a limitation of the Simos’ technique). The global weight of a factor = the relative weight of the factor * the relative weight of the cluster that includes this factor as shown in . The total global weight of fifteen factors is nearest to one as shown in . The pipe lining and coating factor has a global weight of 18%. The lined and coated pipes are less susceptible to corrosion. The condition of pipe’s lining is a parameter of the pipe’s corrosion resistance. The pipe wall thickness factor has a weight (Wj) equal to 13%, where the corrosion will penetrate the thinner walled pipe more quickly. The pipe wall thickness is a parameter of the pipe’s corrosion resistance. The trench backfilling factor (PH) has a weight equal to 11%, where some backfill soils are corrosive. The PH is the parameter of soil corrosivity. The PH measures the soil acidity and alkalinity. The PH ranges from 4 to 8.5. The pipe diameter factor has a weight equal to 9%, where the small diameter pipe is more susceptible to beam failure. The pipe’s diameter is a parameter of the pipe’s resistance to beam failure. The soil type factor has a weight equal to 9%, where some soils are corrosive. The percentage of fine soil is an indicator of soil corrosivity. The percentage of fine soil in sandy soil is 22%, the percentage of fine soil in clayey soil is 45%, so clayey soil is more corrosive than sandy soil. The soil type is a parameter of soil corrosivity. The ground water factor has a weight equal to 6%, where some ground water is aggressive toward certain pipe materials. The PH value is the parameter of ground water aggressiveness. The pipe age factor has a weight equal to 5%, where the pipe is deteriorated over time. The pipe material type factor has a weight equal to 5%. Pipes made from different materials fail in different ways. The water quality factor has a weight equal to 5%, where some water is aggressive, promoting corrosion. The PH value is a parameter of water aggressiveness, which causes the pipe’s corrosion. The break rate factor has a weight equal to 5%, where the pipe break rate is the important indicator of pipe failure. The internal pressure factor has a weight equal to 5%, where the changes to internal water pressure will change stresses acting on the pipe. The pipe bedding factor has a weight equal to 2%, where improper bedding may result in premature pipe failure. The bedding condition is a parameter of pipe beam failure. The operational and maintenance practice factor has a weight equal to 2%, where poor practices can compromise structural integrity and water quality.
Fig. 5 Structural rehabilitation/replacement selection procedure.
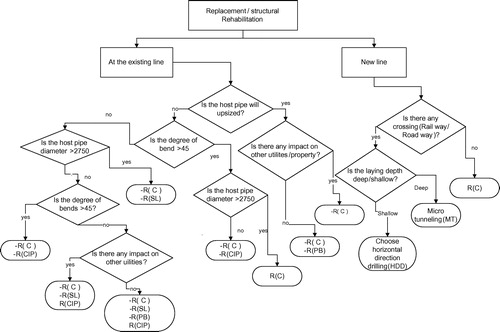
Table 3 Second questionnaire feedback.
Table 4 Factor’s relative weight calculations.
Table 5 Factor’s global weight calculations.
Factor’s system grading scales (scores) development and model implementation
The proposed model is an easy, generic, and flexible model. It is designed by integrating the Simos’ procedure and the weighted scoring factors model as shown in equation (1). The model developed is to be used on MS Excel. The model permits to add or remove any factor depending on the municipality and the project condition. This model aims in the proactive renewal planning of water mains, and minimizes the life cycle costs and risks. This model aims in the bottom-up approach of water mains renewal planning. This model can schedule the replacement activities of water mains. It can be used for resources allocation such as fund. The model contributes to the development of the cost plan of the water mains replacement projects. Based on the literature [Citation4.Citation6,Citation9,Citation17-Citation[18]Citation19], interviews with experts, and municipalities’ references, a system of factor’s grading and practical scales (scores) (Cij) has been developed as shown in . The system identified five grades for each factor. A numerical value (called score) from one to five was assigned to the factor’s grades. The value (score) one was assigned for the least contribution of the factor’s grade in the pipe’s deterioration. The value (score) five was assigned for the most contribution of the factor’s grade in pipe deterioration. For example, the pipe is deteriorated over time, the pipe age factor’s grades were identified in years: (1) <20 years, (2) 20–30 years, (3) 30–40 years, (4) 40–50 years, and (5) >50 years. The expert’s assigned numerical scores, 1, 2, 3, 4, and 5 for these grades respectively. The material types failed in different ways. The pipe’s corrosion is the main parameter of the pipe’s deterioration. The experts identified five grades for pipe material type factor: PVC was assigned score one, Steel assigned score 2, ductile iron assigned score 3, cast iron assigned score 4, and asbestos assigned score 5. Pipe with diameter ⩾300 is less susceptible to beam failure than the small diameter. The pipe’s diameter grades were identified as: >300 mm assigned score one, 300 mm assigned score two, 200 mm assigned score three, 150 mm assigned score four, and <100 mm assigned score five. The pipe lining factor was identified by five grades: excellent lining condition assigned score one, very good lining condition assigned score two, good lined condition assigned score three, fair lined condition assigned score four, and unlined pipes assigned score five. The corrosion penetrates the thinner wall thickness pipe faster than the thicker one. The pipe wall thickness factor was identified by five grades: >30 mm assigned score one, 30 mm assigned score two, 20 mm assigned score three, 15 mm assigned score four, and ⩽10 mm assigned score five. The indicator of the soil type factor is the fine soil percentage by weight, which determines the soil drainage. Soil corrosivity increases with the increase of the fine soil percentage [Citation19]. Corrosivity of the clayey soil is higher than the sandy soil. The soil type factor’s grade was identified as follows: sand assigned score one, silty sand assigned score two, silt assigned score three, silty clay assigned score four, and clay assigned score five. The soil PH is an indicator of soil corrosivity [Citation19]. The trench backfill corrosivity indicator PH was identified by five grades: 7.5–8 assigned score 1, 6–7 assigned score two, 5–4 assigned score three, 4–3 assigned score four, and <4 assigned score five. The ground water aggressiveness indicator (PH) was identified as: 7.5–8 assigned one, 6–7 assigned two, 5–6 assigned three, 4–5, assigned four, and <4 assigned five. The stray electrical current causes corrosion for the metallic pipes. The stray electrical current factor is identified as: not found assigned score one, very low assigned scores two, low assigned score three, high assigned score four, and very high assigned score five. Loads on pipe increase by the increase in the depth of the pipe from the road surface. The pipe location factor identifies in terms of the distance from the road surface as: 1–1.2 m assigned score one, 1.2–1.5 assigned score two, 1.5–1.8 assigned score three, 1.8–2 m assigned score four, and >2 assigned score five. The pipe bedding factor is identified by its condition as: excellent condition assigned score one, very good assigned score two, good assigned score three, fair condition assigned score four, and poor condition assigned score five. The conveyed water quality factor identified in terms of the aggressiveness indicator PH: 7.5–8 assigned score one, 6–7 assigned score two, 5–6 assigned score three, 4–5 assigned score four and <4 assigned score five. The number of break factors were identified as: no-break assigned score one, one break assigned score two, two breaks assigned score three, three breaks assigned score four, and ⩾4 assigned score five. The increase of the internal pipe pressure increases stresses on pipes. The internal pressure factor is identified in terms of its value: >15 m assigned score one, 12–14 assigned score two, 9–12 assigned score three, 6–9 assigned score four, and <6 assigned score five. Operational and maintenance practice factor is identified in terms of its practice: excellent assigned score one, very good assigned score two, good assigned score three, low assigned score four, and very low assigned score five. The last step in the integrated Simos/weighted scoring factor model is to obtain the pipe’s overall rehabilitation priority index (PI) value in a scale of 1–5 by using Eq. (Equation1(1)
(1) ). The priority index value is generated mathematically by multiplying the weight of each factor by its corresponding score value followed by a summation of the multiplication results. A numerical example for calculating the priority index (PI) of a pipe sample has been given in . was designed for generating the mathematical value of the priority index (PI) in MS Excel. contains: (1) factors that contribute in water mains deterioration; (2) data that belong to these factors have been collected from the municipality’s record and engineers; (3) scores were assigned to each factor by experts according to the collected data; and (4) the factor’s adjusted value (Wj * Cij). The priority index PI is the summation of the last column in .
The PI-GIS integration
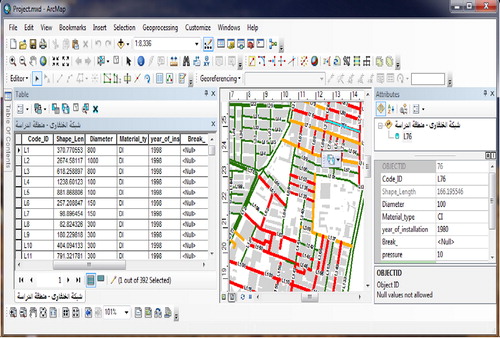
The pipe priority index (PI) is visualized in the Geographic Information System (GIS) to facilitate identification of the pipe’s condition. Three levels of pipe condition severity are considered; High level which is identified by Red color (PI > 4–5), Medium level which is identified by Yellow color (PI > 3–4), and Low level which is identified by Green color (PI 1–3). The results of the priority index model were stored in the MS Excel sheet which exported the results to the geographical information system geodatabase. illustrates the integration of the PI model and the Geographic Information System (GIS) technology for a sample of pipes of the data collected for this research. Such integration enables visualization of the condition severity of the water pipes to enable the decision makers to quickly make a decision either to repair or replace existing pipes.
Fig. 4 The PI-GIS integration.
Rehabilitation technology selection model development
There are several rehabilitation technologies in the literature [Citation11,Citation22]. These include: open cut technology, pipe bursting technology, sliplining technology, cured in place pipe technology, and spray lining technology. In the conventional open cut technology, a new pipe is installed and the water main sizing can be changed. In the pipe bursting technology, the host pipe is replaced by breaking it and inserting another new one. This technology is a full structure technology. The existing pipe can be upsizing by 30% than the old size. In the slip lining technology, the high density polyethylene pipe (HDPE) is used. In the cured in place pipe technology, a fabric tube is impregnated with a thermosetting resin before insertion into the host pipe. In the slip lining technology potential saving cost is less by 30–40% than the open cut technology. In the pipe bursting technology cost is less by 20–30% than the replacement method open cut technology. According to the National Research Council Center of Canada [Citation10], the limitation of the conventional open cut technology includes: (1) traffic disruption; (2) reinstatement cost; (3) environmental impact; (4) social impact; and (5) high safety requirements for the equipment and traffic surface. The limitation of the trenchless technology slip lining includes: (1) the losses in the cross section of the host pipe reduces the hydraulic capacity; (2) it needs excavation pits for water service connections and valves; and (3) is limited to all degrees of bends. The limitations of the pipe bursting technology include: (1) its impact on other utilities; and (2) is limited to the service connections and the degree of bends. The limitation of the cured in place pipe technology includes: (1) excavation pits are required for water service connections and valves; (2) excavation of service connections; and (3) it needs cleaning of the host pipe which means additional cost.
An expert system was developed by the authors to select the appropriate technology for water mains rehabilitation. The expert system has a limitation that it sometimes, preferred more than one technology as shown in and . To overcome this limitation a technology selection model was developed to evaluate the rehabilitation technologies to select the appropriate technology. The weighted scoring factors model is used to develop the proposed model. The model is generated mathematically by using Eq. (Equation3(3)
(3) ). The model consists of three terms: (1) the weight of factor Wj; (2) a factor’s score Sij; and (3) the total score (TS), which is the total sum of the multiplication of the factor’s weight by the factor’ score. A list of seven factors that contribute to selecting water mains rehabilitation technology was gathered from the literature and reviewed by expert’s specialists in the water distribution system. The factors include: (1) technical factors; (2) contractual factors; and (3) cost factors as shown in . Simos’ procedure was used to calculate the weight of factors. A questionnaire has been designed to get the relative importance of the factors. All responses have been compiled to reflect all assigned relative importance. This result has been developed by taking the average of each factor in the questionnaire to calculate the total average relative importance. According to the average column, a sorting process has been performed based on the algorithm of Simos. The result of the sorting process has been added to an additional and final column (Simos’ Rank) as shown in . The non-normalized and normalized weights of factors and clusters have been calculated as shown in . Then the non-normalized weight equals the average of the factor’s positions as shown in . The normalized weight equals the non-normalized weight/total position of the cluster’s factors as shown in . The global weight of factors is calculated by multiplying the cluster weight by the normalized weight of the factor as shown in . lists the current practice grade scales (score) that were identified by experts for each factor. The experts have identified three grade scales for the structural factor belonging to the structural capacity that the technology will give to the water system: full structural, semi-structural, and non-structural. The experts have assigned three scores for the structure’s grades, 10, 6, and 1, respectively. The experts have identified two grade scales for the hydraulic capacity factor belonging to the hydraulic capacity the technology will give to the water system: adequate capacity, and inadequate capacity. The experts assigned two scores for the two grade scales as, 10 and 1, respectively. The experts have identified three grade scales for the technology duration factor comparing to the project’s duration: high, medium, and low. The experts assigned three scores for the three grades: 1, 6, and 10, respectively. The experts identified two grade scales for the local availability (locality) factor belong to the availability of the technology in the market: available, and not available. The expert’s assigned two scores for the availability factor: 10 and 1, respectively. The experts identified three grade scales for the number of years in business factor: low, medium, and high. The experts assigned three scores for the number of years in business factor: 1, 8, and 10, respectively. The experts identified three grade scales for the operational and maintenance cost of the technology: high, medium, and low. The experts assigned three scores for the operational and maintenance grade scales: 1, 6, and 10. The experts identified three grade scales for the technology’s total cost: high, medium, and low respectively. The experts assigned three scores for the total cost grade scales: 1, 6, and 10. The preferred technology is the technology which has the higher total score by applying Eq. (Equation3
(3)
(3) ). A numerical example is illustrated in . In the numerical example, the structural capacity factor (F1) was assigned score 10, the adjusted value of F1 = W1 * S11 = 0.0561 * 10 = 0.561, the adjusted value of the hydraulic capacity factor (F2) = 0.139 * 10 = 1.39, the adjusted value of the technology’s duration factor (F3) = 0.25 * 1 = 0.25, the adjusted value of the local availability factor(F4) = 0.085 * 10 = 0.85, the adjusted value of the number of years in business factor (F5) = 0.165 * 10 = 1.65, the adjusted value of the operational and maintenance cost (F6) = 0.1089 * 5 = 0.5445, and the adjusted value of the total cost factor (F7) = 0.2211 * 6 = 1.3266. The total weighted score value of the open cut technology (TS) = 0.561 + 1.39 + 0.25 + 0.85 + 1.65 + 0.5445 + 1.3266 = 6.57, the total weighted score value (TS) of the slip lining technology = 8.8215, the total weighted scoring value of the pipe bursting technology = 4.8162, and the total weighted scoring value (TS) of the cured in place technology = 8.5265. The cured in place pipe technology is the preferred alternative since it has a larger total score of 8.5265.
(3)
(3) where, TS: is the alternative total score, Wj: is the technology selection factor’s weight, and Sij is the factor’s score that is chosen from .
Fig. 6 Rehabilitation technology selection system interface.
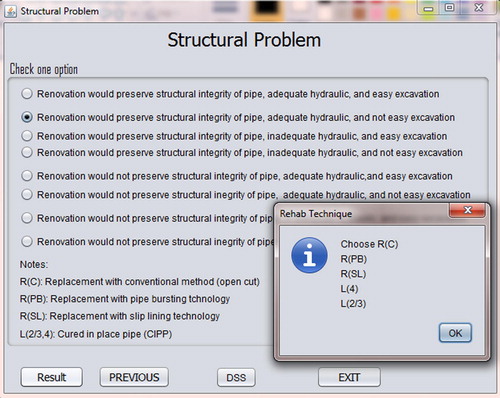
Table 8 Technology selection factors.
Table 9 Questionnaire feedback.
Table 10 Relative weight calculations.
Table 11 Global weight calculation.
Table 12 Factors’ grade scales (score).
Table 13 Rehabilitation technology alternatives evaluation.
Conclusions
This paper presented a water main priority model that aims at improving the performance of water distribution systems. The model was developed by integrating the Simos’ procedure and the multi-criteria weighting factors scoring model. The main purpose of this model is to rank the water pipes according to its condition severity for rehabilitation activities and also funding allocation. The model is easy to use and can be integrated into the GIS technology to improve the monitoring of water distribution systems. The priority model is simple and easy to be use. The model is applied using MS Excel. The priority model can be used to schedule water mains rehabilitation activities and resources allocation such as funds. The priority model can be used to create a water mains rehabilitation cost plan using the bottom-up approach. The paper also presented a model for water mains rehabilitation technology selection. The rehabilitation selection model determines the appropriate technology of water mains rehabilitation or replacement. The rehabilitation technology selection model aims in developing the water mains renewal plan.
Conflict of interest
None declared.
Notes
Peer review under responsibility of Housing and Building National Research Center.
Related Research Data
References
- Best Practices. Deterioration and inspection of water distribution systems. The National Guide to Sustainable Municipal Infrastructure, Ottawa, Canada, 2003, 1(1).
- U.ShamirC.D.D.HowardAn analytic approach to scheduling pipe replacementJ. Am. Water Works Assoc.7151979248258
- T.WalskiA.PelliciaEconomic analysis of water main breaksJ. Am. Water Works Assoc.7431982140147
- W.L. Ramos, “Benefit/cost analysis procedure for determining water main replacement”. Proceedings of American Water Works Association Conference, American Water Works Association, Denver, US, 1985, pp. 125–133.
- W.MaleT.WalskiA.SlutskAnalyzing water main replacement policiesJ. Water Resour. Plann. Manage.11631990362374
- B.RajaniJ.MakarA methodology to estimate remaining service life of grey iron water mainsNation. Res. Council Canada200012591272
- H.Al-BarqawiT.ZayedCondition rating model for underground infrastructure sustainable water mainsJ. Perform. Constr. Facilit.2022006126135
- Y.WangT.ZayedO.MoselhiPrediction models for annual break rates of water mainsJ. Perform. Constr. Facilit.23120094754
- B.RajaniY.KlienerComprehensive review of structural deterioration of water mains: physically based modelUrb. Water332001151164
- Best Practices. Selection of technologies for the rehabilitation or replacement of sections of a water distribution system. The National Guide to Sustainable Municipal Infrastructure, Ottawa, Canada, 2003, 1.
- Best Practices. Developing a water distribution system renewal plan. The National Giude to Sustainable Municipal infrastructure, Canada, 2003, 1.
- M.MarzoukA.A.KherbawyM.KhalifaFactors influencing sub-contractors selection in construction projectsHBRC J.922013150158
- M.MarzoukO.AmerM.El SaidFeasibility study of industrial projects using Simos’ procedureJ. Civil Eng. Manage.19120135968
- G. Kabir, R. Sadiq, S. Tefamariam, “A review of multi-criteria decision-making methods for infrastructure management”. Struct. Infrastruct. Eng. Maint., Manage. Life-Cycle Design Perform. 2013, doi: https://doi.org/10.1080/15732479.2013.795978.
- R.MegB.CrystalPrioritizing pipe rehabilitation projectsNC Curr. Summ.20118487
- M.MarzoukM.OmarMultiobjective optimisation algorithm for sewer network rehabilitationStruct. Infrastruct. Eng. Maint. Manage. Life-Cycle Design Perform.911201310941102
- E.MohamedT.ZayedModeling fund allocation to water main rehabilitation projectsJ. Perform. Constr. Facilit.2752013646655
- H.NajjaranR.SadiqB.RajaniCondition assessment of water mains using fuzzy evidential reasoningProc. IEEE Int. Conf. Syst. Man Cybernet. Waikoloa Hawaii U.S.A.4200534663471
- R.SadiqB.RajaniY.KleinerFuzzy-based method to evaluate soil corrosivity for prediction of water main deteriorationJ. Infrastruct. Syst.1042004149156
- M.MarzoukN.El ShinnawyO.MoselhiM.El-SaidMeasuring sensitivity of procurement decisions using superiority and inferiority rankingInt. J. Inform. Technol. Decis. Making1232013395423
- S. Christodouloi, P. Aslani, A. Deligianni. Integrated GIS-based management of water distribution networks. Joint International Conference on Computing and Decision Making in Civil and Building Engineering, Montreal, Canada, 2006, pp. 858–865.
- Best Practices. Managing infrastructure assets. The National Guide to Sustainable Municipal infrastructure, Ottawa, Canada, 2004, 1(1).