
Abstract
In vivo imaging is becoming an advanced tool for noninvasive distribution of longitudinal small animals. However, the aquatic species have been limited to the optical imaging of noninvasively tracking on pathogen distribution. The purpose of this study was to develop shell-less fish and shrimp models of non-invasive in vivo imaging technique for visualization of pathogens. This experiment was utilized Escherichia coli, Edwardsiella tarda, Vibrio alginolyticus and Vibrio harveyi labeled with fluorescence probes to imaging bacterial distributions by IVIS Lumina LT system. The study was traced the internal distribution of fluorescence probes labeled bacteria in systemic organs by quantified their fluorescence intensities. The ex vivo organ images were showed more obvious fluorescent signal in catfish intestine, liver, heart, kidney and the shrimp showed heart, hepatopancreas, and colon. Hence, the in vivo imaging methods using fluorescent labeled bacterial distribution were suggested to quantify by fluorescence intensity in whole pre-infected subjects. Therefore, it can offer the information about the localization and distribution of pathogens in the preclinical research, after immersion and injections.
1 Introduction
An aquaculture is the fastest growing food-production industry in the world sector, however it is overwhelmed by infectious diseases due to various biological and non-biological agents [Citation1]. The annual economic loss in the aquaculture industry through diseases was estimated to be billions of US dollars in worldwide [Citation2]. Among the groups of microorganisms that cause serious losses in aquaculture, the best known are bacterial strains because of the devastating economic effects they have on affected farms [Citation3]. Predisposition to such outbreaks is often associated with poor water quality, organic loading of the aquatic environment, handling, and transport of fish, marked temperature changes, hypoxia, or other stressful conditions [Citation4,Citation5]. In addition, several potential biological contaminations of aquaculture products can occur from bacteria, viruses, parasites and biotoxin causing zoonotic infection every single year [Citation6]. These pathogens cause transmitted diseases as the result of a massive progeny amplification that follows exposure to various forms of the environment or physiological stress. The diagnosis of these pathogens is carried out by isolation from the infected tissues in pure culture and identification of the bacterial strains [Citation7].
However, the pathogen is often present within the infected site; it is occasionally undetectable, despite the persistence of immunological symptoms [Citation8]. To address the complexity of the chronic infections of bacterial pathogens, a number of mammalian infection models have been developed [Citation9]. Most of them rely on the injection of E. coli, or other bacteria, directly into the tissues. Here, we confirm that the injection of pathogenic strain Gram-negative bacteria E. coli (B2) tracing in vivo imaging in catfish. Further, Edwardsiella tarda (E. tarda) is one of major fish pathogen producing the disease known as edwardsiellosis, also known as enteric septicemia of catfish (ESC) or emphysematous putrefactive disease of catfish (EPDC) [Citation10]. Aquaculture occurs an infection most frequently involves through gills and occasionally the skin [Citation11]. In this phenomenon, here we applied an in vivo imaging of Rhodamine B (RhoB) labeled E. tarda by immersed catfish. An addition, we planned to develop an in vivo imaging of pathogen distribution in the shrimp model.
Moreover, the several epidemiological agents are responsible for vibriosis in shrimp, a disease characterized by slow growth, loss of appetite, and high shrimp mortality [Citation12]. In order to understand complex biological phenomena, to injection and topically acquired bacterial infections caused by V. alginolyticus and V. harveyi, from aquaculture species, and how to noninvasively track them. Substantial evidence supports the importance of infection in the physiopathology of these diseases; however, its exact organ specificity of in vivo imaging is still poorly understood. So, the preliminary information was claimed that aquaculture production and the consumption rate of aquaculture product's increase; the possibility of contracting zoonotic infections from either handling or ingesting these products also increased day by day [Citation13]. Outbreaks are often related to management factors, such as the quality and quantity of nutrients to the water and high stocking density, which can increase bacterial loads on the external surface of the aquatic species [Citation14]. In diseased aquatic species are more likely to transmit an infection to humans. While many clinical applications of optical imaging have been explored, basic research can also benefit tremendously from imaging techniques that provide information about living small animals [Citation15].
Preclinical development in vivo imaging approaches for applying three-dimensional fluorescence images of the internal structures, especially small animals, are procured [Citation16]. In vivo imaging system made a sensitive camera to detect fluorescence emission from different fluorophores in whole-body live small animals [Citation17]. Recent developments in vivo live imaging make it a promising tool for non-invasive imaging of the various internal organs. Therefore, this experiment was planned to describe new imaging methodology, present several ubiquitous and pathogens with specific fluorescent dyes labeling, which we have termed an aquatic species.
2 Materials and methods
2.1 Bacterial culture
The bacterial strains used in this study were E. coli (B2), E. tarda, V. alginolyticus and V. harveyi. These strains were cultivated in different media, including Luria Bertani (LB, used for inoculate E. coli), Tryptic Soy Broth (TSB, for E. tarda), and Thiosulfate Citrate Bile Salts Sucrose Agar (TCBS, for both vibrio strains). LB medium supplemented with 2% NaCl was used for Vibrio pure culture separation. Among the four strains, E. coli stock was utilized from our laboratory Translational Research Platform for Veterinary Biologicals (TRPVB, Chennai, India). E. tarda was obtained from the Tamil Nadu Fisheries University (Chennai, India), and both V. alginolyticus and V. harveyi were obtained from Central Institute of Brackishwater Aquaculture (CIBA; Chennai, Tamil Nadu, India). Cryo-preserved bacterial strains from 10% glycerol stocks were aseptically inoculated in appropriate broth kept at overnight incubation; then the bacterial strains were plated and incubated for 24 h. The single colonies were subsequently transferred and grown in agar plate by overnight incubation (37 °C). The pure bacterial colonies were then transferred to sterile saline and centrifuged at 5000 rpm for 15 min. The pellets were washed twice and finally resuspended in sterile saline. The bacterial densities were determined spectrophotometrically at an optical density (OD) of 600 nm assuming that an optical density value 1.0 corresponds to 109 CFU/mL. As a control, saline was used.
2.2 Catfish and shrimp aquaculture
Healthy white and Albino catfish (length: 12–15 cm and weight: 25–50 g) were obtained from Tamil Nadu Fisheries University in Chennai, India. The fish were kept in quarantine plastic tanks with a follow-through water volume of 500 L (dissolved oxygen 6.0 ± 0.5 mg/L; temperature 28 ± 1 °C) with additions of the aerator and fed with commercial diet twice daily. Adult white shrimp Litopenaeus vannamei (weight 18–20 g and length: 10–12 cm) were randomly obtained from a farm at Central Institute of Brackishwater Aquaculture (CIBA; Chennai, Tamil Nadu, India). The temperature, dissolved oxygen, pH and salinity of the sampling sites were 28 °C, 6.0 mg/L, 8.20 and 20–25 ppt, respectively. All fish and shrimp were acclimatized for one week prior to the experiment.
2.3 Method of bacterial labeling
An amount of 1 × 10⁹ CFU/mL of E. coli, E. trada, V. alginolyticus and V. harveyi was added 10 mL of PBS, pH 7.4 in separate test tubes. After mixing, the bacteria were centrifuged at 5000 rpm for 10 min. FITC (Ex:495; Em:519 nm), Rhodamine B (Ex:571; Em:591 nm), Quantum dots (Ex:425; Em:605 nm) and AUNCs (Ex:560; Em:710 nm) were used 50 µg/mL concentration into each strain of the bacterial pellets and incubated at 4°C for 2 h with continuous shaking. The bacteria were washed thrice with PBS, to confirm the binding stability of the fluorescent probes with these bacterial strains. The OD and fluorescence intensity were measured at 600 nm and its excitation, emission nanometers, respectively. A number of labeled cells should be approximately 109 CFU/mL, which measures around 1 OD.
2.4 Vaccination of fish with E. Tarda
Intraperitoneal (i.p.) injection of 0.2 mL of PBS (control group) and 0.2 mL of inactive E. tarda lysate (vaccination group) was carried out in the selected catfish. Secondary vaccinations were performed to obtain an optimal immune response with the same method and dosage after two-weeks of the first vaccination. After 2-weeks of the secondary vaccination (s.v.), the fishes were used in the experiment by immersion (109 and 105 CFU) of E. tarda-RhoB labeled bacteria.
2.5 In vivo imaging of catfish and shrimps
The IVIS Lumina LT series III (Caliper, MA) was used to determine the fluorescence intensities during the imaging an appropriate excitation and emission filters. Two-dimensional images had the background signal subtracted, and image scaling was normalized by converting total radiance efficiency. Fluorescence intensity was represented by a multicolor scale ranging from blue (least intense) to red (most intense). Signal intensity images were superimposed over gray scale reference photographs for anatomical representations. Scales were manually set to the same values for comparable images to normalize the intensity of the fluorescence across time points. Fluorescence intensity within specific regions of individual animals was quantified using the region of the interest (ROI) tools in the Live Image 4.5 software (PerkinElmer).
For instance, in vivo imaging, two different routes such as immersion, and intraperitoneal injections were used in catfish and shrimp. The immersion route, 109 CFU bacteria were suspended in 1L of brackish water and others two (intramuscular and intraperitoneal) used an injection of 100 µL containing 109 CFU fluorescent probes-labeled bacteria. The both fish and shrimp were exposed for different time points and anesthetized by immersion of Eugenol (50 mg/L; Himedia, India). After imaging, the fishes were sacrificed; the organs were harvested and performed the distribution of fluorescent intensity in fluorescent-probes labeled bacteria. The in vivo transmission of fluorescent intensity was analyzed by using live imaging software (PerkinElmer).
2.6 Statistical analysis
The raw region of interest (ROI), fluorescence intensity and OD values obtained from Live imaging software from IVIS Lumina LT series III (Caliper, MA) and Multimode reader (Tecan Infinite®200, Switzerland) were made into charts for analyzing and the values were expressed Mean ± SD, according to distinctive strains and distinct time points.
3 Results
3.1 Non-invasive imaging of active and inactive E. coli-RhoB in post injected catfish
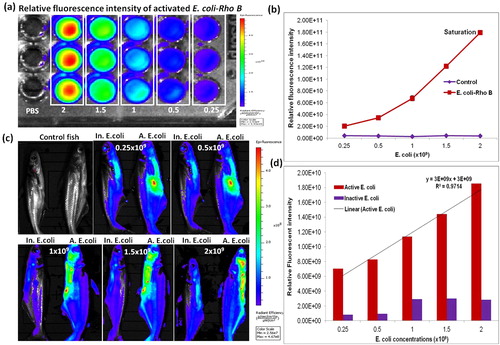
In vivo imaging of catfish an intraperitoneally injected with active and inactive E. coli-Rhodamine B (E. coli-RhoB) labeled bacterial distribution. After 1 h post injection, the fluorescent intensities were increased in RhoB labeled active E. coli (E. coli-RhoB), when compared with inactive E. coli-RhoB. The fluorescent intensity was increased proportionately by different concentration of E. coli strain, which was calculated the relative fluorescence intensity of ROI and optical intensity was shown (&). The result was represented that quantified fluorescent intensity can indicate that distribution of RhoB labeled with active E. coli. At 1 h post-injected catfish fluorescent intensity of E. coli-RhoB was visualized by IVIS Lumina LT system and fluorescence intensity could be represented by multi-color distribution (). Increasing intensity of the multi-color glowing signal was matched by the number of bacteria, which was measured by optical density at 600 nm. These injected bacteria were tracked by fluorescent intensity on the in vivo imaging system to visualizing of bacteria, which reside inside of whole fish is an essential factor for in vivo live imaging (&). After confirmation of fluorescent signal was increased bacterial distribution of RhoB labeled active E. coli, it was injected at different colony-forming units (CFU) of the concentrations versus the fluorescent intensity an each fish was clearly visualized by IVIS analysis system.
3.2 Non-invasive imaging of E. tarda-RhoB post injected catfish
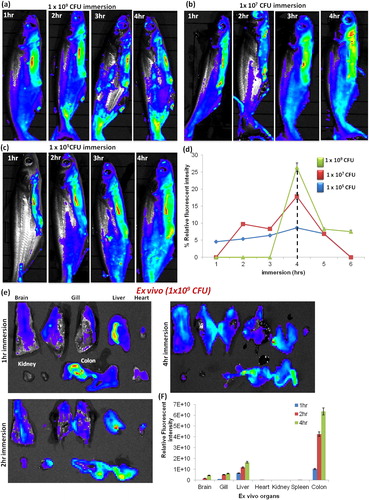
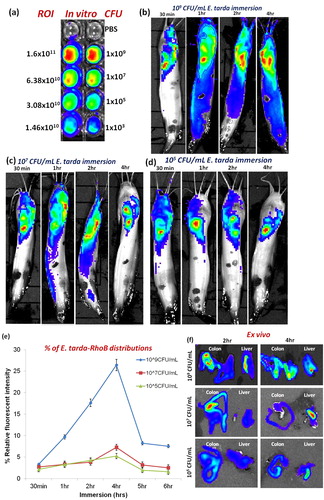
To monitoring the non-invasive in vivo imaging of E. tarda-RhoB distribution on three distinct CFU’s was immersed white catfish with different time points (). In vivo images of E. tarda-RhoB immersed white catfish were comparatively increased the multi-color distributions, which indicate that increased number of bacterial penetration during the three distinct CFU’s at until 4 h time points (-). Similarly, the fluorescence intensity was increased proportionately by E. tarda distribution in a concentrated manner, which was measured the relative fluorescent intensity of ROI levels, upon the 4 h immersion time points (). After that the fluorescent intensity of ROI levels was declined. Finally, the higher CFU (109/mL) concentration of E. tarda-RhoB immersion at 1, 2 & 4 h imaged fish was sacrificed, the ex vivo imaging has performed the group of organs (). The calculated fluorescence intensity was increased during the time course in gill, liver and intestine (colon) of E. tarda-RhoB immersed catfish (), which represent the significant increased multi-color fluorescence intensity of bacteria accumulate to the internal organs. At the same manner, the further experiment was continued to imaging E. tarda-RhoB immersed Albino catfish at distinct CFU’s concentration at different time points, there also identical results were revealed that in vivo and ex vivo fluorescent intensities in bacterial distributions (-).
3.3 Non-invasive imaging of E. tarda-RhoB injected with post vaccinated catfish
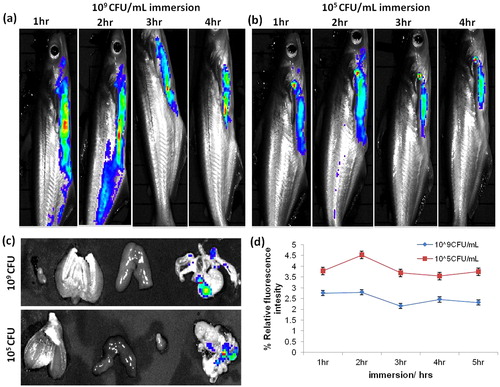
The fluorescence images were shown - compared to non-vaccinated and vaccinated catfish’s fluorescence intensity of bacterial distribution. The vaccinated fish’s decrease the passive entry of bacteria, which indicate that the calculated ROI levels of fluorescent intensity (the multi-color) in both CFU’s immersed fishes was shown in . Therefore, inactivated E. tarda vaccination raised innate immune response against E. tarda and reduced the portal entry via gill and other primary sites of penetration. We find out the immersion fish in E. tarda-RhoB labeled bacteria were passively transported through the gills and spread into the liver and colon. The fluorescent intensity of the bacterial distribution was observed maximum in gills, liver and stomach. However, the amount or the intensity of distribution in different organ was found to be differing.
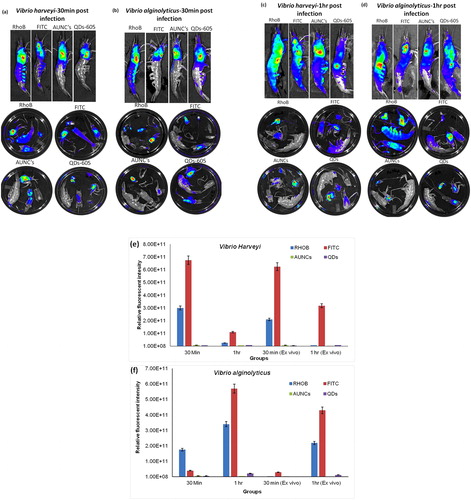
3.4 Non-invasive imaging of V. Alginolyticus and V. Harveyi post injected shrimp
Shrimp was chosen for this preliminary experiment; because it has no hair or shell and is convenient to easily track the fluorescence image non-invasively. Here, we optimized the connection between bacterial loads versus fluorescence signal, an established to determine whether fluorescent probes, which would allow non-invasively quantification of bacterial loads from in vivo imaging system. To determine if the fluorescence intensities are noticeable from shrimp using in vivo imaging, the group of shrimp was injected orally with approximately 109 CFU of V. alginolyticus and V. harveyi labeled with four fluorescent probes FITC, Rhodamine B, Quantum dots and AUNC’s in each bacterial strains. However, fluorescence intensities were noticeable from the whole-body shrimp and extended organs at 30 min and 1 h post injection (-). The images were shown the representative group of shrimp with each fluorescence probe labeled bacterial strains. The fluorescence intensity was represented as multi-color image whereby blue to red represents low to high radiance efficiency respectively. In vivo fluorescence intensity quantification of shrimp with post injected V. alginolyticus and V. harveyi labeled fluorescence probes were shown ( & ). Among the four fluorescence probes, FITC and Rhodamine B fluorescence dye with bacterial labeling efficiency were high, when compared to other two fluorescence probes labeled bacteria injected shrimp in vivo and ex vivo images (-). Further, we confirmed that FITC and RhoB labeled bacterial counts from tissue single cell suspension had maximum fluorescent intensity (Supplementary Fig. 1). Even though the shrimp post co-injected with fluorescent (FITC and RhoB) labeled V. alginolyticus and V. harveyi were distributed in maximum fluorescent intensity through the hepatopancreas with colon and carapace of the heart region in shrimp inner body (Supplementary Fig. 2).
4 Discussion
In this study, we describe the experimental in vivo imaging an aquatic species with host dependent bacterial pre-infection study, to ensuring pathology and rapid bacterial distribution of real-time visualization and quantification of post-injected and immersed shell less catfish and shrimp model. An imaging of events in intact live animals is a powerful approach primarily because it allows studies over time with minimal perturbation of the experiment [Citation18]. Even, the imaging times are shorter and multiple animals can be imaged simultaneously. In addition, the operation of a CCD camera is typically easier than that of other modalities, permitting the use by a non-specialist [Citation19]. Optical imaging of full spectral visible and near infrared (NIR) range, fluorophores are used for labeling biopolymers and derivatizing low molecular weight molecules [Citation20]. Among the various functional groups reactive dyes, amine-containing fluorescent reagents are also used to modify biomolecules, in particular, to labeled glycoprotein ligand. The amine containing fluorophore, RhoB enabling researchers used to detect particular components of complex biomolecular assemblies (including live cells) with exquisite sensitivity and selectivity [Citation18].
The fish and shrimp industry may sustain the selection of bacterial localization in infected specific tissues for sampling in diagnostic confirmation, because of an aquatic species industry big disaster yielded to bacterial and viral infectious diseases [Citation21]. One of the main problems in clarifying the issue on whether the infection is latent or persistent, both in the laboratory and field, is detection. All diagnostic tests have a detection limit, and it is believed that infection can still be present in fish and shrimps, even if PCR results are negative for the specific pathogens (virus and bacterial infection samples) [Citation22,Citation23]. Additionally, appropriate target tissues have to be sampled for detection of latent infections. Pleopod is often collected for PCR analysis because the procedure is nonlethal and ideal for testing valuable aquatic species [Citation24,Citation25]. Therefore, the fish and shrimp real-time in vivo imaging may avoid the false results in the collection of infected samples when the researcher takes from aquatic species. Although, an injected bacterial load was clearly distinguished organ by organ presumably representing integrated RhoB labeled bacterial number in each organ in vivo and ex vivo imaging.
It was clear that fluorescence-labeled bacterial strain was distinguished both on the 96 well plates and in live fishes; however, in vivo tracking was not completely possible only with fluorescence-labeling on the current in vivo imaging methods, due to the bacterial replication, penetration capacity of fluorescence and the intensity of current fluorescence-labeling molecules. Among the fluorescent dyes, RhoB should have high fluorescence quantum and retain the biological activities of the labeled bacteria, when compared to be other dyes with bacterial labeling efficiency. Although RhoB has been successfully applied for single-bacterium distribution in a host, the stability of RhoB labeling remains a big concern due to external labeling method. We, therefore, evaluated the composed of cells stability of RhoB labeled bacteria injected in live fishes were imaged at different time points. The cells stability of fluorescence intensity was increased until 4 h, after that the fluorescence intensity was decline at 5 and 6 h in both examined fishes. Previous studies showed that fluorescent dyes labeled bacteria might not be stable in intracellular compartments, such as lysosomes and peroxisomes activity [Citation26]. The intracellular biothiols have been shown to degrade the monolayer of fluorescent dyes, thereby causing molecular aggregation and loss of fluorescence [Citation27] and enhance progeny bacterial replication. Therefore, these results could support to the conformation of bacterial localization and primary pre-infective site for concerning further vaccination and neutralization an aquatic species in the short time course not applicable for longer finding. The majority of bacterial pathogens are the key factor to initiate chronic infectious disease in live animals [Citation28–Citation30]. Early tracking the portal entry and distribution of bacterial pathogen into the whole body, and internal organ's screening are primary essential needs for an aquatic species.
5 Conclusions
Even though this study has several limitations, the visualizing methods using fluorescent-labeled pathogens can be a good model system to enforce the efficacy tests of vaccines or new drug candidates. Because it can supply related information about the pathogen localization and distribution before infection, but not the good model for pathogen clearance in each targeted organs. This is the preliminary and first report to tracking fluorescent-labeled bacterial distribution by in vivo imaging in shell less catfish and shrimp. Furthermore, we would plan to develop firefly genetic transformation, stronger visualizing signals such as luciferase or optical nanoparticles. The molecular imaging methods for pathogen tracking and clearance could be a highly confident way to evaluate the signal efficacy in the future.
Competing interests
The authors have no conflict of interests.
Authors’ contributions
SR carried out the experiments, assisted with the imaging of the experiments and drafted the manuscript. SR, UA carried out catfish experiment and designed fish study model. SR, ST carried out shrimp experiment and designed shrimp study model. GDR and UA contributed to study design and revised the manuscript. All authors read and approved the final manuscript very carefully.
Supplementary Fig. 1
Download JPEG Image (252.3 KB)
Supplementary Fig 2
Download JPEG Image (513.3 KB)
Acknowledgements
The research leading to these results has received funding from Department of Biotechnology, New Delhi, India to awarded TRPVB-TANUVAS in the scheme of “Animal Biotechnology Career Enhancement Programme” reference No. BT/ADV/90SP10849/2014 under U.S.O.No.50244/G2/2014 & Proc.No. 12061/G2/2014 scheme.
Notes
Peer review under responsibility of Faculty of Veterinary Medicine, Cairo University.
Related Research Data
References
- A.B.ChinenC.M.GuanJ.R.FerrerS.N.BarnabyT.J.MerkelC.A.MirkinNanoparticle probes for the detection of cancer biomarkers, cells, and tissues by fluorescenceChem Rev1151920151053010574
- A.M.DeclercqF.HaesebrouckW.Van den BroeckP.BossierA.DecostereColumnaris disease in fish: a review with emphasis on bacterium-host interactionsVet Res44272013117
- C.I.MartinsL.GalhardoC.NobleB.DamsgardM.T.SpedicatoW.ZupaBehavioural indicators of welfare in farmed fishFish Physiol Biochem38120121741
- D.SaulnierP.HaffnerC.GoarantP.LevyD.AnsquerExperimental infection models for shrimp vibriosis studies: a reviewAquaculture1912000133144
- D.D.NoltingJ.C.GoreW.PhamNear-infrared dyes: probe development and applications in optical molecular imagingCurr Org Synth842011521534
- F.BibiS.N.QaisraniA.N.AhmadM.AkhtarB.N.KhanZ.AliOccurrence of salmonella in freshwater fishes: a reviewJ Anim Plant Sci2522015303310
- P.S.SudheeshA.Al-GhabshiN.Al-MazrooeiS.Al-HabsiComparative pathogenomics of bacteria causing infectious diseases in fishInt J Evol Biol20122012457264
- H.PanP.ZhangD.GaoY.ZhangP.LiL.LiuNoninvasive visualization of respiratory viral infection using bioorthogonal conjugated nearinfrared-emitting quantum dotsACS Nano86201454685477
- H.Y.CaiJ.L.CaswellJ.F.PrescottNonculture molecular techniques for diagnosis of bacterial disease in animals a diagnostic laboratory perspectiveVet Pathol5122014341350
- J.M.JandaS.L.AbbottThe genus Aeromonas: taxonomy, pathogenicity, and infectionClin Microbiol Rev23120103573
- Johnson SK. Handbook of Shrimp Diseases. Department of Wildlife and Fisheries Sciences. Texas A&M University 1995;001:1–27.
- S.HaldaraA.MaharajanS.ChatterjeeS.A.HunterN.ChowdhuryA.HinenoyaIdentification of Vibrio harveyi as a causative bacterium for a tail rot disease of sea bream Sparus aurata from research hatchery in MaltaMicrobiol Res1652010639648
- O.L.HaenenJ.J.EvansF.BertheBacterial infections from aquatic species: potential for and prevention of contact zoonosesRev Sci Tech3222013497
- B.M.PoliFarmed fish welfare-suffering assessment and impact on product qualityItalian J Anim Sci812009139160
- R.A.SperlingW.J.ParakSurface modification, functionalization and bioconjugation of colloidal inorganic nanoparticlesPhilos Trans A Math Phys Eng Sci2010368191513331383
- M.Van OostenT.SchaferJ.A.GazendamK.OhlsenE.TsompanidouM.C.de GoffauReal-time in vivo imaging of invasive- and biomaterial-associated bacterial infections using fluorescently labelled vancomycinNat Commun420132584
- J.ShaJ.A.RosenzweigM.L.KirtleyC.J.van LierE.C.FittsE.V.KozlovaA non-invasive in vivo imaging system to study dissemination of bioluminescent Yersinia pestis CO92 in a mouse model of pneumonic plagueMicrob Pathog5520133950
- V.NtziachristosFluorescence molecular imagingAnnu Rev Biomed Eng82006133
- Pan H, Li WJ, Yao XJ, Wu YY, Liu LL, He HM et al. In situ bioorthogonal metabolic labeling for fluorescence imaging of virus infection in vivo. Small. 2017;13(17).
- N.B.YapiciY.BiP.LiX.ChenX.YanS.R.MandalapuHighly stable and sensitive fluorescent probes (LysoProbes) for lysosomal labeling and trackingSci Rep58576201518
- O.AndreolettiH.BudkaS.BuncicP.ColinJ.D.CollinsA.D.KoeijerFood Safety considerations of animal welfare aspects of husbandry systems for farmed fishEFSA J8672008124
- M.G.Bondad-ReantasoR.P.SubasingheJ.R.ArthurK.OgawaS.ChinabutR.AdlardDisease and health management in Asian aquacultureVet Parasitol1322005249272
- J.W.PridjeonP.H.KlesiusMajor bacterial diseases in aquaculture and their vaccine developmentCAB Rev72012048
- L.H.PhuocM.CorteelH.J.NauwynckM.B.PensaertV.Alday-SanzW.Van den BroeckIncreased susceptibility of white spot syndrome virus-infected Litopenaeus vannamei to Vibrio campbelliiEnviron Microbiol1010200827182727
- L.H.PhuocM.CorteelN.C.ThanhH.NauwynckM.PensaertV.Alday-SanzEffect of dose and challenge routes of Vibrio spp. on co-infection with white spot syndrome virus in Penaeus vannameiAquaculture29020096168
- M.GrossiM.MorgunovaS.CheungD.ScholzE.ConroyM.TerrileLysosome triggered near-infrared fluorescence imaging of cellular trafficking processes in real timeNat Commun7201610855
- X.ChenY.BiT.WangP.LiX.YanS.HouLysosomal targeting with stable and sensitive fluorescent probes (superior lysoprobes): applications for lysosome labeling and tracking during apoptosisSci Rep520159004
- G.P.RichardsBacteriophage remediation of bacterial pathogens in aquaculture: a review of the technologyBacteriophage442014112
- Yanong RPE. Fish health management considerations in recirculating aquaculture systems. UF/IFAS Cir 2015;120.
- Y.L.HernandezD.YeroJ.M.Pinos-RodríguezI.GibertAnimals devoid of pulmonary system as infection models in the study of lung bacterial pathogensFront Microbiol6382015119
Appendix A
Supplementary data
Supplementary data associated with this article can be found, in the online version, at https://doi.org/10.1016/j.ijvsm.2017.09.003.