
Abstract
Highly porous NiO–gadolinium-doped ceria (GDC) nano-composite powders are synthesized by a one-pot glycine nitrate process and applied to the fabrication of Ni–YSZ (yttria-stabilized zirconia)-supported tubular solid oxide fuel cells (SOFCs) with a cell configuration of Ni–YSZ/Ni/Ni–GDC/GDC/LSCF (La0.6Sr0.4Co0.2Fe0.8O3−δ)–GDC/LSCF. The power density of the cell is as high as 413 mW cm−2 at 600 °C, which is 1.37 times higher than that of an identically configured cell fabricated using ball milling-derived NiO–GDC powders (301 mW cm−2). The high porosity of the powders and the good mixing between the NiO and GDC primary nanoparticles due to the abrupt combustion of the precursors effectively suppress the densification, coarsening, and agglomeration of NiO and GDC particles during sintering, resulting in a highly porous Ni–GDC anode layer with good dispersion of Ni and GDC particles and a cell with significantly enhanced power density.
1 Introduction
Solid oxide fuel cells (SOFCs) have been investigated as a promising new power generation method on the account of their high energy-converting efficiency, flexibility in the types of fuels, and low pollutant emission [Citation1]. SOFCs can be classified as planar and tubular structures according to the shape of the cell. Tubular SOFCs are close to commercialization because of their simple gas sealing, the facile production of large-area cells, good stability against thermal cycles, and high mechanical support strength [Citation2]. In particular, the operation of tubular SOFCs at intermediate (600–800 °C) or low (450–600 °C) temperatures is essential for increasing the long-term stability, accelerating the warm-up process, and using cost-effective materials for gas sealants and interconnectors.
Considering the large amount of support materials in anode-supported design, the cost-effective Ni–YSZ (yttria-stabilized zirconia) composite is more advantageous than the Ni–GDC (gadolinium-doped ceria) composite. A highly conductive GDC electrolyte can be used to achieve the operation of SOFCs at low and intermediate temperatures [Citation3]. Direct coating of a thin GDC layer on the Ni–YSZ anode, however, leads to the formation of a resistive secondary phase at the interface by the interdiffusion of Y, Zr, Gd, and Ce components during high-temperature sintering of the GDC layer, causing the deterioration of the overall cell performance. Moreover, the relatively low ionic conductivity of YSZ within Ni–YSZ may affect the catalytic performance of the anode layer. From this perspective, tubular SOFCs using a Ni–YSZ support coated with thin Ni–GDC anode and GDC electrolyte layers can be considered a cost-effective cell design to accomplish high cell performance at low and intermediate temperatures.
The power density of SOFCs depends largely on the electrochemical performances of the anode and cathode as determined by the interconnectivity between particles, amount of open porosity, and the length of the triple-phase boundaries (TPBs). In anode-supported design, the cathode layer is generally heat treated at relatively low temperatures (<1200 °C) after the densification of the electrolyte layer at high sintering temperatures (1400–1500 °C). Accordingly, the design of the microstructure of the cathode layer can be easily tuned by controlling the heat-treatment temperature. In contrast, the anode and electrolyte are co-fired at high temperature (1400–1500 °C), which often decreases the electrochemical performance in the anode by the densification, agglomeration, and coarsening of Ni and/or electrolyte particles. The preparation of uniformly dispersed anode composites with fine particle sizes and optimized anode microstructure, therefore, is important for enhancing cell performance.
Generally, anode cermets are prepared by ball milling a mixture of NiO and commercial electrolyte powders lead to non-uniform distribution of Ni in the anode, which can be disadvantageous for anodic performance [Citation4,Citation5]. Thus, the uniform mixing of fine NiO and electrolyte powders is essential to increase the fuel gas accessibility and length of the TPBs [Citation6,Citation7]. Various chemical routes have been explored to prepare Ni–YSZ composites with high gas accessibility and abundant TPBs, including the combustion process [Citation8], spray pyrolysis [Citation9], and the polymeric organic complex solution [Citation10], buffer-solution [Citation11], and gel-precipitation methods [Citation12]. Although the fundamental electrical properties of the anode composites have been reported, to the best of our knowledge, the power performances of SOFCs have been rarely investigated. For the Ni–GDC system, the co-precipitation method was explored [Citation13,Citation14]. The design of Ni–GDC composite layers with an optimized porous microstructure and abundant TPBs, however, remains in the initial stages and needs further improvement.
Chemically homogeneous multi-compositional powders can be prepared by the glycine nitrate process (GNP). The porous and uniform nanostructures are developed by the rapid combustion of the precursors, which can facilitate the development of highly porous anode structures. In this study, porous and uniform NiO–GDC nano-composite powders were prepared by one-pot GNP and applied to the anode layer in our previously fabricated intermediate-temperature (≤600 °C) SOFC with a cell configuration of Ni–YSZ/Ni/Ni–GDC/GDC/LSCF (La0.6Sr0.4Co0.2Fe0.8O3−δ)–GDC/LSCF [Citation15]. For comparison, an SOFC with the same configuration was also fabricated using NiO–GDC powders prepared by a conventional ball-milling process. At the operating temperature of 600 °C, the power density increased by approximately 35% by employing NiO–GDC composite powders prepared by GNP, and the reason for the enhanced cell performance was investigated in terms of the connective open pores and the dispersion of Ni and GDC particles within the Ni–GDC anode layer.
2 Experimental
2.1 Powder preparation
The NiO–Ce0.9Gd0.1O1.95 (NiO–GDC) nano-composite powders were prepared by the glycine nitrate process (GNP). Ce(NO3)3·6H2O (99.99%, Kanto Chemical Co., Japan), Gd(NO3)3·6H2O (99.95%, Kanto Chemical Co., Japan), and Ni(NO3)2·6H2O (99.999%, Sigma Aldrich Co., USA) were dissolved in 200 mL of distilled water, to which H2NCH2COOH (glycine, >99%, Sigma, USA) was added ([glycine]/([Ni2+] + [Ce3+] + [Gd3+]) = 1.0). The polymeric gel was prepared by stirring and heating the precursor solution at 80 °C on a hot plate. After complete evaporation of the water solvent, the precursors were explosively combusted by ignition through a rapid increase of the hot-plate temperature. After calcination at 800–1100 °C for 2 h, the powders were pulverized. According to the ICP analysis, the composition of GDC was determined to be Ce0.907Gd0.093O1.953 and the weight ratio between NiO and GDC was determined to be 45:55.
Commercial GDC powders (ULSA, Anan Kasei, Japan) were used as the electrolyte for the tubular cell. In order to match the shrinkages of the electrolyte and the anode layers during sintering, the commercial GDC powders, NiO–YSZ support and calcined NiO–GDC powders were compacted into disk-shaped specimens and isostatically pressed at 150 MPa. Their shrinkages were investigated using a dilatometer (DIL402PC, Netzch Ins., Germany) from ambient temperature to 1450 °C at a rate of 5 °C min−1 in air.
2.2 Cell fabrication
A NiO–YSZ tubular support was used. The NiO–YSZ (8 mol% yttria-stabilized zirconia) composite powders (NiO:YSZ = 40:60 by vol%) were prepared by mixing YSZ powders (TZ-8Y, Tosoh Co., Japan) and NiO powders (J. T. Baker Co., USA). The NiO–YSZ composite powders and activated carbon (pore former) were weighed and mixed in ethanol by ball milling for 14 days and then dried. An organic binder and 25 wt% of distilled water were added to the dried powders and the mixture was homogenized to form a paste. The paste was extruded in the form of a tube and dried at 120 °C for 12 h. The NiO–YSZ tubular support was prepared by heat treatment of the dried tubular structure at 1100 °C.
The NiO functional layer was coated on the porous NiO–YSZ tubular support by dip coating the support in the slurry. The slurry for the NiO coating was prepared according to the following procedure: NiO powders were added to solvent mixtures of toluene and 2-propanal. After the addition of sorbitan trioleate (dispersant) and Triton X-100 (surfactant), the slurry was ball milled for 24 h. Subsequently, di-n-butyl phthalate and polyvinyl butyral were added as a plasticizer and binder, respectively, and the slurry was ball milled again for 24 h. Activated carbon (3 wt% of the solid content) was added as a pore former in order to increase the gas permeability to the anode layer.
The NiO–YSZ tubular support was immersed in the NiO slurry for 10 s, pulled out slowly, and dried at room temperature. The dipping and pulling speeds were 100 and 10 mm min−1, respectively. The green NiO film was heat treated at 1100 °C for 3 h to obtain the mechanical strength necessary for handling.
The NiO–GDC functional layer was formed by dip coating the specimen in a NiO–GDC slurry. For comparison, NiO–GDC composite powders were prepared both by ball milling and by GNP. For the ball-milling preparation, NiO (J. T. Baker Co., USA) and Gd0.1Ce0.9O1.95 (GDC, Anan Kasei Co., Japan) powders were used. The NiO and GDC powders were mixed in a weight ratio of 45:55 to prepare NiO–GDC slurry. After being coated with the NiO–GDC green layer, the tubular structure was heat treated at 1100 °C for 3 h.
In the case of the NiO–GDC powders prepared by GNP, NiO–GDC powders calcined at 1000 °C for 2 h were used to prepare the NiO–GDC slurry. After being coated with the NiO–GDC green layer, the tubular structure was heat treated at 1000 °C for 3 h. In order to investigate the effect of the Ni–GDC microstructures on the cell performance, no carbon was added to either of the NiO–GDC slurries.
The GDC electrolyte layer was coated onto the support by dip coating. Gd0.1Ce0.9O1.95 (GDC, Anan Kasei Co., Japan) powders were used to prepare the GDC slurry. No carbon was added to the GDC slurry, thus achieving a gas-impermeable and dense GDC electrolyte layer. The GDC layer was applied to the specimen by dip coating. The specimen was then dried and heat treated at 400 °C for 2 h twice. The resultant cell was sintered at 1450 °C for 5 h. The cathode was formed according to the following procedure: The La0.6Sr0.4Co0.2Fe0.8O3−δ (LSCF, Fuel cell materials, USA)–Gd0.1Ce0.9O1.95 (GDC, Anan Kasei Co., Japan) composite layer was applied to the GDC electrolyte by dip coating and drying; the LSCF layer was then applied by dip coating and drying. Finally, the cell was heat treated at 1150 °C for 3 h to burn off all organic content to form a single NiO–YSZ/NiO/NiO–GDC/GDC/LSCF–GDC/LSCF tubular cell. For simplicity, the NiO–GDC composite powders prepared by GNP and ball milling will be referred to herein as “NiO–GDC(GNP)” and “NiO–GDC(BM),” respectively. The Ni–GDC disk-shaped specimens prepared by the sintering of NiO–GDC at 1450 °C for 5 h and subsequent reduction of NiO at 600 °C for 12 h in H2 atmosphere will be referred as “Ni–GDC(GNP)” and “Ni–GDC(BM),” respectively. The SOFCs fabricated from the NiO–GDC(GNP) and NiO–GDC(BM) powders will be referred as “SOFC(GNP)” and “SOFC(BM),” respectively.
2.3 Measurement of fuel cell performance
Before measuring the cell performance, nickel felt connected with Ni wires (current collector) was fixed to the interior part of the tubular cell. Platinum gauze (Pt, Sigma–Aldrich Co., USA) was wound on the entire cathode area and silver wire was wound on the Pt gauze for current collection. The cell was reduced in situ by a flowing H2/N2 mixed gas at 600 °C. The mixture gas ratio of H2 and N2 was changed slowly in order to prevent cracks caused by sudden reduction. After reduction of the NiO into metallic Ni, the mixture between H2 and N2 (50:50 by vol%) humidified by bubbling water were flowed through the tubular cell at a rate of 0.2 L min−1. Air was flown outside the tubular cell at a rate of 1.0 L min−1 while the cell performance was being measured.
2.4 Characterization of powders and cells
The phases and crystallinity of the powders were analyzed through X-ray diffraction (XRD, Rigaku, DMAX-II A, Cu Kα) studies. The compositions of the powders were analyzed using inductively coupled plasma atomic emission spectroscopy (ICP-AES, Optima 4300 DV, Perkin Elmer, USA). The morphology and the distribution of the components of the NiO–GDC powders were observed by SEM (Hitachi S-4300, Japan) and TEM (JEM-2100F, JEOL Co., Japan). The volume and size distribution of the open pores in the Ni–GDC(BM) and Ni–GDC(GNP) pellets were measured using the Archimedes’ method and mercury porosimetry (Auto pore IV 9520, Micromeritics Co. Ltd., USA). The spatial distributions of the components of the NiO–GDC anode layer were determined by electron probe microanalysis (EPMA, JXA-8500F, JEOL Co., Japan). The I–V characteristics were measured by using a DC electric load. The complex impedance of the cell was measured using a high-frequency analyzer (Alpha-N, Novo Control, Germany) at frequencies from 10−2 to 106 Hz.
3 Results and discussion
3.1 Preparation and characterization of NiO–GDC powders
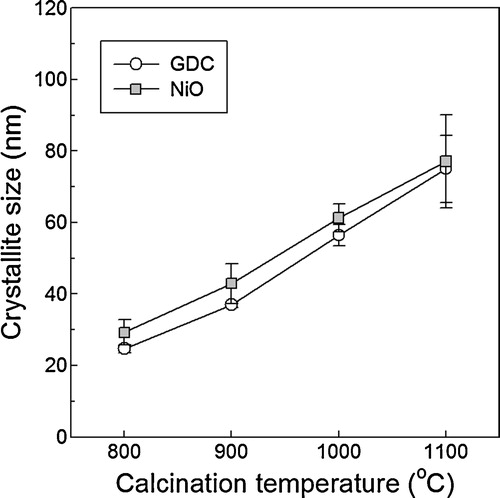
After the combustion reaction, the XRD patterns of the as-prepared NiO–GDC(GNP) powders showed NiO (JCPDS# 75-0197) and Ce0.9Gd0.1O1.95 (GDC, JCPDS# 75-0161) phases (). These NiO and GDC phases were maintained after calcination at 800–1100 °C. No secondary phase was observed in all the NiO–GDC(GNP) powders. The increase of peak intensity and the decrease of peak broadening indicate the coarsening of particles by heat treatment. The crystallite sizes of the NiO and GDC particles were calculated by Scherrer's equation (). As the heat-treatment temperature increased from 800 to 1100 °C, the crystallite size of NiO increased from 29.2 ± 3.5 nm to 77.1 ± 13.1 nm and that of GDC increased from 24.7 ± 1.1 nm to 75.1 ± 9.4 nm. This shows that the NiO and GDC particles are comparable in size.
Fig. 1 XRD patterns of as-prepared NiO–GDC(GNP) and NiO–GDC(GNP) powders calcined at 800–1100 °C for 2 h.
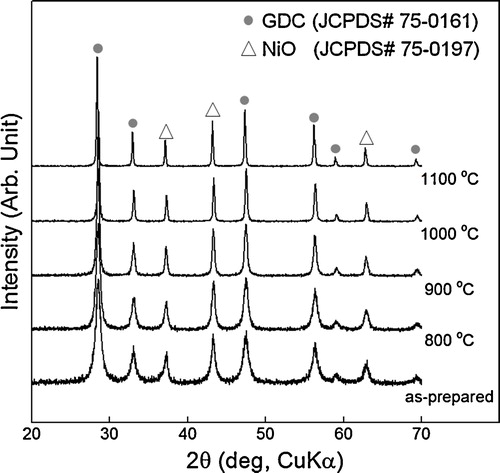
Fig. 2 Crystallite size of NiO–GDC(GNP) powders as a function of calcination temperature.
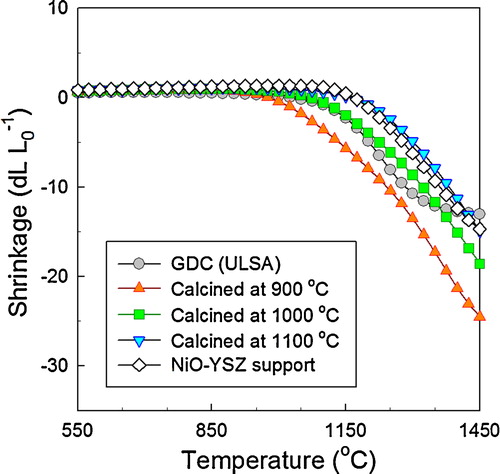
The shrinkages of electrolyte layer and support should be tuned carefully to prevent the formation of crack and/or defect within electrolyte layer during sintering [Citation16]. In order to match the shrinkages between the electrolyte layer and support, the NiO–GDC(GNP) powders calcined at 900–1100 °C and the GDC powders for the electrolyte were compacted into pellets and their shrinkages between 550 and 1450 °C were measured (). The GDC specimen started to shrink at ∼1050 °C and the total shrinkage at the sintering temperature (1450 °C) was ∼13%. The NiO–GDC specimens prepared from the powders calcined at 900, 1000, and 1100 °C started to shrink at 1000, 1075, and 1175 °C, respectively, and their total shrinkages at 1450 °C were 24%, 21%, and 15%, respectively. The NiO–GDC specimen prepared from the powders calcined at 1100 °C showed better shrinkage matching at the sintering temperature (1450 °C), whereas the specimens prepared from the powders calcined at 1000 °C showed good shrinkage matching during densification at 1000–1350 °C. The NiO contents in NiO–GDC composite may be decreased to match the shrinkage. However, this accompanies the increase of electrode polarization [Citation17]. In the sole viewpoint of total amount of shrinkage after sintering at 1450 °C, the NiO–GDC powders calcined at 1100 °C might be advantageous. However, this can generate the tensile stress in electrolyte layer because GDC electrolyte layer starts to shrink at 1050 °C, while NiO–YSZ support starts to shrink at 1150 °C, which deteriorates the densification of electrolyte at the beginning stage of sintering [Citation18]. Accordingly, the NiO–GDC(GNP) powders calcined at 1000 °C were used for anode in this study.
Fig. 3 Shrinkage behaviors of commercial GDC powders, NiO–YSZ support and NiO–GDC powders calcined at 900–1100 °C.
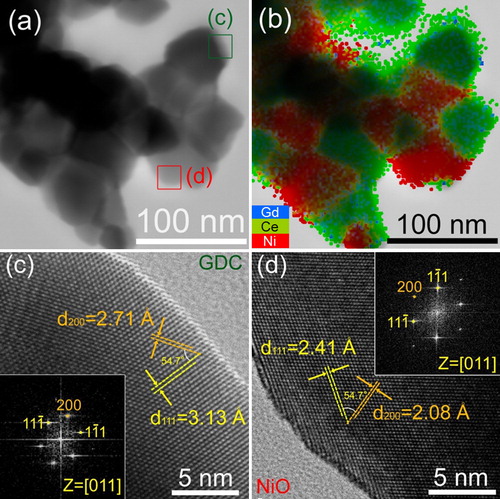
TEM analysis revealed that each secondary particle consisted of primary particles (size: 50–70 nm) (a). The EDS mapping of Ni (Red), Ce (Green), and Gd (Blue) clearly shows that the secondary particles consist of nano-composites of small NiO and GDC particles (b). From the lattice images and fast Fourier transform patterns, the primary GDC and NiO particles are identified as single crystalline grains (c and d, respectively). These results clearly show that GNP is a promising route for preparing highly dispersed NiO–GDC nano-composite powders with uniform mixing between NiO and GDC.
Fig. 4 TEM images of NiO–GDC powders calcined at 1000 °C: (a) TEM image, (b) EDS mapping, and (c and d) high-magnification images of GDC and NiO, respectively, taken from areas indicated in (a). (For interpretation of the references to color in this figure citation, the reader is referred to the web version of this article.)
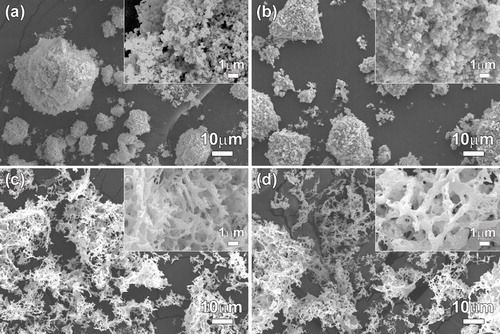
The morphologies of commercial GDC, NiO, as-prepared NiO–GDC(GNP) powders, and NiO–GDC(GNP) powders calcined at 1000 °C were observed by SEM images (). Primary particles of GDC and NiO with several tens of nanometers in size agglomerated to form large secondary particles (size: several micrometers) (a and b). In contrast, the as-prepared NiO–GDC(GNP) powders showed highly porous network structures due to the rapid combustion reaction of the precursors (c). The morphology was maintained and no agglomeration was observed after heat treatment at 1000 °C (d). The crystallite sizes of the commercial NiO and GDC particles were 78.6 ± 10.5 nm and 86.7 ± 6.8 nm, respectively, according to Scherrer's equation, which are somewhat larger than those of the NiO–GDC(GNP) powders.
Fig. 5 SEM images of commercial (a) GDC, (b) NiO, (c) as-prepared NiO–GDC(GNP) powders, and (d) NiO–GDC(GNP) powders calcined at 1000 °C.
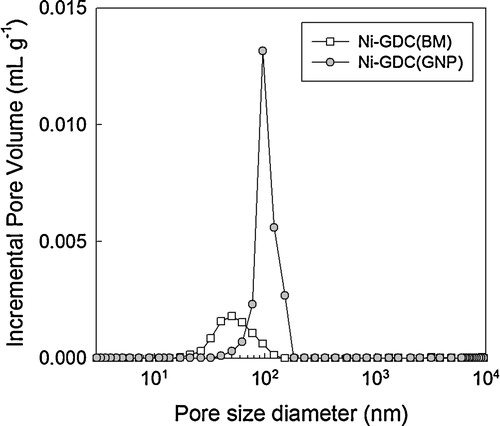
In order to investigate the open porosity of the Ni–GDC anode layer, disk-shaped specimens of NiO–GDC(BM) and NiO–GDC(GNP) were prepared by dry pressing, sintering at 1450 °C for 5 h, and reducing at 600 °C in H2 atmosphere for 12 h. The porosities and apparent densities of the specimens were measured by using Archimedes’ method. The apparent density of Ni–GDC(GNP) (5.99 g cm−3) was slightly lower than that of Ni–GDC(BM) (6.08 g cm−3). The porosity of Ni–GDC(GNP) (21.0 ± 0.6%) was substantially higher than that of Ni–GDC(BM) (9.5 ± 5.1%). showed the pore size distribution of the Ni–GDC(BM) and Ni–GDC(GNP) specimens determined by mercury porosimetry. The average pore size of Ni–GDC(GNP) (117.9 nm) is ∼2 times higher than that of Ni–GDC(BM) (63.6 nm). Moreover, the Ni–GDC(GNP) specimen shows significantly higher pore volume.
Fig. 6 Pore size distribution of Ni–GDC(BM) and Ni–GDC(GNP).
3.2 Characterization and performance of the cell
The NiO–GDC(GNP) and NiO–GDC(BM) powders were applied to fabricate tubular cells with a configuration of Ni–YSZ/Ni/Ni–GDC/GDC/LSCF–GDC/LSCF in order to investigate the effect of anode microstructure on the cell performance. A NiO–YSZ tubular support (length: 8 cm, outer diameter: 7.5 mm, inner diameter: 6.0 mm, and thickness: 0.8 mm before sintering of the electrolyte) was used. A NiO layer (thickness: ∼13 μm) was coated onto the NiO–YSZ support to prevent the formation of a resistive secondary phase by the interdiffusion of GDC and YSZ [Citation19,Citation20] during high-temperature sintering and to increase the bonding between the NiO–YSZ support and the NiO–GDC anode layer during fabrication. Although Ni can be used as support instead of NiO–YSZ to simplify cell structure and to decrease the cost of the cells, the thermal shock can be occurred during long-term cell operation due to the large difference of thermal expansion coefficients (TEC) between pure metallic Ni (17.0 × 10⁻⁶ K−1) [Citation21,Citation22] and oxide GDC (12.6 × 10⁻⁶ K−1) [Citation23]. Thus, Ni–YSZ (TEC = 14.6 × 10⁻⁶ K−1) and Ni–GDC (TEC = 14.3 × 10⁻⁶ K−1) [Citation15] with similar TEC of GDC were used as support and anode layer, respectively. Consequently, the cells prepared by inserting thin Ni layer between Ni–YSZ support and Ni–GDC anode layer were cost-effective and stable.
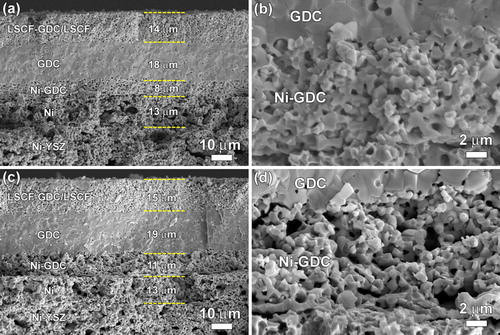
The active areas of the final SOFCs prepared from the NiO–GDC(GNP) and NiO–GDC(BM) powders were 3.86 cm2 and 3.80 cm2, respectively. The final SOFCs for both samples were ∼0.6 mm thick. Most interfaces except that between LSCF–GDC and the LSCF layers were distinctive in the SEM images (). In SOFC(BM), the thicknesses of the LSCF/LSCF–GDC cathode, GDC electrolyte, Ni–GDC anode, and Ni layers after the reduction of NiO into Ni were ∼14, 18, 8, and 13 μm, respectively (a). In SOFC(GNP), the thicknesses of the LSCF/LSCF–GDC cathode, GDC electrolyte, Ni–GDC anode, and Ni layers were ∼15, 19, 11, and 13 μm, respectively (c). Note that the Ni–GDC layer in SOFC(GNP) (d) is more porous than that in SOFC(BM) (b).
Fig. 7 Cross-sectional SEM images of the cell structures and Ni–GDC anode layers after measurement of cell characterization: (a and b) SOFC(BM) and (c and d) SOFC(GNP).
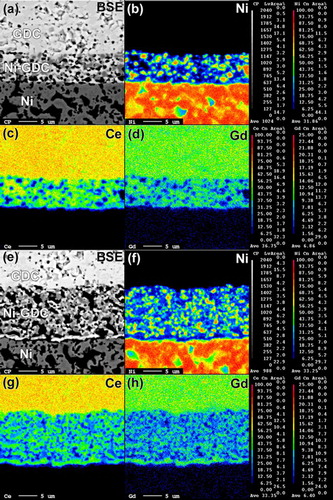
The distributions of Ni and GDC within the Ni–GDC layer were investigated using EPMA (). In SOFC(BM), relatively large Ni particles were distributed (b). In contrast, smaller Ni particles with higher connectivity were observed in SOFC(GNP) (f). The EPMA contours of Ce and Gd in c and d, respectively, indicate the coarsening or agglomeration of GDC particles in the Ni–GDC(BM) layer. This can be explained by the densification and/or coarsening of NiO and GDC particles during sintering, probably due to agglomeration of the commercial NiO and GDC powders. In contrast, the EPMA contours in SOFC(GNP) showed a uniform and well-dispersed distribution of GDC particles in the anode layer (g and h). The differences in the distribution of Ni and GDC within the Ni–GDC layers of the two cells are quite substantial and thus cannot be explained simply by the small differences in the primary particle sizes of NiO and GDC. Zha et al. [Citation24] reported that the porous Ni–GDC anode can be prepared by using the mixtures of combustion-derived porous NiO and GDC powders. Suda et al. [Citation25] prepared NiO–SDC (samarium-doped ceria) core–shell powders by spray pyrolysis as the starting powders for anode. The outer SDC suppressed the sintering, coarsening, and agglomeration of NiO during sintering, which developed the porous anode with good and uniform dispersion of Ni and SDC after reduction. Thus, highly porous NiO–GDC nano-composite powders with good dispersion of NiO and GDC primary particles in the present study effectively suppressed the densification and coarsening of NiO and GDC particles during sintering, thus providing gas accessible, well-distributed and elongated TPBs.
Fig. 8 Cross-sectional back-scattered electron images of GDC/Ni–GDC/Ni layer: (a) SOFC(BM) and (e) SOFC(GNP). EPMA elemental maps for (b) Ni, (c) Ce, and (d) Gd of SOFC(BM) and (f) Ni, (g) Ce, and (h) Gd of SOFC(GNP).
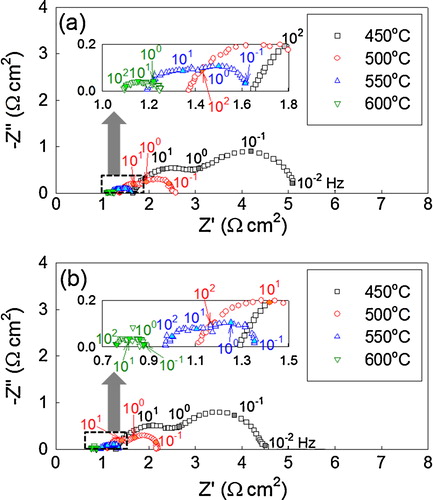
The complex impedance spectra of the entire cell were measured at 450–600 °C under open-circuit conditions (), and the electrode resistance (Rel) and ohmic resistance (Rb) were calculated from the spectra. The Rel values of SOFC(BM) decreased from 3.45 to 0.16 Ω cm2 as the temperature increased from 450 to 600 °C. The SOFC(GNP) showed slightly lower Rel values and similar variation of Rel with temperature. The low Rel value at high temperature is explained by the thermal promotion of the electrode reaction. The Rb values of SOFC(BM) decreased from 1.65 to 1.09 Ω cm2 as the temperature increased from 450 to 600 °C, whereas those of SOFC(GNP) decreased from 1.29 to 0.76 Ω cm2. The ohmic polarization consists of ohmic polarization from the electrolyte, electrode, interface between electrolyte and electrode, and interface between electrode and current collector [Citation26]. Although impedance spectra at open-circuit condition are not directly related to the maximum power density at load condition, the lower Rel and Rb values in SOFC(GNP) reflect lower polarization and better electrochemical reactions at the anode and/or the electrolyte/anode interface layers during cell operation.
Fig. 9 Complex impedance spectra of (a) SOFC(BM) and (b) SOFC(GNP) at 450–600 °C.
The current–voltage (I–V) and current–power (I–P) characteristics of the SOFC(BM) and the SOFC(GNP) cells were measured at 450–600 °C (). The open-cell voltage (OCV) of SOFC(BM) was 0.89 V at 450 °C, which decreased to 0.80 V as the operation temperature increased to 600 °C (a). The OCV value lower than the theoretical value (1.1 V) can be ascribed to the contribution of electronic conduction in GDC under a highly reducing atmosphere [Citation27Citation[28]–Citation29]. However, the possibility of small amount of gas leakage through electrolyte cannot be excluded completely. The maximum power densities at 450, 500, 550, and 600 °C were 68, 131, 220, and 301 mW cm−2, respectively. The OCV value of SOFC(GNP) was 0.89 V at 450 °C, which decreased to 0.81 V as the operation temperature increased to 600 °C (b). The maximum power densities at 450, 500, 550, and 600 °C were 97, 192, 295, and 413 mW cm−2, respectively, which are 42%, 47%, 34%, and 37% higher than those of SOFC(BM) in a. In our previous work [Citation15], the high power density (594 mW cm−2) was obtained using 100% H2 fuel at 600 °C of the tubular SOFC with same configuration when carbonate-coprecipitation-derived well-sinterable GDC powders were used as starting powders for GDC electrolyte layer. The lower power density in the present study, accordingly, can be attributed to the use of lower concentration of H2 (50%) as fuel and the use of commercial GDC powders with low sinterability for the preparation of electrolyte layer.
Fig. 10 I–V and I–P graphs of (a) SOFC(BM) and (b) SOFC(GNP) at 450–600 °C.
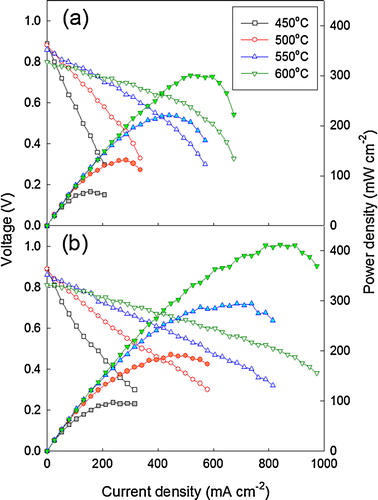
The voltage of SOFC(BM) decreased rapidly at high current densities (≥520 mA cm−2), whereas the voltage of SOFC(GNP) decreased gradually as the current density increased to 1000 mA cm−2 at an operating temperature of 600 °C (a and b). The electrode polarization consists of activation polarizations at the cathode and anode, as well as concentration polarization [Citation26]. The activation polarization depending upon the length of TPB can be verified by the slope of I–V graph at low current density. In this I–V graphs, it is difficult to find substantial difference in activation polarization of SOFC(BM) and SOFC(GNP). The abrupt decrease of voltage at high current densities is generally ascribed to the concentration polarization caused by the microstructure of the electrode. The Ni–GDC layer in SOFC(GNP) had a more porous microstructure than that of SOFC(BM), as seen through SEM analysis (b and d). Therefore, the different behavior of the voltage at high current densities is attributed to the degree of fuel gas delivery within the Ni–GDC anode. Considering the same process for cell fabrication and similar dimensions of the component layers, the microstructure of the Ni–GDC anode layer and the distribution of Ni and GDC can be regarded as the key reason for the significant difference in power density.
4 Conclusion
Highly porous NiO–GDC nano-composite powders were prepared by a one-pot glycine nitrate process and were applied to the fabrication of tubular SOFCs with the configuration Ni–YSZ/Ni/Ni–GDC/GDC/LSCF–GDC/LSCF. A maximum power density of 413 mW cm−2 was obtained at 600 °C, which is significantly higher than that of SOFCs with the same cell configuration prepared by ball-milled NiO–GDC powders (301 mW cm−2). Porous Ni–GDC anode layer, good dispersion of the Ni and GDC particles, and suppression of the densification and coarsening of the NiO and GDC particles during sintering can be achieved using GNP-derived well-defined NiO–GDC powders, and these characteristics were the main reasons for the substantial improvement of power density.
Acknowledgements
This work was supported by the National Research Foundation of Korea (NRF) grant funded by the Korea government (MEST) (No. 2013R1A2A1A01006545).
Notes
Peer review under responsibility of The Ceramic Society of Japan and the Korean Ceramic Society.
Related Research Data
References
- S.C.SinghalSolid State Ionics1352000305313
- N.M.SammesY.DuR.BoveJ. Power Sources1452005428434
- B.C.H.SteeleJ. Mater. Sci.36200110531068
- T.KawataN.SakaiH.YokokawaM.MoriT.IwataJ. Electrochem. Soc.137199030423047
- W.Z.ZhuS.C.DeeviMater. Sci. Eng.A3622003228239
- S.P.JiangP.J.CallusS.P.S.BadwalSolid State Ionics1322000114
- Y.OkawaY.HirataJ. Eur. Ceram. Soc.252005473480
- S.T.ArunaM.MuthuramanK.C.PatilSolid State Ionics11119984551
- T.FukuiS.OharaM.NaitoK.NogiJ. Eur. Ceram. Soc.23200329632967
- P.DuranJ.TartajF.CapelC.MoureJ. Eur. Ceram. Soc.23200321252133
- Y.LiY.XieJ.GongY.ChenZ.ZhangMater. Sci. Eng.B862001119122
- M.MarinšekK.ZupanJ.MačekJ. Power Sources862000383389
- C.DingK.SatoJ.MizusakiT.HashidaCeram. Int.3820128592
- C.DingH.LinK.SatoT.HashidaScr. Mater.602009254256
- S.-Y.ParkC.W.NaJ.H.AhnU.-J.YunT.-H.LimR.-H.SongD.-R.ShinJ.-H.LeeJ. Power Sources2182012119127
- J.WillM.K.M.HruschkaL.GublerL.J.GaucklerJ. Am. Ceram. Soc.842001328332
- H.KoideY.SomeyaT.YoshidaT.MaruyamaSolid State Ionics1322000253260
- P.SarkarD.DeH.RhoJ. Mater. Sci.392004819823
- A.TsogaA.GuptaA.NaoumidisD.SkarmoutsosP.NikolopouloIonics41998234240
- A.TsogaA.NaoumidisD.StöverSolid State Ionics1352000403409
- S.PrimdahlM.MogensenJ. Electrochem. Soc.144199734093419
- S.K.PratiharA.D.SharmaR.N.BasuH.S.MaitiJ. Power Sources1292004138142
- H.HayashiM.KanohC.J.QuanH.InabaS.WangM.DokiyaH.TagawaSolid State Ionics1322000227233
- S.ZhaW.RauchM.LiuSolid State Ionics1662004241250
- S.SudaM.ItagakiE.NodeS.TakahashiM.KawanoH.YoshidaT.InagakiJ. Eur. Ceram. Soc.262006593597
- F.ZhaoA.V.VirkarJ. Power Sources14120057995
- B.C.H.SteeleSolid State Ionics129200095110
- K.EguchiT.SetoguchiT.InoueH.AraiSolid State Ionics521992165172
- G.ChiodelliL.MalavasiIonics19201311351144