
 ?Mathematical formulae have been encoded as MathML and are displayed in this HTML version using MathJax in order to improve their display. Uncheck the box to turn MathJax off. This feature requires Javascript. Click on a formula to zoom.
Abstract
The effect of nano-clay platelets (Cloisite 30B) on the mechanical and thermal properties of fly ash geopolymer has been investigated in this paper. The nano-clay platelets are added to reinforce the geopolymer at loadings of 1.0%, 2.0%, and 3.0% by weight. The phase composition and microstructure of geopolymer nano-composites are also investigated using X-ray diffraction (XRD), Fourier transform infrared spectroscopy (FTIR) and scanning electron microscope (SEM) techniques. Results show that the mechanical properties of geopolymer nano-composites are improved due to addition of nano-clay. It is found that the addition of 2.0 wt% nano-clay decreases the porosity and increases the nano-composite's resistance to water absorption significantly. The optimum 2.0 wt% nano-clay addition exhibited the highest flexural and compressive strengths, flexural modulus and hardness. The microstructural analysis results indicate that the nano-clay behaves not only as a filler to improve the microstructure, but also as an activator to facilitate the geopolymeric reaction. The geopolymer nano-composite also exhibited better thermal stability than its counterpart pure geopolymer.
1 Introduction
Geopolymers are synthesized by activating a solid aluminosilicate source with alkaline solutions. They are currently attracting extensive research because of their potential as a high-performance and environmentally friendly alternative to ordinary Portland cement in different applications [Citation1,Citation2]. It has been shown that a wide range of waste aluminosilicate materials can be converted into building materials, as they show excellent physical and chemical properties [Citation3–Citation7]. However, geopolymer pastes suffer from brittle failure mode under applied force. The typical values of the compressive strength of geopolymer-based ceramics are around 45 MPa [Citation8] which are comparable to the strength of Portland cement pastes. However, geopolymer pastes show lower flexural strength ranging between 1.7 MPa and 16.8 MPa [Citation8,Citation9]. Improving the flexural and tensile strengths will promote the application of these materials significantly in construction and building industries.
In recent years, nanotechnology has gained attention in ceramic and polymer research, particularly in forming nano-composites which have superior physical and mechanical properties [Citation5]. In geopolymers, various types of nanoparticles have been incorporated successfully to improve their mechanical properties. Alumina and silica nanoparticles have been used successfully as reinforcements for geopolymer pastes, giving them superior mechanical properties. Nano-alumina and nano-silica not only acted as fillers, but also enhanced the geopolymerization reaction [Citation10]. In another study, it has been found that nano-silica and nano-alumina particles have the ability to reduce the porosity and water absorption of geopolymer matrices [Citation11]. A further study on the effect of adding carbon nanotubes to fly-ash-based geopolymer has shown an increase in the mechanical and electrical properties of geopolymer nano-composites when compared to the control paste [Citation12]. In another study, the addition of calcium carbonate (CaCO3) nanoparticles to high-volume fly-ash concrete improved the flexural and mechanical properties, decreased the porosity and improved the concrete resistance to water absorption [Citation13]. Recently, a study on nano-clay cement nano-composites demonstrated that the nano-clay significantly improved the mechanical and thermal properties of the cement matrix [Citation14]. Hitherto, no research has been conducted to investigate the effect of nano-clay on thermal and mechanical properties of geopolymer. The incorporation of nano-clay in geopolymer paste could significantly enhance the matrix in two ways: (a) by adding more silica to the system which reacts with sodium to produce sodium aluminosilicate hydrate (geopolymer gel) [Citation10] and (b) by producing a denser matrix through the pore filling effect [Citation14].
The current study has examined the effect of adding different loadings of nano-clay to the geopolymer paste. Results showed that the addition of nano-clay improved the mechanical and thermal properties of geopolymer. Flexural and compressive tests have been performed to measure the various mechanical properties and thermogravimetric analysis (TGA) has been used to examine the thermal behavior of geopolymer containing nano-clay. In addition, X-ray diffraction, Fourier transform infrared spectroscopy (FTIR) and scanning electron microscopy (SEM) techniques were used to characterize the phase composition and microstructure of geopolymer-nano-clay composites.
2 Experimental procedure
2.1 Materials
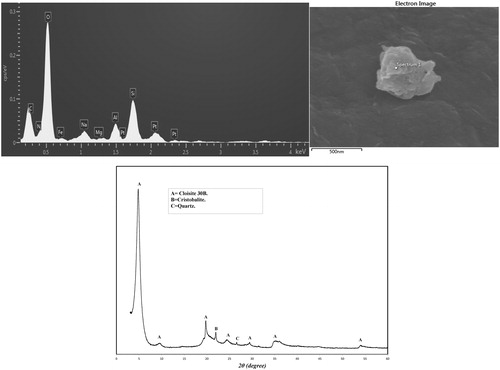
Low-calcium fly-ash (ASTM class F), obtained from the Eraring power station in NSW, was used to prepare the geopolymeric nano-composites. The chemical composition of fly-ash is shown in . The alkaline activator for geopolymerization was a combination of sodium hydroxide solution and sodium silicate grade D solution. Sodium hydroxide flakes with 98% purity were used to prepare the solution. The chemical composition of sodium silicate used was 14.7% Na2O, 29.4% SiO2 and 55.9% water by mass. The nano-clay (Cloisite 30B) used in this investigation was based on natural montmorillonite clay which has composition of (Na,Ca)0.33(Al,Mg)2(Si4O10)(OH)2·nH2O. Cloisite 30B is a natural montmorillonite modified with a quaternary ammonium salt, which was supplied by Southern Clay Products, USA. The specification and physical properties of Cloisite 30B are outlined in [Citation15].
Table 1 Chemical composition of fly-ash (wt%).
Table 2 Physical properties of the nano-clay platelets (Cloisite 30B) [Citation13].
2.2 Preparation of geopolymer nano-composites
To prepare the geopolymer pastes, an alkaline solution to fly ash ratio of 0.75 was used and the ratio of sodium silicate solution to sodium hydroxide solution was fixed at 2.5. The concentration of sodium hydroxide solution was 8 M, which is prepared and combined with the sodium silicate solution one day before mixing.
The nano-clay was added to the fly-ash at the loadings of 1.0%, 2.0% and 3.0% by weight. The fly-ash and nano-clay were first dry mixed for 5 min in a Hobart mixer at a low speed and then mixed for another 10 min at high speed until a uniform mixture was achieved. The alkaline solution was then added slowly to the fly-ash and nano-clay in the mixer at a low speed until the mix became homogeneous, then further mixed for another 10 min on high speed. The resultant mixture was then poured into wooden molds. The wooden molds were then placed on a vibration table for 2 min before they were covered with a plastic film and cured at 80 °C for 24 h in an oven before demolding. They were then cured under ambient conditions for 28 days. The pure geopolymer, and nano-composites containing 1.0%, 2.0% and 3.0% nano-clay were labeled GP, GPNC-1, GPNC-2 and GPNC-3, respectively. The formulation of samples is given in .
Table 3 Formulation of samples.
2.3 Physical properties
Measurements of bulk density and porosity were conducted to define the quality of geopolymer nano-composite. Density of samples (ρ) with volume (V) and dry mass (md) was calculated using Eq. Equation(1)(1)
(1) :
(1)
(1)
The value of apparent porosity (Pa) was determined using Archimedes’ principle in accordance with the ASTM Standard (C-20) [Citation16]. Pure geopolymer and nano-composite samples were immersed in clean water, and the apparent porosity (Pa) was calculated using Eq. Equation(2)(2)
(2) [Citation17]:
(2)
(2) where ma is mass of the saturated samples in air, and mw is mass of the saturated samples in water.
For the water absorption test, samples of pure geopolymer and geopolymer nano-composites were dried at a temperature of 80 °C until reaching stable mass (mo). The samples were then submerged in clean water at a temperature of 20 °C for 48 h. After the desired absorption period, the samples were removed and the mass was weighed (m1) immediately. The water absorption (WA) of samples was calculated using the equation [Citation18]:(3)
(3)
2.4 Mechanical properties
A LLOYD Material Testing Machine (50 kN capacity) with a displacement rate of 0.5 mm/min was used to perform the mechanical tests. Rectangular bars of 60 mm × 18 mm × 15 mm were cut from the fully cured samples for three-point bend test with a span of 40 mm to evaluate the flexural strength. Five samples of each group were used to evaluate the flexural strength and flexural modulus of geopolymer composites. The values were recorded and analyzed with the machine software (NEXYGENPlus) and average values were calculated. The flexural strength (σF) was determined using the equation [Citation19]:(4)
(4) where Pm is the maximum load, S is the span of the sample, D is the specimen width, and W is the specimen thickness.
Values of flexural modulus (EF) were computed using the initial slope of the load–displacement curve (ΔP/ΔX) [Citation19]:(5)
(5)
20 mm cube specimens were used for the determination of compressive strength. The compressive strength of geopolymer composites was tested according to ASTM C109 and calculated using the following formula [Citation20]:(6)
(6) where P is maximum load on the sample at failure, and A is the surface area of the specimen.
The hardness of geopolymer composites was measured on the Rockwell H scale using an Avery Rockwell hardness tester. Before measurement, five samples of each group were polished with emery paper to achieve flat and smooth surfaces.
2.5 Structural and microstructural characterization
The samples were broken and ground to fine powder. Then, they were scanned using a D8 Advance Diffractometer (Bruker-AXS, Germany) using copper radiation and a LynxEye position sensitive detector. The diffractometer was scanned from 7.5° to 60° using a scanning rate of 0.5°/min. XRD patterns were obtained by using Cu kα lines (k = 1.5406 Å).
The microstructures of geopolymer composites were examined using Zeiss Neon focused ion beam scanning electron microscope (FIB-SEM). The specimens were mounted on aluminum stubs using carbon tape and then coated with a thin layer of platinum to prevent charging before the observation.
An FTIR analysis was performed on a Perkin Elmer Spectrum 100 FTIR spectrometer in the range of 4000–500 cm−1 at room temperature. The spectrum was an average of 10 scans at a resolution of 2 cm−1, corrected for background.
The thermal behavior of samples was studied by thermogravimetric analysis (TGA) and differential thermogravimetry (DTG). A Mettler Toledo TGA/DSC star system analyzer was used for the measurements. Solid samples were placed in an alumina crucible and tests were carried out in Argon atmosphere with a heating rate of 10 °C/min from 25 to 800 °C.
3 Results and discussion
3.1 Density, porosity and water absorption
The results of porosity and water absorption of geopolymer paste and geopolymer nano-composites are shown in . All geopolymer nano-composites showed higher densities and lower porosities than the control paste. The addition of nano-clay has increased the density and reduced the porosity and the water absorption of geopolymer nano-composites when compared to control geopolymer paste. The optimum addition was found as 2.0 wt% of nano-clay, which reduced the porosity by 7.1%, and the water absorption by 17% when compared to the control paste. This implies that nano-clay particles played a pore-filling role to reduce the porosity of geopolymer composites. However, adding excessive amounts of nano-clay increased the porosity and decreased the density of all samples. This result is comparable to that of cement reinforced organo-clay composites whereby the porosity of cement paste is decreased due to addition of an optimum amount of nano-clay to cement paste. However, the porosity is increased when more nanoparticles were added because of the agglomeration effect [Citation14].
Table 4 Porosity and water absorption for pure geopolymer and geopolymer nano-composites.
3.2 X-ray diffraction (XRD)
The XRD patterns of nano-clay, fly ash, control geopolymer paste, and geopolymer nano-composites containing 1.0, 2.0 and 3.0 wt% of nano-clay are shown in and . The crystalline phases were indexed using Powder Diffraction Files (PDFs) from the Inorganic Crystal Structure Database (ISCD).
shows the XRD patterns of nano-clay. Three phases have been indexed in the diffraction pattern of nano-clay with the major phase being Cloisite 30B and minor phases of Cristobalite [SiO2] (PDF-000391425) and Quartz [SiO2] (PDF-000470718). Cloisite 30B consists of Montmorillonite [(Ca,Na)0.3Al2(Si,Al)4O10(OH)2·xH2O] and the quaternary ammonium salt. Montmorillonite has four major peaks in the XRD pattern that correspond to 2θ of 4.84°, 19.74°, 35.12° and 53.98°. The quaternary ammonium salt has four peaks that correspond to 2θ of 4.84°, 9.55°, 24.42° and 29.49°. Note that there was an overlap of peaks at 2θ of 4.84° for Montmorillonite and quaternary ammonium salt. Both Cristobalite and Quartz have a peak that corresponds to 2θ of 21.99° and 26.61° respectively. The broad hump in the diffraction pattern of Cloisite 30B indicates the presence of amorphous content in the nano-clay.
Fig. 1 X-ray diffraction pattern of nano-clay (Cloisite 30B).
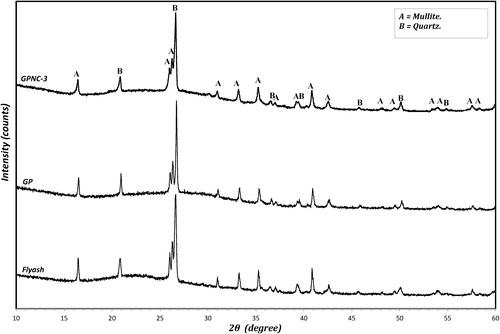
shows two important phases: quartz [SiO2] (PDF-010872096) and mullite [Al4.56Si1.44O9.72] (PDF-010791458). These crystalline phases are mainly the fly-ash phases, and they are not reactive in the geopolymeric reaction, but they are existing as unreactive and filler particles in the geopolymer paste [Citation21,Citation22]. However, the amorphous aluminosilicate phase generated between 2θ = 14° and 27° is a sign of the activity of geopolymeric reaction, which is the reactive and dissolvable content in alkaline solution throughout the geopolymer formation [Citation23]. This amorphous phase affects the mechanical properties of geopolymer matrix significantly: the higher the content of amorphous phase, the higher the strength exhibited by the geopolymer [Citation24,Citation25].
Fig. 2 X-ray diffraction patterns of fly-ash, GP and GPNC-3.
3.3 Mechanical properties
The flexural tests are often used to characterize the mechanical properties of composites as they provide a simple means of determining the bending response. This provides useful information on the performance of the composites. The effect of nano-clay addition on the flexural strength of geopolymer nano-composites is presented in . Experimental results indicate that the flexural strength of samples initially increases with increasing nano-clay content of up to 2.0 wt% but decreases at higher contents. The flexural strength of the nano-composites is improved from 4.5 MPa in the control to about 5.6 MPa with 2.0 wt% nano-clay. This improvement can be attributed to the good dispersion of the nano-particles throughout the matrix, leading to less porosity and denser geopolymer matrix. This result is comparable with that of nano-clay-cement composite reported by Hakamy et al. [Citation14] who found that the optimum addition of nano-clay to cement mix is about 1.0 wt%, which increases the flexural strength of the nano-composites by 31% over the control sample. Both studies imply that increasing the content of nano-clay led to some improvement in flexural strength of the composite. This result can also be ascribed to the nano-particles effect, which improved the matrix through geopolymeric reaction and increased the amorphous content, producing higher content of geopolymer products.
Fig. 3 Flexural strength and flexural modulus of samples GP, GPNC-1, GPNC-2 and GPNC-3.
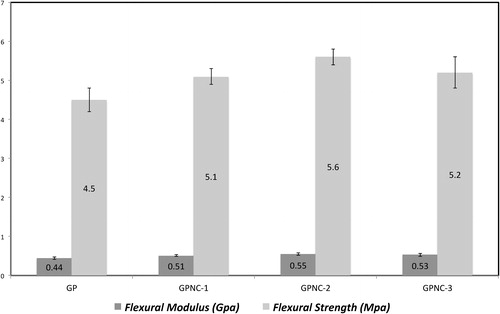
The flexural modulus is a measure of resistance to deformation of the composite in bending. The flexural modulus of control paste and geopolymer nano-composites is shown in and also indicates that the optimum addition of nano-clay is 2.0 wt% to the geopolymer matrix, and it improved the flexural modulus over a pure geopolymer matrix by 25%.
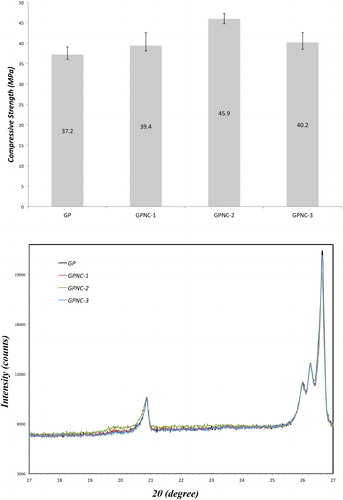
The compressive strength results of geopolymer and geopolymer nano-composites are shown in , and indicate similar trends to flexural strength and modulus values. Compressive strength is inversely proportional to porosity: specimens with less porosity displayed higher compressive strength. The compressive strength of the neat geopolymer paste is improved from 37.2 to 45.9 MPa after the addition of 2.0 wt% nano-clay, but this trend is reversed, reducing the strength to 40.2 MPa with the addition of 3.0 wt% nano-clay. In a similar study, Phoo-ngernkham et al. [Citation10] reported that the addition of 1.0–2.0 wt% nano-alumina and amorphous nano-silica into geopolymer matrix enhanced the geopolymeric reaction and increased the geopolymer gel, which increased the density and consequently improved the compressive strength of geopolymer matrix. Both studies showed that increasing the compressive strength of geopolymer pastes is corresponded to the reduction in porosity.
Fig. 4 Compressive strength of samples GP, GPNC-1, GPNC-2 and GPNC-3.
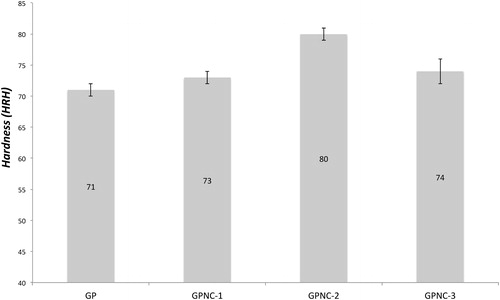
The hardness values of the control sample and geopolymer nano-composites are presented in . The results show that there was no significant improvement observed between all samples. However, the geopolymer nano-composite with 2.0 wt% of nano-clay showed slightly higher hardness than other samples. This enhancement could be attributed to the high density of the geopolymer nano-composite paste, which decreased the penetration of the test ball on the surface of the nano-composite matrix and consequently improved the hardness.
Fig. 5 Hardness of samples GP, GPNC-1, GPNC-2 and GPNC-3.
3.4 SEM observation
a–d shows the SEM micrographs of fracture surface of nano-composite containing 0, 1.0, 2.0, and 3.0 wt% nano-clay. The pure geopolymer has a less dense matrix with a higher number of non-reacted and partially reacted fly-ash particles embedded in the matrix (a). For the 1–3 wt% nano-clay (b–d) less numbers of fly-ash particles were observed, and the matrix seemed denser than that of the control paste.
Fig. 6 SEM images of the fracture surface of geopolymer nano-composites with different loadings of nano-clay: (a) pure geopolymer, (b) 1.0 wt%, (c) 2.0 wt%, (d) 3.0 wt%, agglomerated nano-clay particles embedded in the matrix at: (e and f) low magnification and (g and h) higher magnification.
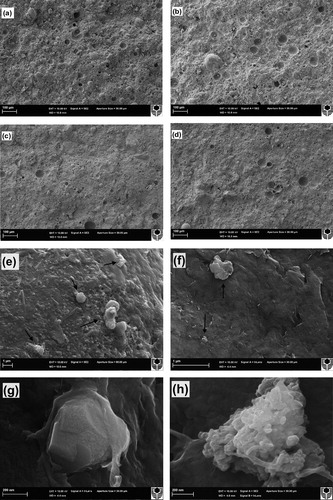
e and f displays an observation of the geopolymer matrix that was loaded with 3.0 wt% nano-clay at low magnification. Nano-clay particles are poorly dispersed and agglomerated due to the high content of nano-clay. g and h shows agglomerations of nano-clay platelets at higher magnification.
3.5 FTIR observation
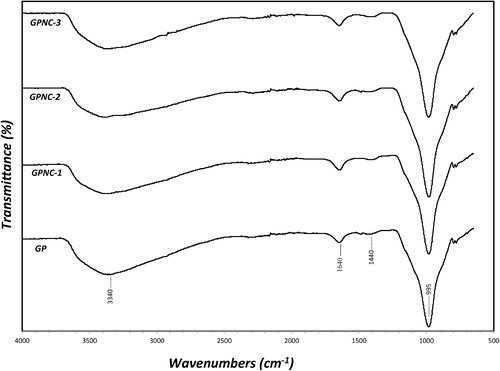
FTIR spectra of both pure geopolymer and geopolymer nano-composite are shown in . The FTIR spectra of all samples show a strong peak at ∼1000 cm−1 which is associated with Si–O–Si asymmetric stretching vibrations and is the fingerprint of the geopolymerization [Citation26]. A broad peak in the region around 3340 cm−1 is corresponding to the hydroxyl (OH) group of physically free water (higher frequencies), and to chemically bounded water through hydrogen bonds (lower frequencies) [Citation27]. The absorbance peak at 1640 cm−1 is also attributed to the (OH) bending vibration [Citation28]. The band at 1440 cm−1 is an indicator of the presence of sodium carbonate; this was produced because of the atmospheric carbonation on the surface of the matrix where it reacts with carbon dioxide [Citation29]. The level of geopolymerization can be specified by measuring the ratios of the height and the area of the Si–O–Si stretching peaks of the nano-composites to the pure matrix [Citation28]. illustrates that all nano-composites had generally higher contents of geopolymer compared to the control paste; however, the addition of 2.0 wt% of nano-clay had the highest level of geopolymerization among all samples.
Table 5 Peak areas and peak heights ratios of geopolymers at Si–O–Si stretching vibrations from FTIR spectra.
Fig. 7 FTIR spectra of all samples.
3.6 Thermal stability
The thermal stability of samples was determined using thermogravimetric analysis (TGA). In this test, the thermal stability was studied in terms of the weight loss percentage as a function of temperature in Argon atmosphere. The results of thermogravimetric analysis (TGA) and the differential thermogravimetry (DTG) of all samples are shown in and , respectively. The residual mass at different temperatures for nano-clay and all samples are summarized in .
Table 6 Thermal properties of control paste, geopolymer nano-composites and nano-clay (Cloisite 30B).
The residual mass results exhibit the remaining weight percentage of the material after the TGA test, which could be an indicator of the organic/inorganic component of the material [Citation30]. For instance, in the case of nano-clay, TGA showed that about 30 wt% of the component burnt at 800 °C, which is the organic component in the Cloisite 30B. This is equivalent to the loss on ignition wt% of the supplier technical data sheet of the Cloisite 30B.
shows that the major decomposition region of the nano-clay is between 300 °C and 450 °C, where the weight loss is about 21%. However, there are no noteworthy changes that occurred to the weight loss of the nano-composites curves at the same region, rather they showed almost the same weight loss of the pure geopolymer. This shows that the decomposition of nano-clay did not influence the thermal stability of the nano-composite due to the small wt% nano-clay additions.
Fig. 8 TGA curves of nano-clay (Cloisite 30B) and all samples.
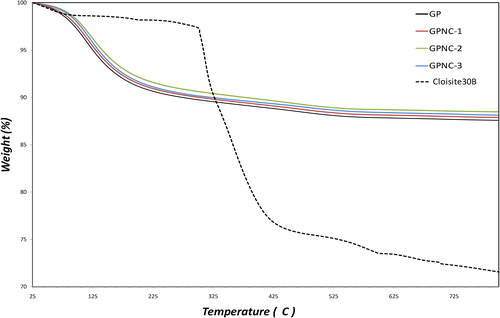
The TGA of the pure geopolymer and the nano-composites showed a major weight loss from room temperature to 150 °C, due to the evaporation of physically adsorbed water. The neat geopolymer curve is steeper in this region compared to the nano-composites curves, which is clearly shown in DTG graph () where the peak of pure geopolymer moved to a lower temperature compared to the nano-composite. This is due to the formation of high porosity in the neat geopolymer, which reduces the ability of the sample to retain water. On the other hand, GPNC-2 sample exhibited the highest thermal stability among all geopolymer samples, the peak of the nano-composite containing 2.0 wt% nano-clay shifted slightly to a higher temperature than other samples. This may be attributed to the effect of nano-clay filling the voids, producing denser geopolymer, and/or it may be attributed to the fact that the nano-composite specimens had higher amounts of geopolymer gel and amorphous content. Between 150 °C and 300 °C, the rate of weight loss for all samples started to slow as the physical free water had already evaporated, and the interstitial water [Citation31] started to decompose, and these are the water molecules that were possibly associated with sodium cations [Citation32]. The gradual weight loss between 300 °C and 600 °C is attributed to the de-hydroxylation of the chemically bound silicon-hydroxyl group giving (silicon–oxygen–silicon) bridge with loss of water [Citation32,Citation33].
Fig. 9 DTG curves of pure geopolymer and geopolymer nano-composites.
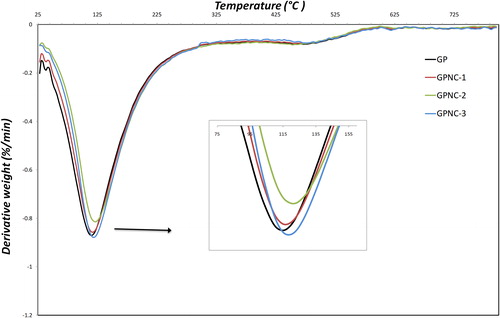
Between 600 °C and 700 °C the weight loss was very slow and attributed to the burning of the remnants of coal in the fly ash [Citation26]. Carbon remnants in the fly ash are 1.45 wt% (). This is clear particularly above 600 °C in DTG curves where a small hump displayed a small change of the weight loss ().
The presence of 1.0, 2.0, and 3.0 wt% nano-clay decreased the weight loss of geopolymer from 12.4% to 12.1, 11.5 and 11.8% (), respectively, revealing that the highest enhancement to the thermal stability of geopolymer matrix was 2.0 wt% nano-clay.
4 Conclusions
Pure geopolymer and geopolymer nano-clay composites have been synthesized and characterized in terms of mechanical, thermal, and microstructural properties. It has been shown that the addition of 2.0 wt% nano-clay to the geopolymer composites enhanced their flexural strength (by 20%) and compressive strength (by 23%). However, adding more nano-clay showed no further increase in these properties due to agglomeration and poor dispersion of higher amount of nano-clay, which resulted in increased porosity. XRD and FTIR analyses demonstrated an increase in the amorphous phase and geopolymerization after the addition of nano-clay to the geopolymer paste. SEM micrographs showed a denser matrix, and a lower content of unreacted fly-ash particles after the addition of nano-clay. TGA and DTG investigations of these nano-composites indicated that the sample loaded with optimum addition of nano-clay has lower content of moisture, which confirm the results of previous measurements.
Acknowledgment
The authors would like to thank Ms. E. Miller from the Department of Applied Physics at Curtin University for the assistance with SEM.
Notes
Peer review under responsibility of The Ceramic Society of Japan and the Korean Ceramic Society.
References
- B.C.McLellanR.P.WilliamsJ.LayA.V.RiessenG.D.CorderJ. Clean. Prod.19201110801090
- F.Pacheco-TorgalZ.AbdollahnejadA.F.CamoesM.JamshidiY.DingConstr. Build. Mater.302012400405
- J.DavidovitsJ. Therm. Anal.37199116331656
- P.N.LemougnaK.MacKenzieU.F.C.MeloCeram. Int.37201130113018
- D.D.HigginsCem. Concr. Compos.252003913919
- J.L.ProvisA.PalomoC.ShiCem. Concr. Res.782015110125
- C.FeroneB.LiguoriI.CapassoF.ColangeloR.CioffiE.CappellettoR.Di MaggioAppl. Clay Sci.1072015195204
- W.M.KrivenJ.L.BellM.GordonCeram. Trans.1532003227250
- T.LinD.JiaP.HeM.WangD.LiangMater. Sci. Eng. A4972008181185
- T.Phoo-ngernkhamP.ChindaprasirtV.SataS.HanjitsuwanS.HatanakaMater. Des.5520145865
- A.NazariJ.G.SanjayanMeasurement602015240246
- M.SaafiK.AndrewP.L.TangD.McGhonS.TaylorM.RahmanS.YangX.ZhouConstr. Build. Mater.4920134655
- F.U.A.ShaikhS.W.M.SupitConstr. Build. Mater.702014309321
- A.HakamyF.U.A.ShaikhI.M.LowJ. Mater. Sci.49201416841694
- H.AlamriI.M.LowComposites Part A4420132331
- ASTM C-20Standard test methods for apparent porosity, water absorption, apparent specific gravity, and bulk density of burned refractory brick and shapes by boiling water2010
- T.AlomayriF.U.A.ShaikhI.M.LowMater. Des.572014360365
- S.F.U.AhmedJ. Mater. Civ. Eng.23201113111319
- I.M.LowM.McGrathD.LawrenceP.SchmidtJ.LaneB.A.LatellaK.S.SimComposites A382007963974
- ASTM C109Standard test method for compressive strength of hydraulic cement mortars (using 2-in. or [50 mm] cube specimens)2013
- A.Fernández-JiménezA.PalomoCem. Concr. Res.35200519841992
- T.AlomayriI.M.LowJ. Asian Ceram. Soc.302013223230
- N.W.Chen-TanA.V.RiessenV.L.Y.ChiD.C.SouthamJ. Am. Ceram. Soc.922009881887
- T.BakharevCem. Concr. Res.36200611341147
- W.D.A.RickardR.WilliamsJ.TemuujinA.V.RiessenMater. Sci. Eng. A528201133903397
- J.W.PhairJ.S.J.VanDeventerInt. J. Miner. Process.662002121143
- H.AlamriI.M.LowComposites A4420132331
- E.U.HaqS.K.PadmanabhanA.LicciulliCeram. Int.40201429652971
- D.ZaharakiK.KomnitsasV.PerdikatsisJ. Mater. Sci.45201027152724
- Q.LiH.XuF.LiP.LiL.ShenJ.ZhaiFuel972012366372
- C.FeroneF.ColangeloG.RovielloR.CioffiC.MennaD.AsproneA.BalsamoA.ProtaG.ManfrediMaterials6201319201939
- D.S.PereraE.R.VenceK.S.FinnieM.G.BlackfordJ.V.HannaD.J.CassidyN.P.BansalJ.P.SinghW.M.KrivenAdvances in Ceramic Matrix Composites XI2006The American Ceramic Society225236
- C.Y.LaiA.GrothS.GrayM.DukeWater Res.5720145666