
 ?Mathematical formulae have been encoded as MathML and are displayed in this HTML version using MathJax in order to improve their display. Uncheck the box to turn MathJax off. This feature requires Javascript. Click on a formula to zoom.
Abstract
In this study, the influence of CeO2, Nd2O3, Sm2O3 and Gd2O3 on various properties of the melt-quench route derived SrO–CaO–ZnO–B2O3–SiO2 glass have been investigated. Both the precursor glasses and heat treated glasses are characterized by dilatometry, differential scanning calorimetry (DSC), X-ray diffraction (XRD), field emission scanning electron microscopy (FESEM), Fourier transformed infrared spectroscopy (FTIR) and X-ray photoelectron spectroscopy (XPS). The density and coefficient of thermal expansion of the glasses varies in the range 3.557–3.804 g cm−3 and 10.5–11.2 × 10⁻⁶ K−1 (50–800 °C) respectively. Decrease in crystallization tendency with increase in cationic field strength of the ions is well supported by the increasing crystallization activation energy of the glasses calculated by Kissinger, Augis–Bennett and Ozawa models. XPS study revealed the presence of both Ce3+ and Ce4+ ions and an increase in characteristic binding energy of the respective rare earth elements from their core level studies. The Knoop hardness of the glasses varies in the range 6.03–6.28 GPa. The glass transition, glass softening and crystallization temperature; density and hardness of the glasses increased with increase in cationic field strength of the incorporated ions. The thermomechanical properties of the Gd2O3 containing glass advocate its applicability as the most promising sealant in solid oxide fuel cell.
1 Introduction
The solid oxide fuel cell (SOFC), a source of renewable energy has been studied actively and extensively all over the globe in order to address the energy crisis in the upcoming centuries. Hermitic sealing is the most prior requirement for ensuring the efficiency and durability of the planar SOFC (pSOFC), which proclaims superiority over its tubular counterpart due to its high power density and easy fabrication [Citation1]. Continuous and significant worldwide research on reliable sealant for pSOFC, during the last decades has concluded glass/glass-ceramic as the promising material for this application [Citation2–Citation5]. Glasses are inexpensive, relatively easy to incorporate into standard manufacturing processes and their properties can be tailored for specific applications [Citation6]. Among the various types of glass/glass-ceramic sealants alkali free alkaline-earth borosilicate glasses of the SrO–CaO–ZnO–Al2O3–TiO2–B2O3–SiO2 glass system are studied extensively in terms of their thermal and mechanical stability, chemical compatibility and crystallization kinetics for SOFC application by different research groups [Citation7–Citation11].
Rare earth containing glasses have attracted a great deal of interest due to their macroscopical properties such as high mechanical resistance, chemical stability and heat-resistance [Citation12]. The rare earth ions can participate in the overall bonding of the glass to tailor the desired properties since their structural roles in the glass structure are related to their size and coordination number [Citation13]. It is well known that lanthanum oxide controls the viscosity (flow ability) and coefficient of thermal expansion (CTE) of the glasses [Citation14]. The control on viscosity helps the sealant to maintain necessary fluidity after softening as well as the required mechanical rigidity after ceramization. In addition to these, minimized CTE mismatch of the glass ceramic sealant with the fuel cell components leads to long term stability and thermal cyclability of the stack. The oxidation kinetics of Cr diffusion of the Crofer22APU interconnect material used in SOFC can be reduced by modifying the glass composition adding oxides of reactive elements, like La, Ce and Y. Further it is also reported that rare earth elements are also added to optimize the alloying elements of interconnects to get the desired oxide coating which is responsible for electron conduction capacity of the materials [Citation15].
Kansal et al. has investigated the influence of different rare earth oxides (La, Nd, Gd and Yb) on the structure and crystallization behavior of diopside based glasses [Citation16]. Angeli et al. has studied the effect of lanthanum in the borosilicate glass structure and its interactions with lower field strength cation, calcium. They found no clustering of lanthanum atoms and they are uniformly distributed in the glass structure, surrounded by about 6 non-bridging oxygen atoms and mixed with calcium atoms to the detriment of the number of BO4 groups [Citation17]. Wang et al. has studied the effects of La2O3 and CeO2 addition on the crystallization and transparency of glass-ceramics prepared via heat treatment of glass from the MgO–Al2O3–SiO2 system [Citation18]. Reddy et al. has studied the thermal stability of rare earth (La, Nd, Gd, Yb) containing glass and glass-ceramics of the system CaO–MgO–SrO–Al2O3–SiO2–B2O3 for their application as sealants in SOFCs [Citation19].
In view of the role played by rare earth oxides in tailoring the crucial properties like viscosity, thermal expansion, adhesion and flow for SOFC sealing application a range of rare earth (Ce, Nd, Sm and Gd) containing alkaline-earth borosilicate glasses of the SrO–CaO–ZnO–B2O3–SiO2 (SCZBS) system have been synthesized as potential materials for sealing applications in SOFC. In our previous study the SCZBS glass with 4 mol% of lanthanum oxide was found to be suitable for SOFC application [Citation20]. Therefore in order to find out the effect on their properties, SCZBS glasses incorporated with 4 mol% of Ce, Nd, Sm and Gd oxide have been investigated in terms of their thermal, mechanical, structural and microstructural properties. However this kind of study on the SCZBS glass system has not been reported yet.
2 Experimental procedure
2.1 Preparation of precursor glass
Glasses having composition 23SrO–23CaO–5ZnO–5B2O3–40SiO2–4MxOy (mol%), where, M = Ce, Nd, Sm and Gd were prepared following the conventional melt-quench technique. 60 g homogeneous batch mixture of pure raw materials of CaCO3 (98%, Extra pure; Loba Chemie, Mumbai, India), SrCO3 (99%, Extra pure; Loba Chemie, Mumbai, India), ZnO (GR, 99%; Loba Chemie, Mumbai, India), H3BO3 (GR, 99.5%; Loba Chemie, Mumbai, India), SiO2 (99.8%; Sipur A1 Bremtheler Quartzitwerk, Usingen, Germany), CeO2 (99.99%, IREL, India), Nd2O3 (99.99%, IREL, India), Sm2O3 (99.99%, IREL, India) and Gd2O3 (99.9%, IREL, India) were melted in a 60 ml platinum crucible at 1500 °C for 2 h in air with intermittent stirring. The molten glasses were quenched on a preheated iron plate. The obtained bulk glasses were immediately annealed at 600 °C for 2 h. Cylindrical samples (φ = 6 mm, L = 25 mm) were prepared from these glasses for dilatometric experiment. The remaining glasses were heat treated at 880 °C for 2 h.
2.2 Characterization
Differential scanning calorimetry (DSC) of the glass powder (≈31 mg) was carried out in nitrogen atmosphere from room temperature to 1100 °C at the rate of 10 °C/min with the help of an instrument (LABSYS evo; Setaram, Caluire, France). The glass transition temperature (Tg) and crystallization peak temperature (Tc) were determined from the DSC thermograms. To study the crystallization kinetics, the glass powder was heated at variable heating rates of 5, 10, 15 and 20 °C/min.
The glass transition temperature (Tg), dilatometric softening temperature (Td) of cylindrical sample (φ = 6 mm, L = 25 mm) were determined using a horizontal loading dilatometer (Model DIL 402 PC; NETZSCH-Gerätebau GmbH, Selb, Germany). The CTE of both the glass and heat treated glasses were measured with the help of this instrument.
Archimedes’ method was employed to measure the apparent density of the precursor glasses using double distilled water as the immersion liquid for the measurements. The refractive indices of all the precursor glasses were measured using Metricon 2010/M prism coupler equipped with diode laser sources of five different wavelengths 473 nm, 532 nm, 632.8 nm, 1064 nm, and 1552 nm. In this study the value of refractive index at 632.8 nm is mentioned only.
The X-ray diffraction (XRD) of the glass and heat treated glasses were investigated using a XPERT-PRO MPD diffractometer (PANalytical, Almelo, Netherlands). The source of X-ray used was Ni filtered CuKα (λ ≣= 1.5406 Å) irradiated at 40 kV and 40 mA⋅ The scan range was 5°–90° with a step size of 0.05°.
Microstructural studies of the heat treated glasses were done using a field emission scanning electron microscope (FESEM) (Model Zeiss Sigma, Carl Zeiss Microimaging GmbH, Berlin, Germany). For this purpose the finely polished samples were etched with 2 vol% HF aqueous solution for 10 min.
The infrared transmittance spectra of glass and heat treated glasses were recorded in the wave number range 400–1400 cm−1 with the help of Fourier transformed infrared spectrometer (FTIR) (Model 1615 Series; Perkin-Elmer Corporation, Norwalk, CT, USA). For this purpose pellets were prepared by mixing the sample powder with KBr in 1:300 ratios.
The X-ray photoelectron spectroscopy (XPS) analysis of all the glasses was carried out by using a PHI 5000Versa Probe II X-ray photoelectron spectrometer with monochromatic Al Kα (1486.6 eV) line radiation. XPS spectra of Ce, Nd, Sm 3d and Gd 4d core levels along with the survey spectra of all the glasses were acquired with the help of this spectrometer.
The Knoop hardness of the glass and heat treated glasses were determined using (Clemex CMT, Longueuil, Canada) instrument equipped with a pyramid shaped indenter. Average of 10 indentations was taken for all the samples applying 50 gf loads for 10 s. The diagonals of the different indents were measured using the optical microscope attached with the instrument and consequently the hardness values were calculated using the standard Eq. Equation(1)(1)
(1) for the Knoop geometry,
(1)
(1) where HK is the Knoop hardness in kg/mm2; P is the normal load in kg; L is length of indentation along the long axis and CP is the correction factor related to the shape of the indenter (=0.070279).
3 Results and discussion
For all the investigated compositions, melting at 1500 °C for 2 h was adequate to obtain bubble-free transparent glasses. Absence of any crystalline inclusions in the as prepared and annealed glasses was confirmed by XRD. The compositions of the four investigated glasses are given in .
Table 1 Chemical composition of the investigated glasses.
3.1 Thermal properties of glass
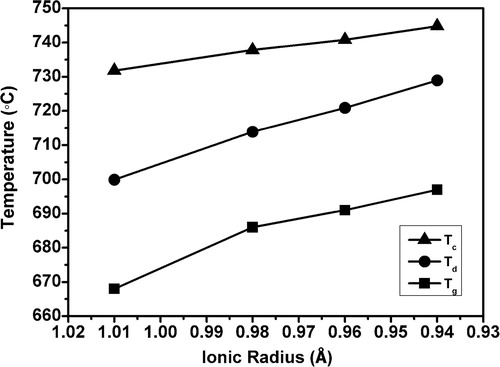
The thermal properties of the glasses, obtained from DSC and dilatometry are listed in . The DSC thermograms shown in , feature well defined single exothermic crystallization curves. The existence of a single crystallization exotherm signifies that either the glass-ceramic formed as a result of crystallization is monomineral or different crystalline phases appear from the glass matrix almost simultaneously and the crystallization curve is the resultant of all these crystalline phases. It is clearly evident that the crystallization peak temperature Tc shifted to higher temperature with decrease in ionic radii from glass N–Ce to N–Gd. The dilatometric curves shown in clearly depict the shifting of Td for N–Gd with respect to N–Ce due to the high cationic field strength of Gd3+ ion than Ce3+. is showing a monotonous increase in Tg, Td and Tc with decrease in ionic radii for glass N–Ce to N–Gd. These behaviors reflect the effect of reducing ionic radius of rare earth elements which is accompanied with an increase in cationic field strength that increases the bond strengths [Citation21]. The decrease in coefficient of thermal expansion of the precursor glasses in the temperature range 50–600 °C given in is also correlated with the increases in the bond strengths that restrict the increase in bond length with temperature [Citation22]. But the CTE of the heat treated glasses increase from 10.5 × 10⁻⁶ K−1 for N–Ce to 11.2 × 10⁻⁶ K−1 for N–Gd in the temperature range 50–800 °C which may be attributed to the formation of crystal phases due to heat treatment. However the CTE values obtained for the glasses and heat treated glasses are in the desired range of 9–13 × 10−6 K−1 required for SOFC seal application [Citation23,Citation24]. The changes in properties observed due to the incorporated rare earth ions are consistent with those reported elsewhere [Citation13,Citation25,Citation26].
Table 2 Different thermal properties of the investigated glasses.
Fig. 1 DSC thermograms of the precursor glasses.
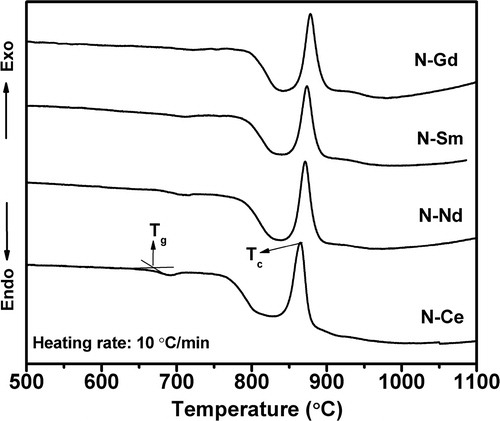
Fig. 2 Dilatometric thermograms of the precursor glasses.
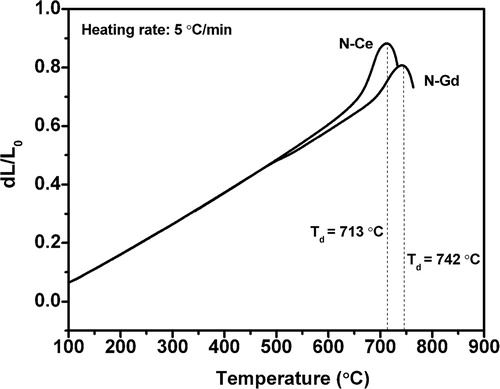
Fig. 3 Variation of Tg, Td and Tc as a function of ionic radius of the rare earths added in glass.
3.2 Density and refractive index
The apparent density of the glasses are calculated using the following Archimedes’ formula,(2)
(2) where ρg is the apparent density of the glass, ρl is the density of the immersion liquid, wa is the weight of the glass in air and ws is the weight of the glass in the immersion liquid. The density of the immersion liquid i.e. the double distilled water is taken as 1 g cm−3. The calculated density of the glasses increased from 3.557 to 3.804 g cm−3 for N–Ce to N–Gd. The refractive index (n) of a particular medium is defined as the ratio of the velocity of light in vacuum (c) to the velocity of light through the medium (v) and is given by the following equation,
(3)
(3)
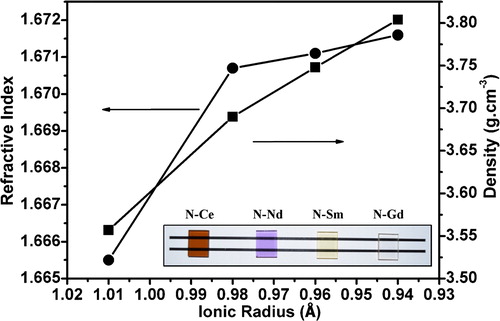
The refractive index (RI) of the glasses measured at 632.8 nm is found to increase from 1.6655 to 1.6716 for N–Ce to N–Gd. The variation of density and refractive index of the glasses with ionic radii is represented in . The inset figures are showing the finely polished precursor glass samples.
Fig. 4 Variation of density and refractive index as a function of ionic radius of the rare earths added in glass. Inset picture shows the precursor glasses.
The refractive index of a glass is determined by the interaction of light with the electrons of the constituent atoms of the glass. If the networks formed by the primary glass forming oxides contain a large number of empty interstices, it should be possible to stuff a correspondingly large number of modifier ions into these interstices. Such a process would increase the mass of a substance without increasing its bulk volume, resulting in an increase in density [Citation27]. It is well known that for the rare earth elements with increase in atomic number from cerium (Ce) to gadolinium (Gd) the ionic radii decreases and the ionic field strength increases by virtue of “lanthanide contraction” [Citation28]. So it is speculated that the rare earth ions have occupied the interstitial places in the glass network and their increase in cationic field strength along with the atomic weight have made the glass network more compact resulting an increase in molecular weight of the glass without increasing the volume. This has lead to a monotonous increase in density of the glasses from N–Ce to N–Gd. Observing the outermost electronic configuration of the elements Ce (4f26s2), Nd (4f46s2), Sm (4f66s2) and Gd (4f75d16s2) it is evident that with increase in atomic number from 58 to 64 the extra two electrons are added to the 4f orbital only. This leads to an increase in electron density of the ions. So with increase in density of the glass network and the electron density of the ions the velocity of light in the medium decreases and the RI of the glass increase from N–Ce to N–Gd. Therefore the density and RI of the SCZBS glasses increases due to incorporation of rare earth ions with reducing ionic radii.
3.3 Crystallization study
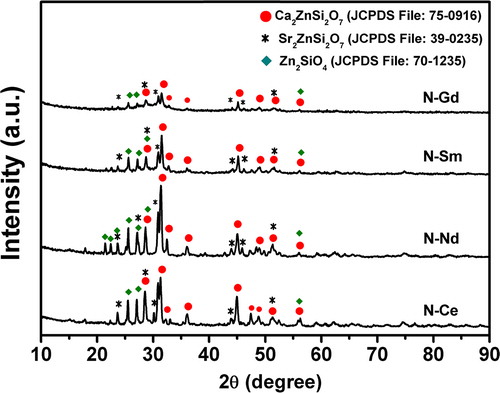
The XRD pattern of all the heat treated glasses is shown in . The precursor glasses showed a broad halo in their diffraction pattern (pattern not shown) without any peak, which implies that these samples are amorphous in nature. The diffraction peaks of the precursor glasses heat-treated at 880 °C for 2 h are identified as the peaks of the crystalline phases like Ca2ZnSi2O7, hydrostonite (JCPDS File:75-0916), Sr2ZnSi2O7, strontium zinc silicate (JCPDS File:39-0235) and Zn2SiO4, willemite (JCPDS File:70-1235). Hydrostonite and strontium zinc silicate are crystallized in tetragonal structure whereas willemite is crystallized in hexagonal structure [Citation29–Citation31]. The decreasing intensity of the diffraction peaks evident in indicates decline in crystalline growth rate at 880 °C from sample N–Ce to N–Gd. This may be attributed to the structural role of the rare earth ions (Ce3+, Nd3+, Sm3+, Gd3+) in borosilicate glasses which is further determined by their ionic radii and by their ionic field strength. Shelby and Kohli have discussed that the higher the ionic field strength of the rare earth ions the stronger the rare earth ion and oxygen bond that leads to the higher glass crystallization temperature [Citation20]. So with increase in the field strength of the ions and hence the bond strength in glass N–Ce to N–Gd the structural rearrangement required for crystallization is constrained which is depicted in terms of decreasing diffraction peak intensity. These results are completely in agreement with the increasing crystallization peak temperature obtained from DSC studies. To confirm these findings further studies were conducted using FESEM.
Fig. 5 X-ray patterns of the glasses heat treated at 880 °C for 2 h.
It is well known that the CTE of the glass-ceramic is effectively controlled by the type (high or low CTE) and percentage of crystalline phase. Once the glass becomes glass-ceramics the thermal stress generated between the residual glassy phase and the crystals should be managed critically. Otherwise during thermal (cooling) cycling of the SOFC stack cracks are more likely to develop in the sealant. However if the evolution of crystal phases occur slowly, the stress generated can be compensated by the residual glassy phase and hence chances of cracking can be minimized. Hence from the above findings it may be said that addition of Gd2O3 in SCZBS glass system will lead to a thermally stable glass sealant for SOFC.
3.4 Microstructural study
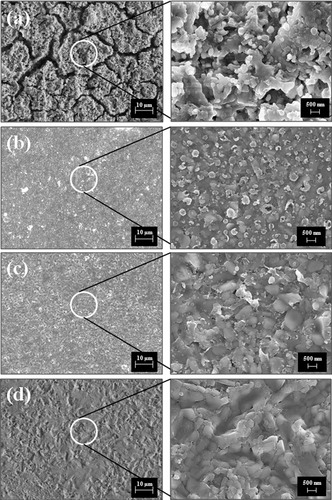
Microstructural studies of all the heat treated glasses have been done to study the nature of crystal growth and their distribution in glass matrix. The FESEM photomicrographs of sample N–Ce, N–Nd, N–Sm and N–Gd are presented in (a)–(d) respectively under both low and high magnification. The microstructures reveal decline in the extent of crystallization from sample N–Ce to N–Gd in accordance with the X-ray diffraction analysis. The glass matrix of N–Ce is showing a completely distinct microstructure in comparison to the other glasses although all the samples are etched in 2 vol% of HF aqueous solution for 10 min. There are formation of cracks like that of the farming land in summer which may be due to shrinkage of the glass matrix with heat treatment at 880 °C for 2 h. Whereas this kind of crack formation is not revealed in the photomicrographs of rest of the samples. Formation of crystals of particulate nature is clearly evident in the high magnification photomicrograph of this glass sample. In the matrix of sample N–Nd very less crystallization has occurred and in sample N–Sm crystallization is going to be initiated. Above all, sample N–Gd is showing a microstructure composed of maximum percentage of residual glassy phase. Even the high magnification photomicrograph is clearly showing the continuous impervious glassy layer. This kind of microstructure suggests the potential application of the glass N–Gd as a thermally cyclable hermitic sealant in SOFC. Therefore the FESEM analysis also suggests that with increase in cationic field strength of the incorporated rare earth ions the extent of crystallization is effectively constrained.
Fig. 6 FESEM photomicrographs of heat treated glass samples (a) N–Ce, (b) N–Nd, (c) N–Sm and (d) N–Gd at 880 °C for 2 h along with their enlarged view under high magnification.
3.5 FTIR study
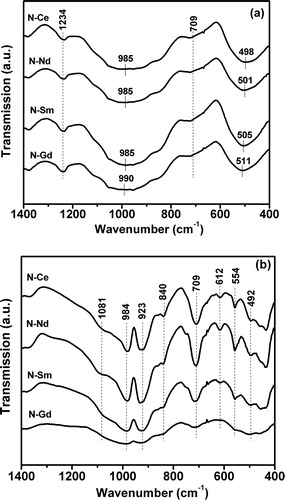
The room temperature FTIR transmission spectra of all the four precursor glasses and the heat treated glasses are shown in (a) and (b) respectively. The spectra of precursor glasses exhibit four absorption bands in the wave number region of 400–600 cm−1, 700–750 cm−1, 750–1200 cm−1 and 1200–1300 cm−1. The broad absorption band observed indicates the general disorder in the silicate network mainly due to a wide distribution of Qn (polymerization in the glass structure, where n denotes the number of bridging oxygens) units occurring in these glasses [Citation32]. The absorption bands in the 400–600 cm−1 regions are due to bending vibrations of Si–O–Si linkages while the broad bands in the 750–1200 cm−1 region are assigned to the stretching vibrations of the SiO4 tetrahedron with a different number of bridging oxygen atoms [Citation33,Citation34]. The symmetric and the antisymmetric stretching modes of the Si–O–Si bonds of the Qn units are IR active in the 750–1200 cm−1 region. The 750–1200 cm−1 absorption band may also contain 4 sub absorption bands: 1060–1105 cm−1 (from the Q3 units), 949–1010 cm−1 (from the Q2 units), ∼917 cm−1 (from the Q1units) and ∼872 cm−1 (from the Q0 units) [Citation22]. For the band at 1170–1250 cm−1, some reports suggested that this is attributed to the stretching vibration of B–O–B linkages in the B2O54− unit, whereas some other report informed that it is attributed to the stretching vibration of Q4, because the Q4 groups exhibit additional features in this region [Citation35,Citation36]. For the glasses N–Ce, N–Nd, N–Sm this absorption band in the region 750–1200 cm−1 is centered at 985 cm−1 whereas for the glass N–Gd it is centered at 990 cm−1 which indicates the distribution of Q2 units in these glasses. However shifting of this band to higher frequency from 985 cm−1 to 990 cm−1 in case of glass N–Gd may be due to the structural changes associated with variation of inter tetrahedral Si–O–Si bond angles, according to the Central Force Model [Citation37]. It is evident from the transmission spectra ((a)) that the peak of the 400–600 cm−1 absorption band shifts to a higher frequency from 498 cm−1 to 511 cm−1. Thus, there is more difficulty in the bending vibration of Si–O–Si linkages with an increase in the cationic field strength of the incorporated ions from glass N–Ce to N–Gd. The absorption band in the 700–750 cm−1 region is attributed to the bending vibration of B–O–B linkage of various borate segments whereas the band in the 1200–1300 cm−1 region is assigned to stretching vibration of B–O–B linkage associated with the trigonal [BO3] units [Citation38–Citation40]. On the other hand, the transmission spectra of the heat treated glasses ((b)) are showing evolution of several peaks in the above mentioned band regions due to structural arrangements in the glass network with heat treatment. The corresponding band assignments to the evolved peaks are given in . The peak at 709 cm−1 in the wave number region 700–750 cm−1 is assigned to B–O bending vibration modes of [BO3] units. The high intensity of this peak in case of N–Ce and N–Nd indicates incorporation of B–O–B linkage into the silicate crystalline phase since no borate crystalline phases have been revealed in the XRD studies. The peak at 840 cm−1 is assigned to Si–O stretching vibration with two non-bridging oxygens (NBOs) per SiO4 tetrahedron which is also represented as Q2 [Citation41]. Also the peak at 923 cm−1 is assigned to –O–Si–O− stretching vibration with two NBOs [Citation42]. It may be noticed that the intensity of this peak is increasing from sample N–Gd to N–Ce which implies an increase in the number of NBOs in the glass matrix. Therefore the incorporated rare earth ions act as modifier in the glass matrix as described by Volf in reference [Citation43]. However it is clear that with increase in cationic field strength of the ions from Ce3+ to Gd3+ the evolution of peaks due to heat treatment is not that much pronounced. These results indicate decreasing structural arrangements in the glass network which is also reflected in the XRD studies. Thus the FTIR study revealed the presence of the characteristic bond vibrations associated with the glass formers present in the glass system and based on these results it is concluded that the thermal treatment have affected the glass structure which are associated with [SiO4] units mainly. This inference also supports the predominant formation of silicate crystalline phases identified in the X-ray diffraction studies.
Table 3 FTIR spectral band position and assignment.
Fig. 7 FTIR spectra of (a) precursor glasses and (b) glasses heat treated at 880 °C for 2 h.
3.6 Crystallization kinetic study
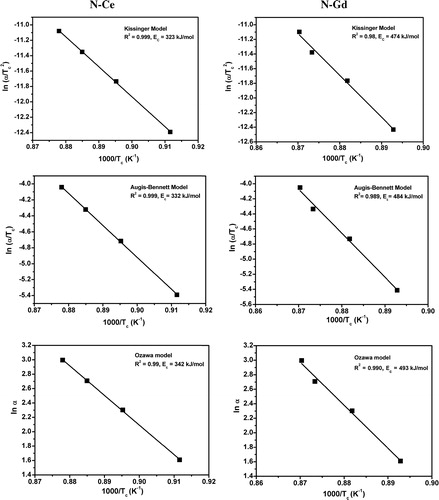
The crystallization kinetic study of all the glasses has been carried out at four different heating rates such as 5, 10, 15 and 20 °C/min. It is observed that the crystallization peak temperature of the glasses shifted to higher values of temperature with increase in heating rate. The activation energy of crystallization has been calculated applying the Kissinger, Augis–Bennett and Ozawa models [Citation44–Citation46]. Chemical reaction rates are most often considered to be a function of only two time-dependent variables, temperature T and chemical conversion x (which varies from 0 to 1 from initiation to completion). The usual relationship incorporating the Arrhenius expression is:(4)
(4) This equation relates the reaction rate dx/dt to three distinct kinetic parameters: the pre-exponential factor A, the activation energy E, and the reaction model f(x). As a set, these three parameters are referred to as the “kinetic triplet”. Determination of the kinetic triplet is a common way to establish a mathematical relationship between the reaction rate dx/dt, the extent of conversion (x), and the temperature (or time). The extent of the conversion (x) is determined experimentally as a fraction of the overall change in a physical quantity that represents the reaction progress as a function of time t or temperature T. If the reaction process is accompanied by heat flow, such as measured in a DSC or other heat flow device, then the extent of conversion at T or t is given as the ratio of the amount of evolved (or consumed) heat to the total amount of heat released (or absorbed) in the process.
| (i) | nth order reaction model Most existing methods were developed by assuming an nth order reaction: | ||||
| (ii) | Kissinger model Kissinger model is the most commonly used model in analyzing the activation energy of crystallization. This model describes the dependence of peak temperature on heating rate for a crystallization event. To estimate the activation energies for crystallization, this method has been applied for the analysis of highest exothermic peaks detected in DSC curves using the following equation: | ||||
| (iii) | Augis–Bennett model The activation energy of the glasses is calculated applying Augis–Bennett model which is based on the following equation, | ||||
| (iv) | Ozawa model In addition to Kissinger and Augis–Bennett model the activation energy of the glasses are calculated applying Ozawa model also. This model is based on the following equation, | ||||
Table 4 Activation energy of crystallization of the glasses evaluated by different models.
Fig. 8 Crystallization kinetics study by Kissinger, Augis–Bennet and Ozawa models of glass samples N–Ce and N–Gd. Lines are obtained by linear fitting of the data.
3.7 XPS study
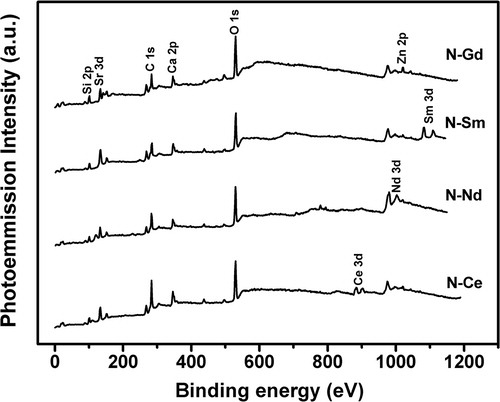
XPS was carried out to identify the chemical composition and valence state of the rare earth elements. Survey spectra in the 0–1200 eV range taken from the freshly fractured sample surfaces are shown in . Besides the expected Si, O, Sr, Ca, Zn, Ce, Nd, Sm and Gd peaks, a C 1s peak was observed in all the examined samples. This carbon peak has come due to the adsorption of hydrocarbon impurities [Citation48]. This peak does not affect the interpretation of results and, in fact, it was used for binding energy (BE) calibration by setting its BE at 285 eV in order to correct the sample charging. The increase of the cationic field strength of the incorporated ions causes no modifications in the XPS spectra of the glasses.
Fig. 9 The XPS survey spectra of all the precursor glass samples.
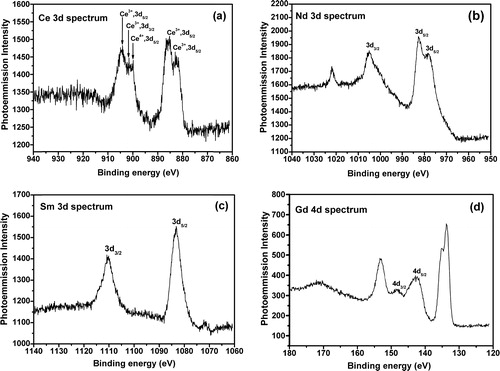
XPS spectra for the Ce 3d, Nd 3d, Sm 3d and Gd 4d core level photoelectrons were obtained in order to determine accurately the BE and the splitting energy and are shown in (a)–(d) respectively. These XPS spectra present the spin–orbit splitting. The electronic state is split into two states by the spin–orbit coupling because the magnetic moments due to electron spin and orbital motion may either reinforce or oppose each other. Thus, two peaks with different binding energies occur in the XPS spectra in place of a single peak. (a) shows the Ce 3d core level spectrum in the region 860–940 eV. From the spectrum, it is shown that both 3+ and 4+ valence states of cerium are present. The main intense peak of Ce3+ 3d3/2 and Ce3+ 3d5/2 are located at a binding energy of 901.5 and 885.2 eV respectively. The other two peaks for Ce3+ 3d5/2 are shown at binding energies of 882.9 eV, 904.1 eV and one peak for Ce4+ 3d5/2 is shown at binding energy of 899.8 eV. (b) shows the Nd 3d core level spectrum in the region 950–1040 eV. Due to the spin–orbit coupling effect the 3d state has split into two states with BE values of 982.72 eV for the 3d5/2 state and 1005 eV for the 3d3/2 state, respectively. (c) shows the Sm 3d core level spectrum in the region 1060–1140 eV. The 3d5/2 and 3d3/2 state are shown at the BE values of 1083.13 eV and 1110.14 eV respectively. The Gd 4d emission is split into the two spin–orbit components, 4d5/2 and 4d3/2with peak centers at 142.6 and 148.03 eV respectively as shown in (d). There may be some multiplet splitting superimposed since the 4d3/2 peak is broader than the 4d5/2 peak. These spectra are fully consistent with the previous results by others [Citation49–Citation52]. The Gd 3d core level that splits into 3d5/2 and 3d3/2 at the BE of 1189.6 and 1221.9 eV cannot be studied due to limitation of the instrument. So the characteristic BE value corresponding to their 3d core level is increasing from Ce to Gd with reduction in ionic radii and increase in their field strength. It is well known that the rare earth compounds having unpaired electron can give rise to an extra satellite peak due to photoelectron energy gain and photoelectron energy loss. Since all the ions Nd3+ (4f3), Sm3+ (4f5) and Gd3+ (4f7) have one unpaired electron; the unassigned peaks in the spectra may be defined as the satellite peaks raised due to additional electronic transitions of these electrons. Dimitrov and Komatsu have proposed a classification of the simple oxides based on the correlation existing between the electronic polarizability and the binding energy of the oxygen ions [Citation53]. They have established that the O 1s electrons binding energy of different oxides varies in the 528.0–533.5 eV range and its value corresponds to the different degrees of ionicity in the metal ion oxygen bonds. The simple oxides have been categorized into three groups: (i) semi covalent oxides with the O 1s BE in the 530.5–533.0 eV range; (ii) normal ionic oxides with the O 1s BE at 530 ± 0.4 eV; (iii) very ionic oxides with the O 1s BE in the 529.5–528.0 eV range. The O 1s BE of the glasses N–Ce, N–Nd, N–Sm and N–Gd is found to be 530.00, 529.25, 530.76 and 530.05 eV respectively from the survey spectra of the precursor glasses (). Thus according to this approach the SCZBS glasses studied here could be considered as semicovalent compounds. Therefore the XPS studies of the glasses confirmed their chemical composition and revealed the spin–orbit splitting and the characteristic binding energies of the incorporated rare earth elements.
Fig. 10 The XPS core level spectra in the respective precursor glass samples (a) N–Ce, (b) N–Nd, (c) N–Sm and (d) N–Gd.
3.8 Mechanical properties
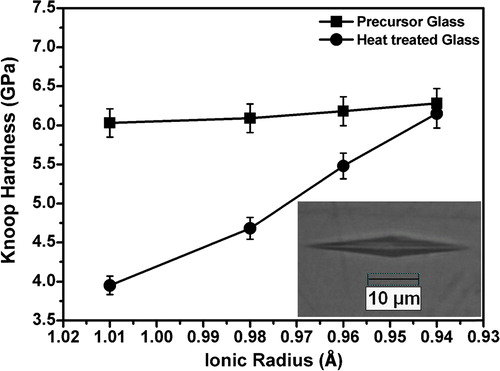
In order to estimate their mechanical reliability for SOFC application the micro hardness of the sealants should be investigated [Citation54]. The Knoop micro hardness of the precursor and heat treated glasses has been determined applying 50 gf load and the variation of hardness with ionic radii is represented in . For each sample the hardness value is determined by calculating the average of 10 indentations taken with a spacing of 150 μm. The hardness value is found to increase from 6.03 to 6.28 GPa for precursor glass N–Ce to N–Gd and from 3.95 to 6.15 GPa for the respective heat treated samples. So it is observed that hardness is increasing with the decreasing ionic radii or increasing cationic field strength of the rare earth ions for sample N–Ce to N–Gd. Micro-hardness expresses the stress required to eliminate the free volume (i.e. deformation of the network) of the glass. The increase in the micro-hardness indicates the increase in the rigidity of glass [Citation55]. Hence the increase in hardness found in case of the glasses N–Ce to N–Gd may be attributed to increase in their rigidity with decrease in the free volume in the glass matrix due to increase in the cationic field strength of the incorporated ions. Consequently it requires more stress to deform the more rigid glass matrix. Therefore the hardness value determined for the glass incorporated with high cationic field strength ion is higher. However the hardness values for the heat treated glasses are determined to be less than their precursors. Heydari et al. had explained that the growth of crystalline phase increases the amount of defects which reduces the micro hardness of specimens [Citation56]. The growth of crystalline phase in the heat treated glasses is clearly shown in the X-ray diffractograms as well as the FESEM photomicrographs in and respectively. The matrix of sample N–Ce is showing particulate crystals whereas the extent of crystallization gradually decreases up to sample N–Gd. Accordingly the hardness for heat treated sample N–Ce has decreased considerably whereas it is less for other samples. It may be noticed that sample N–Gd possess the highest hardness value among all the samples studied here. So this glass may be considered as the most promising glass for structural integrity of SOFC stack.
Fig. 11 Variation of hardness of the glasses and the glasses heat treated at 880 °C for 2 h as a function of the ionic radius of the rare earths added in glass. Inset picture is showing representative indentation impression.
4 Conclusions
The effect of rare earth oxides CeO2, Nd2O3, Sm2O3 and Gd2O3 on the thermal, structural, mechanical and microstructural properties of SrO–CaO–ZnO–B2O3–SiO2 (SCZBS) glass system has been investigated in order to establish their applicability as sealants in solid oxide fuel cell. The salient features are as follows:
| • | The characteristic temperatures viz. Tg, Td and Tc increased with increasing cationic field strength of the rare earth ions Ce3+, Nd3+, Sm3+ and Gd3+ whereas the CTE of the glasses decreased. | ||||
| • | Density and RI both followed an increasing tendency due to rare earth ion occupancy in free volume of the glass network and increase in electron density of these ions due to increasing cationic field strength or decreasing ionic radii of these ions. | ||||
| • | Decrease in crystallization peak intensity and increase in crystallization activation energy indicates a restricted structural arrangement in the heat treated glasses due to increase in cationic field strength and hence the bond strength of the bond between the rare earth element and oxygen. FESEM photomicrographs also revealed the decrease in extent of crystallization in the heat treated glasses from N–Ce to N–Gd. | ||||
| • | FTIR spectra of the glasses and heat treated glasses confirmed presence of Q2 silicon polymerization units with two non-bridging oxygens. The increase in intensity of the peak corresponding to the NBOs implies that the rare earth oxides play the role of modifier in the SCZBS glass system. | ||||
| • | XPS study confirmed the chemical composition of the glasses, presence of both 3+ and 4+ cerium ions and revealed the characteristic BE values for the rare earth elements from their core level studies. | ||||
| • | The Knoop hardness of both the glasses and heat treated glasses increased from N–Ce to N–Gd due to increase in rigidity of the glass matrix. | ||||
Considering the highest CTE, density and hardness value along with the slowest rate of crystallization it is logical to conclude that the glass containing Gd2O3 is the most promising sealant for SOFC among the family of glasses studied here.
Acknowledgments
The authors thank Mr. Kamal Dasgupta, Acting Director and Dr. R. Sen, Head, Glass Division of CSIR-CGCRI for their encouragement to carry out this work. They are also thankful to Dr. R.N. Basu, Head, FuelCell and Battery Division for financial support under CSIR-NMITLI project on SOFC. Dr. Atiar Rahman Molla is sincerely thanked for carrying out the crystallization kinetics experiments. The technical support provided by the Material Characterization Division for recording XRD patterns, FESEM photomicrographs and XPS are also thankfully acknowledged.
Notes
Peer review under responsibility of The Ceramic Society of Japan and the Korean Ceramic Society.
References
- T.L.WenD.WangM.ChenH.TuZ.LuZ.R.Zhanget alSolid State Ion.1482002513519
- M.K.MahapatraK.LuJ. Power Sources1920105712957139
- J.W.FergusJ. Power Sources142005746757
- I.W.DonaldP.M.MallinsonB.L.MetcalfeL.A.GerrardJ.A.FernieJ. Mater. Sci.46201119752000
- M.K.MahapatraK.LuMater. Sci. Eng. R6720106585
- P.A.LessingJ. Mater. Sci.42200734653476
- S.T.ReisR.K.BrowJ. Mater. Eng. Perform.152006410413
- S.T.ReisM.J.PascualR.K.BrowC.S.RayT.ZhangJ. Non-Cryst. Solids356201030093012
- T.ZhangR.K.BrowS.T.ReisC.S.RayJ. Am. Ceram. Soc.91200832353239
- C.W.KimJ.H.HsuC.TownsendJ.SzaboR.CrouchR.BairdR.K.BrowProceedings of the Ceramic Engineering Science Advances in Solid Oxide Fuel Cells IX, 342013123132
- J.H.HsuC.W.KimR.K.BrowJ.SzaboR.CrouchR.BairdJ. Power Sources27020141420
- J.E.ShelbyJ.E.ShelbyRare Elements in Glasses1994Trans Tech PublicationsSwitzerland
- H.Abdoli1P.Alizadeh1K.AgerstedCeram. Int.40201475457554
- M.B.VolfChemical Approach to Glass1984ElsevierNY, USA
- H.YokokawaN.SakaiT.HoritaK.YamajiFuel Cells12001117131
- I.KansalA.GoelD.U.TulyaganovJ.M.F.FerreiraCeram. Int.35200932213227
- F.AngeliT.CharpentierE.MolièresA.SoleilhavoupP.JollivetS.GinJ. Non-Cryst. Solids3762013189198
- J.WangC.LiuG.ZhangJ.XieJ.HanX.ZhaoJ. Non-Cryst. Solids419201515
- A.A.ReddyA.GoelD.U.TulyaganovM.SardoL.MafraM.J.PascualV.V.KhartonE.V.TsipisV.A.KolotyginafJ.M.F.FerreiraJ. Mater. Chem. A2201418341846
- N.SasmalM.GaraiA.R.MollaA.TarafderS.P.SinghB.KarmakarJ. Non-Cryst. Solids38720146270
- J.ShelbyJ.T.KohliJ. Am. Ceram. Soc.7319903942
- J.HaoQ.F.ZanD.S.AiJ.T.MaC.S.DengJ.M.XuJ. Power Sources21420127583
- I.W.DonaldB.L.MetcalfeL.A.GerrardJ. Am. Ceram. Soc.912008715720
- C.LaraM.J.PascualA.DuranJ. Power Sources1572006377384
- M.OhashiK.NakamuraK.HiraoS.KanzakiS.HampshireJ. Am. Ceram. Soc.7819957176
- A.MakishimaY.TamuraT.SakainoJ. Am. Ceram. Soc.611977247249
- J.E.ShelbyIntroduction to Glass Science and Technology2nd ed.2005The Royal Society of ChemistryCambridge, UK
- M.SethM.DolgP.FuldeP.SchwerdtfegerJ. Am. Ceram. Soc.117199565976598
- B.E.WarrenO.R.TrautzZ.KristallogrKristallgeom. Kristallphys. Kristallchem.751930525
- B.ScheetzD.PfoertschL.ZellmerD.SmithICDD Grant-in-Aid1987Penn State UniversityUniversity Park, PA, USA
- K.H.KlaskaJ.C.EckD.PohlActa Crystallogr. B3419783324
- F.J.ShackelfordCeramic and Glass Materials2008Springer Science Business Media, LLCMA, Boston
- S.L.LinC.S.HwangJ. Non-Cryst. Solids2021–219966167
- J.T.KohliR.A.CondratrJ.E.ShelbyPhys. Chem. Glasses34199381
- G.D.ChryssikosM.S.BitsisJ.A.KapoutsisE.I.KamitsosJ. Non-Cryst. Solids2171997278290
- F.H.El-BatalE.M.A.KhalilY.M.HamdyH.M.ZidanM.S.AzizA.M.AbdelghanyPhysica B405201026482653
- E.G.ParadaP.GonzalezJ.PouJ.SerraD.FernandezB.LeonM.Perez-AmorJ. Vac. Sci. Technol. A141996436440
- G.FuxiH.GuosongC.ShizhengJ. Non-Cryst. Solids521982203210
- G.FuxiOptical and Spectroscopic Properties of Glass1992Springer-VerlagBerlin
- E.I.KamitsosA.P.PatsisM.A.KarakassidesG.D.ChryssikosJ. Non-Cryst. Solids12619905267
- J.SerraP.GonzalezS.ListeC.SerraS.ChiussiB.LeonM.Perez-AmorH.O.YlanenM.HupaJ. Non-Cryst. Solids33220032027
- F.H.A.ElbatalM.M.I.KhalilN.NadaS.A.DesoukyMater. Chem. Phys.822003375387
- M.B.VolfChemical Approach to Glass1984ElsevierAmsterdam391
- H.E.KissingerJ. Res. Nat. Bur. Stand.571956217221
- J.A.AugisJ.E.BennettJ. Therm. Anal.131978283292
- T.OzawaBull. Chem. Soc. Jpn.38196518811886
- K.H.SunJ. Am. Ceram. Soc.301947277281
- J.F.WattsJ.M.WallsR.SmithSurface Science Techniques1994Elsevier SciencePergamon, UK5
- B.M.ReddyL.KattaG.ThrimurthuluChem. Mater.222010467475
- E.CuleaL.PopV.SimonM.NeumannI.BratuJ. Non-Cryst. Solids33720046267
- K.WandeltC.R.BrundleSurf. Sci.1571985162182
- S.KunduN.SutradharR.ThangamuthuB.SubramanianA.B.PandaM.JayachandranJ. Nanopart. Res.1420121040
- V.DimitrovT.KomatsuJ. Solid State Chem.1632002100
- J.MalzbenderY.ZhaoJ. Mater. Sci.47201243424347
- M.A.SidkeyA.Abd El-MoneimL.Abd El-LatifMater. Chem. Phys.611999103109
- F.HeydariaA.MaghsoudipouraZ.HamnabardbS.FarhangdoustaMater. Sci. Eng. A5522012119124