
 ?Mathematical formulae have been encoded as MathML and are displayed in this HTML version using MathJax in order to improve their display. Uncheck the box to turn MathJax off. This feature requires Javascript. Click on a formula to zoom.
Abstract
In this article we report on solution combustion method to synthesize SrTiO3 nanoparticles (ST-NPs) and the removal of malachite green (MG) azo dye from the aqueous solution. The synthesized ST-NPs were calcined at 600 °C for 2 h. Powder X-ray diffraction (PXRD), field emission scanning electron microscopy (FE-SEM), transmission electron microscopy (TEM), Fourier transform infrared spectroscopy (FT-IR), and Brunauer–Emmett–Teller (BET) were used to characterize the product. Adsorption experiments were performed with cationic malachite green (MG) dye. ∼98% dye was adsorbed onto the ST-NPs at pH 10 for 30 min of the contact time. The optimum adsorbent dose was found to be 0.015 g/L of the dye. To study the adsorption kinetics Langmuir Hinshelwood model was used and the first order kinetic best describes the MG adsorption onto the ST-NPs. The adsorption isotherms data of MG onto ST-NPs obtained were analyzed by Langmuir and Freundlich isotherm models and the results describe the best representation of the Langmuir isotherm model.
1 Introduction
Nowadays, many industries, such as textile, paper/pulp, printing, iron/steel, coke, petroleum, pesticide, paint, use dyes to color their products [Citation1,Citation2]. Dyes possess color due to the presence of chromophore group, having conjugated system and exhibit resonance of electrons, which is a stabilizing force in an organic compound [Citation3,Citation4]. Once it discharges into the river, it causes coloration of water and it is very much harmful for humans and aquatics [Citation5]. Several processes like chemical, biological and physical process have been adopted for the treatment of dyes from wastewater [Citation6]. Adsorption is a well-known equilibrium separation process and superior to other techniques in terms of initial cost, flexibility and it does not result in the formation of harmful substance. Liquid-phase adsorption is one of the most popular methods for the removal of dyes from water [Citation7]. The activated carbon materials from coconut coir, rice husk, neem tree leaves, and orange peel have been used for the removal of dyes from wastewater [Citation8–Citation12].
Malachite green (MG) is a triphenylmethane cationic water soluble dye [Citation13], and when entering into the food chain it causes carcinogenic, mutagenic and teratogenic effects on humans. MG easily undergoes degradation and formed products are toxic and cause damage to liver, lungs and bones [Citation14,Citation15]. Hence it is necessary to remove it from effluent.
ST-NPs were synthesized by various methods like hydrothermal method [Citation16], sol–gel method [Citation17], solid state reaction, spray pyrolysis [Citation18], ultrasonic irradiation method [Citation19], and combustion method [Citation20]. Among these various synthetic methods, combustion method is of great interest because of its low cost and highly pure and homogeneous powders with fine particle size.
The ST-NPs being a perovskite oxide, with high stability and non-toxic in nature, have been used in many applications like water splitting reaction under UV light irradiation [Citation21], electrical applications [Citation22], catalyst [Citation23], superconducting [Citation24], luminescence [Citation25], solid oxide fuel cells [Citation26] due to its band gap of 3.2 eV. Some researchers have studied that the excellent degradation of methyl orange was achieved by Ag-STO [Citation27]. The excellent photo-reduction of Cr(VI) is achieved by ST-NPs [Citation28]. 91% degradation of methyl blue was obtained by ST-NPs which are synthesized by solvothermal method using metatitanic acid as an intermediate. [Citation29]. The photocatalytic degradation of dark green 6 and reactive orange 72 azo dyes using STO-TiO2 nanocomposite has been studied [Citation30]. There is no satisfactory literature on the adsorption of MG dye using the ST-NPs. It creates an interest to proceed with the adsorption of MG using the ST-NPs as an adsorbent.
The present study is focused on the application of ST-NPs as an adsorbent for the removal of MG from the aqueous solution synthesized by solution combustion method using urea as fuel. The effect of various parameters, such as effect of dosage, pH, rate of stirring, initial dye concentration, and its adsorption isotherm and kinetics have also been studied.
2 Experimental
2.1 Materials
Strontium nitrate [Sr(NO3)2·6H2O, AR 99%, Nice], tetra-n-butyl titanate [Ti(OC2H9)4, AR 99%, Merck], urea [NH2CONH2, AR 99%, Thomas Baker], 1:1 nitric acid [HNO3, AR 99%, Fischer Scientific], malachite green dye [C23H25ClN2 chloride, Sigma-Aldrich] and commercial strontium titanate [SrTiO3, Sigma-Aldrich] were used as such without further purification.
2.2 Synthesis of ST-NPs
The ST-NPs were synthesized by solution combustion method [Citation31–Citation33] using tetra-n-butyl titanate and strontium nitrate as starting materials. Hydrolysis of tetra-n-butyl titanate gives TiO(OH)2. The obtained TiO(OH)2 is dissolved with 10 ml of 1:1 nitric acid to obtain TiO(NO3)2. The following reactions take place during the formation.(1)
(1)
(2)
(2)
Then Sr(NO3)2, TiO(NO3)2, and urea were dissolved in minimum quantity of distilled water in a crystalline dish with constant stirring about 30 min on magnetic stirrer to get homogeneous solution. The solution was kept on pre-heated muffle furnace at 450 °C. The solution was boiled and it resulted in highly viscous liquid which catches fire, auto ignited with a flame on the entire volume, forming a white colored powder. The formed powder was calcinated at 600 °C for 2 h. The stoichiometrically balanced exothermic redox reaction between Sr(NO3)2, TiO(NO3)2 and urea can be expressed as follows:(3)
(3)
2.3 Preparation of MG dye solution
To prepare stock solution (10 mg/L) of dye, an accurately weighed amount of the MG was dissolved in distilled water. Experimental solutions of required concentration were obtained by successive dilutions.
3 Characterization techniques
The ST-NPs were characterized by PXRD. The PXRD patterns were collected on a Shimadzu XRD-700 X-ray diffractometer with CuKα radiation in diffraction angle range 2θ = 20–80°, operating at 40 kV and 30 mA. To study the morphology of the ST-NPs, FE-SEM micrographs were recorded on a ZEISS ULTRA 55 scanning electron microscope. TEM micrograph was recorded on a Hitachi H-8100 (accelerating voltage up to 200 kV, LaB6 Filament). FT-IR analysis was studied on a Perkin Elmer Spectrometer (Spectrum 1000) with KBr pellet technique on the range of 400–4000 cm−1. UV–vis spectrum was recorded on double beam Elico SL-210 spectrophotometer. Remi centrifuge was used to separate dye solution from adsorbent. BET surface area was recorded on Brunauer–Emmett–Teller surface area analyzer (ASAP2020) at the bath temperature −196.329 °C.
4 Results and discussion
4.1 PXRD studies
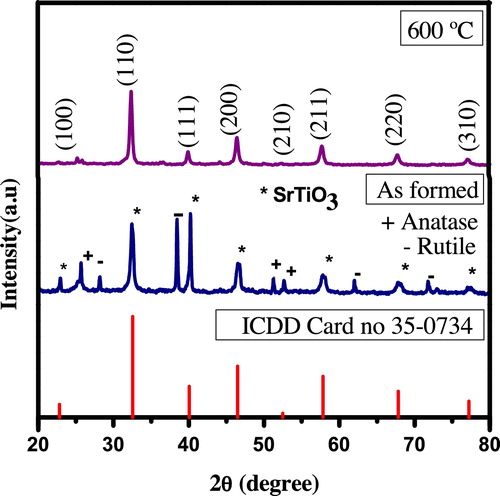
The formation of nanocrystalline phase of the combustion derived ST-NPs was confirmed by PXRD measurements. shows the PXRD pattern of as-formed and calcinated samples. The PXRD pattern of as-formed (formed at 450 °C) product shows the amorphous strontium titanate phase along with anatase and rutile TiO2 peaks. All the diffraction peaks of calcined ST-NPs were indexed to (100), (110), (111), (200), (211), (221), (310) and well matched with JCPDS card no: 35-0734 with space group Pm−3m (No-221). The crystal system of the ST-NPs is cubic with cell parameters a = b = c = 3.9050 Å. The crystal lattice and structural parameters of ST-NPs are presented in . The packing diagram of ST-NPs shows that Sr2+ ions are present at each corner of the cube and Ti4+ is at the center of the cube and each Ti4+ is coordinated by 6O2−. Therefore, each Sr2+ is surrounded by four TiO6 octahedral with equal six Ti–O bonds. Each Sr atom is surrounded by twelve equidistant oxygen atoms. The full width at half maximum (FWHM) of the peaks was relatively broad, indicating nanoscale. The average crystallite size was calculated using Debye–Scherer's formula [Citation34].(4)
(4) where ‘d’ is the average crystalline dimension, λ is the X-ray wavelength (0.154056), ‘k’ is the constant, ‘θ’ is the Bragg's angle and ‘β’ is the full width at half maxima (FWHM). The calculated crystallite size was found to be in the range of 10–15 nm.
Table 1 Crystal lattice and structural parameters of ST-NPs.
Fig. 1 PXRD patterns of ST-NPs.
4.2 Morphological analysis
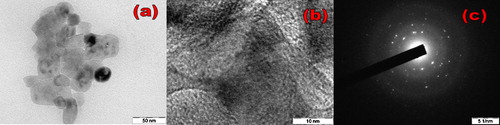
The morphology of ST-NPs was studied by using FE-SEM. (a) and (b) shows the FE-SEM images at different resolutions. It is clearly observed that particles are spherical in shape and agglomerated due to the high calcination. TEM, HR-TEM, and SAED images of ST-NPs ((a)–(c)) show that the particles obtained are in nanoregime with average particle size of ∼20 nm. These results were well matched with the result obtained by the Debye–Scherer's method. HRTEM figures clearly show that ST-NPs are highly crystalline. SAED pattern is composed of some rings which supports the polycrystalline nature of ST-NPs.
Fig. 2 FE-SEM image of ST-NPs at different resolutions.
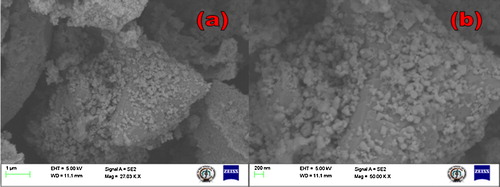
Fig. 3 (a) TEM, (b) HR-TEM, and (c) SAED patterns of ST-NPs.
4.3 FT-IR analysis
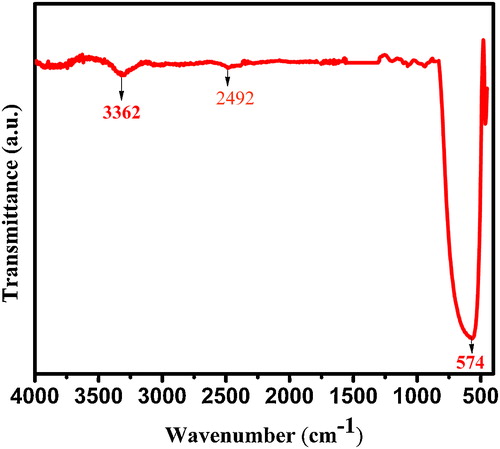
This is the analytical technique which confirms the purity of the ST-NPs. A strong band at 3362 cm−1 in attributed to the O–H stretching vibration of TiO(OH)2. A weak stretching C–H of butyl group in n-butyl titanate is seen at 2492 cm−1. A strong metal-oxygen absorption band is formed at 574 cm−1.
Fig. 4 FTIR spectrum of ST-NPs.
4.4 BET surface area
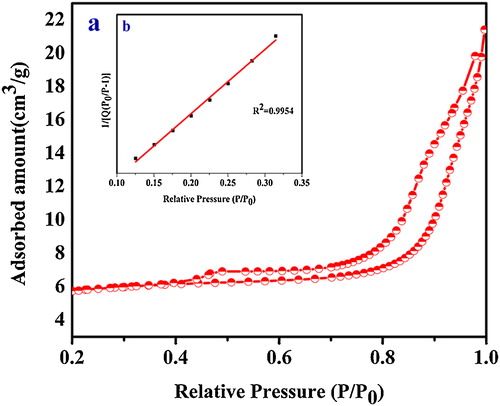
The total surface areas of the ST-NPs were obtained with reference to the Brunauer–Emmett–Teller (BET) multi-point and single-point methods [Citation35] using the N2 adsorption/desorption isotherm data. All samples were pretreated with degassing at 90 °C for 1 h followed by 105 °C overnight with ultra high purity nitrogen purge before the measurement. The pore volume data were calculated by using BJH method which is the procedure for calculating pore size distribution using the Kelvin equation and DH methods. All experimental parameters of BET surface area analysis are summarized in . (a) and (b) shows the N2 adsorption/desorption isotherms and BET surface area plot of ST-NPs.
Table 2 BET surface area values.
Fig. 5 (a) BET surface area plot and (b) nitrogen adsorption plot.
5 Adsorption studies
5.1 Batch experiments
Batch experiments were carried out at different time, dose, pH, and initial concentration of dye. 50 ml of the dye solution was mixed with different dosage of adsorbent in 250 ml beaker and stirred about 30 min in dark condition at room temperature. Then the dye solution is separated from the adsorbent by centrifugation at 1100 rpm for 5 min. The absorbance of the residual concentration of dye was measured at 618 nm (λmax) using a UV–vis spectrophotometer. The MG is chloride salt [C6H5C(C6H4N(CH3)2)2]Cl organic dye with molar mass 364.9 g/mol. The percentage removal of MG was calculated using the below equation(5)
(5) where C0 and Ce are the initial and final concentration of the dye solution. The amount of equilibrium adsorption, qe (mg/g), was calculated by the equation
(6)
(6) where C0 and Ce (mg/L) are the concentrations of dye at initial and equilibrium, respectively. V (L) is the volume of the solution and M (g) is the mass of adsorbent used.
5.2 Effect of dosage
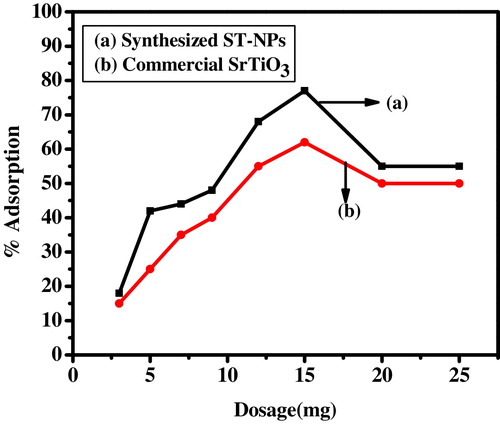
The adsorption of MG on commercial strontium titanate and synthesized ST-NPs was studied by varying the dosage for 10 mg/L of dye concentration. The percentage adsorption was studied by varying the adsorbent dosage, i.e. 3–20 mg. From the results obtained, it is observed that the synthesized ST-NPs showed maximum adsorption of 77% for the addition of 15 mg of adsorbent, whereas commercial strontium titanate shows only 62% of adsorption. From it was observed that the rate of adsorption increases and reached the maximum adsorption and finally decreased. The enhancement of the adsorption rate may be due to the increase in the availability of active sites for the adsorption of dye molecules. On further increasing the dosage, the percentage adsorption decreases, and this might be due to the fact that the transportation of dye ions to the active adsorption sites will be limited.
Fig. 6 Effect of dosage of adsorbent on adsorption of MG.
5.3 Effect of contact time
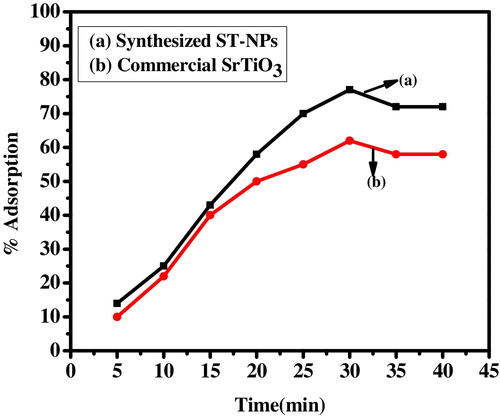
The effect of contact time on the adsorption of dye was studied by maintaining initial concentration of dye (10 ppm) at room temperature with 15 mg of commercial strontium titanate and synthesized ST-NPs at constant pH. The adsorption of the dye increased with the increase of contact time and reaches saturation at 30 min for both synthesized ST-NPs and commercial strontium titanate. Beyond the saturation level the active site does not allow further adsorption to take place. This might be due to the saturation of surface active sights on the adsorbent. From it is clearly observed that the adsorption of dye reaches equilibrium within 30 min.
Fig. 7 Effect of contact time on adsorption of MG.
5.4 Identification of isoelectric point
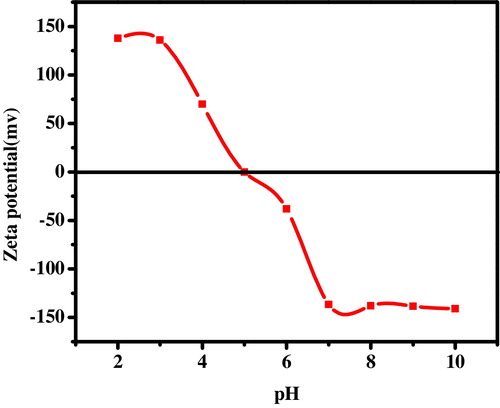
The isoelectric point is the pH of the solution at which the net surface charge on the adsorbent is zero. The magnitude of zeta-potential is also important in the adsorption process. The zeta-potential of synthesized ST-NPs was systematically studied ranging the pH from pH 2 to pH 10 using ultra sonicator. The zeta-potential value is positive in an acidic medium and negative after pH 5. A plot of zeta-potential versus pH gives the isoelectric point of the synthesized ST-NPs and is observed at pH 5 as shown in .
Fig. 8 Zeta-potential of ST-NPs.
5.5 Effect of pH
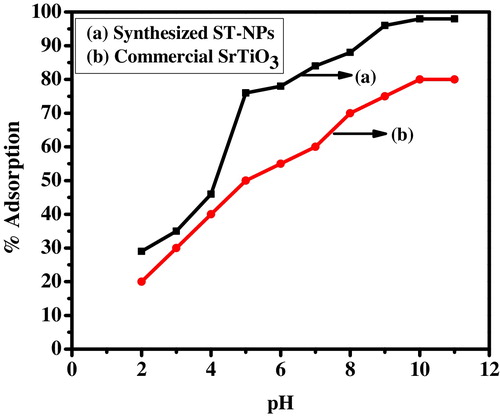
The adsorption capacity of ST-NPs and commercial strontium titanate was studied by varying pH of the dye solution from pH 2 to pH 10 by the addition of HCl and NaOH for dosage of 15 mg in 30 min of contact time. From it is found that the maximum adsorption was observed at pH 10 and minimum at pH 2. The adsorption was found to be 98% in case of synthesized ST-NPs and 80% in the case of commercial strontium titanate. The minimum adsorption at low pH is due to electrostatic repulsion between the protonated dye and positively charged adsorbent sites. At higher pH the surface of the ST-NP becomes negatively charged and attracts positively charged dye towards it which facilitates the adsorption of MG onto ST-NPs. This showed that adsorption is mainly dependent on pH of the solution. However, an increase in the solution pH beyond 10.0 reached saturation. This might be due to increase in concentration of OH− and non-availability of adsorption sites.
Fig. 9 Effect of pH on adsorption of MG.
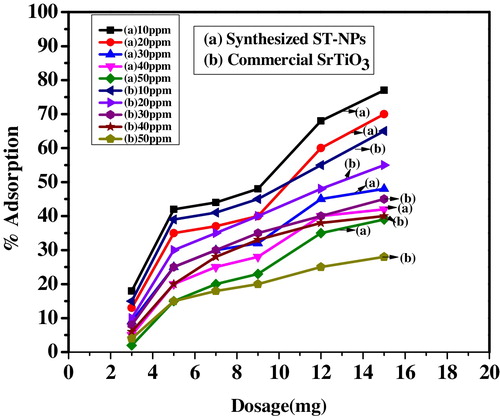
5.6 Effect of initial concentration of dye
The adsorption studies were carried out by increasing the initial dye concentration from 10 ppm to 50 ppm. The adsorption trend of MG onto adsorbent decreased on increasing dye concentration. The adsorption has decreased from 77% to 39% in case of synthesized ST-NPs and 65% to 28% in the case of commercial strontium titanate and is shown in . This is due to at lower concentration, the large surface area of the adsorbent available for the adsorption of dye ions. At higher concentration, due to saturation of active site of the adsorbent, the % of adsorption decreases.
Fig. 10 Effect of initial dye concentration of MG on adsorption.
5.7 Adsorption kinetics
The rate constant of MG on ST-NPs was studied by Langmuir–Hinshelwood model [Citation36].(7)
(7) where ‘r’ is the adsorption rate, ‘kr’ is the adsorption rate constant, ‘K’ is the absorption coefficient of the reactant, and ‘C’ is the reactant concentration. When C is very small, Eq. Equation(7)
(7)
(7) can be expressed as
(8)
(8) where ‘k’ is the first-order rate constant. Set t = 0, C = C0, then Eq. Equation(8)
(8)
(8) is reduced to
(9)
(9) shows the adsorption rate constant of ST-NPs. A graph of ln(C0/C) versus time (t) is plotted. The graph shows the linear curve with fitting constant ‘R’ being 0.997. It is observed that adsorption of MG on ST-NPs fits to first order kinetic.
Fig. 11 Adsorption kinetics – first order.

6 Adsorption isotherms
Adsorption isotherm is the study of the relation between the amounts of adsorbate adsorbed on the surface of adsorbent at constant temperature. In the present study, Langmuir and Freundlich isotherm models were used to investigate the mechanism of adsorption of MG on ST-NPs.
6.1 Langmuir isotherm
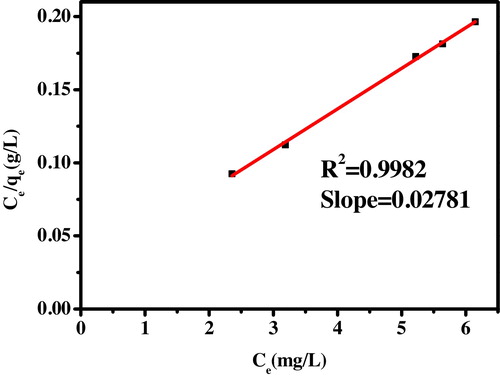
It is used to quantify the amount of adsorbate adsorbed on an adsorbent at a given temperature. This model represents that the adsorbent surface has a specific number of sites where the adsorbate molecules can be adsorbed and also involve the monolayer adsorption with no lateral interaction between the adsorbed molecules. In addition to this, model assumes uniform energies of adsorption on to the surface and no transmigration of the adsorbate. The Langmuir adsorption isotherm is used to obtain a maximum adsorption capacity produced from the complete monolayer coverage of adsorbent surface. The Langmuir equation is described in the following equation:(10)
(10) where Ce is the equilibrium concentration (mg/L), qe is the amount of dye ion adsorbed (mg/g), Q0 is the monolayer adsorption capacity (mg/g) and b is the constant related to the adsorption energy (Langmuir constant, L/mg). A plot of Ce/qe versus Ce gives a straight line which is as shown in with slope 1/Q0 which corresponds to the complete monolayer coverage (mg/g) and intercept is 1/Q0b. The Langmuir constants Q0 and b were determined from the slope and intercept of the plot and are presented in .
Table 3 Langmuir constant values of MG on ST-NPs.
Fig. 12 Langmuir adsorption isotherm.
A further analysis of the Langmuir equation can be made on the basis of a dimensionless equilibrium parameter RL also known as the separation factor, given by equation(11)
(11) where C0 is the initial concentration of the adsorbate. The value of RL lies between 0 and 1 for a favorable adsorption. While RL > 1 represents an unfavorable adsorption and RL = 1 represents the linear adsorption, the adsorption operation is irreversible if RL = 0. The value of RL in the present investigation was found to be 0.084 at 30 °C indicating that the adsorption of MB on ST-NPs is favorable.
6.2 Freundlich isotherm
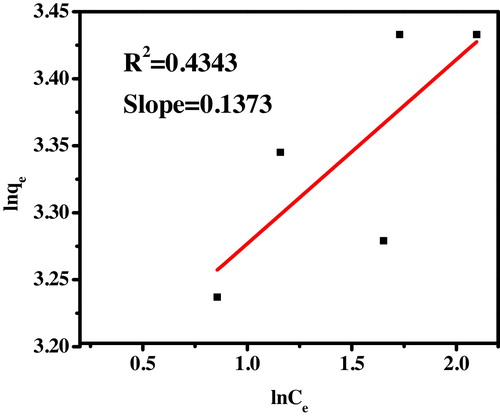
The Freundlich isotherm is valid for a heterogeneous adsorbent surface with a non-uniform distribution of heat of adsorption. It does not involve the monolayer adsorption. Freundlich equation is given as:(12)
(12) The linear form of the isotherm can be represented as:
(13)
(13) where kF is a constant indicative of the relative adsorption capacity of the adsorbent (mg/g) and the constant 1/n indicates the intensity of the adsorption. The Freundlich plot of ln qe versus ln Ce is as shown in . The constants were calculated from the slope and intercept of the graph and presented in . From the plotted isotherm R2 value is found to be 0.4343 which is not fitted well to the Freundlich isotherm.
Table 4 Freundlich isotherm values of MG on ST-NPs.
Fig. 13 Freundlich adsorption isotherm.
7 Conclusion
In this present study nano ST-NPs were synthesized by solution combustion method using urea as a fuel. The PXRD patterns showed the single phase, cubic structure and crystallite size was found to be in the range of 10–15 nm which was also consistent with TEM results. The FESEM images reveal the spherical morphology and agglomerated which was expected in combustion method due to liberation of large volume of gases. It shows that 98% of adsorption of MG dye onto the synthesized ST-NPs at pH 10 with the optimum dosage of 15 mg/L at the stirring rate of 30 min. The synthesized ST-NPs are more effective in removing MG dye from aqueous solution than the commercial strontium titanate. Adsorption kinetics results show that the adsorption of MG over ST-NPs follows first order kinetics. Isotherm studies showed that adsorption of MG onto the ST-NPs are well represented in the Langmuir isotherm.
Acknowledgements
The authors N.P. Bhagya and Dr. P.A. Prashanth thank the Principal and management of Sai Vidya Institute of Technology for their constant encouragement and their valuable help.
Notes
Peer review under responsibility of The Ceramic Society of Japan and the Korean Ceramic Society.
References
- R.RajeshkannanM.RajasimmanN.RajamohanChem. Ind. Chem. Eng.1720116779
- T.SanthiS.ManonmaniT.SmithaK.MahalakshmiRasayan J. Chem.22009813824
- K.RajasekharInt. J. Eng. Comput. Sci.3201450835087
- J.SinghG.KaurInt. J. Environ. Sci.42013250258
- M.VautierC.GuillardJ.M.HerrmannJ. Catal.20120014659
- M.N.IdrisZ.A.AhmadM.A.AhmadInt. J. Basic Appl. Sci.1120113843
- Y.C.SharmaB.SinghUmaOpen Environ. Pollut. Toxicol. J.120097478
- B.H.HameedA.T.Mohd DinA.L.AhmadJ. Hazard. Mater.1412007819825
- K.B.G.PrakashK.ShivakamyL.M.MirandaM.VelanJ. Hazard. Mater.1362006922929
- D.AdinataW.M.A.Wan DaudM.K.ArouaBioresour. Technol.982007145149
- B.H.HameedH.HakimiBiochem. Eng. J.392008338343
- Z.BekcC.O.ZveriY.SekiK.YurdakocJ. Hazard. Mater.1542008254261
- P.S.SyedShabudeenRes. J. Chem. Sci.1201188104
- S.SrivastavaR.SinhaD.RoyAquat. Toxicol.662004319329
- A.K.KushwahaN.GuptaM.C.ChattopadhyayaJ. Chem. Pharm. Res.220103445
- K.KatagiriY.MiyoshiK.InumaruJ. Colloid Interface Sci.4072013282286
- S.FuentesR.A.ZarateE.ChavezJ. Mater. Sci.45201014481452
- H.W.KangS.N.LimS.B.ParkInt. J. Hydrogen Energy37201255405549
- W.JiangW.ZhuC.JiangX.ZhangS.XuanX.GongZ.ZhangSmart Mater. Struct.202011
- C.S.LinC.C.HwangT.H.HuangG.P.WangC.H.PengMater. Sci. Eng. B13920072436
- K.TroyTownsendD.NigelE.BrowningFrank and OsterlohACS Nano6201274207426
- P.BlennowaA.HagenK.KentA.HansenL.ReineWallenbergSolid State Ionics179200820472058
- T.PuangpetchT.SreethawongS.YoshikawaS.ChavadejJ. Mol. Catal. A: Chem.28720087079
- M.MakarovaA.DejnekaJ.FrancJ.DrahokoupilL.JastrabikV.TrepakovOpt. Mater.322010803806
- M.MakarovaJ.DrahokoupilP.BykovA.DejnekaZ.Dlabaceke-J. Surf. Sci. Nanotechnol.102012406410
- P.BlennowaK.KentL.R.HansenaM.WallenbergMogensenaElectrochem. Soc.132008181194
- Y.SunJ.LiuZ.LiJ. Solid State Chem.184201119241930
- Z.ZhengB.HuangX.QinX.ZhangY.DaiJ. Colloid Interface Sci.35820116872
- N.WangD.KongH.HePowder Technol.2072011470473
- L.KarimiS.ZohooriJ. Nano Chem.3201332
- K.C.PatilS.T.ArunaT.MimaniCurr. Opin. Solid State Mater. Sci.62002507512
- R.S.RaveendraP.A.PrashanthR.Hari KrishnaN.P.BhagyaB.M.NagabhushanaH.Raja NaikaK.LingarajuH.NagabhushanaB.Daruka PrasadJ. Asian Ceram. Soc.22014357365
- P.A.PrashanthR.S.RaveendraR.HarikrishnaS.AnandaN.P.BhagyaB.M.NagabhushanaK.LingarajuH.Raja NaikaJ. Asian Ceram. Soc.32015345351
- H.P.KlugL.E.AlexanderX-ray Diffraction Procedure1954WileyNew York
- L.SunC.LaurencemChowS.A.FrukhtbeynJ.E.BonevichJ. Res. Natl. Inst. Stand. Technol.1152010
- X.WangY.LinX.DingJ.JiangJ. Alloys Compd.509201165856588