
 ?Mathematical formulae have been encoded as MathML and are displayed in this HTML version using MathJax in order to improve their display. Uncheck the box to turn MathJax off. This feature requires Javascript. Click on a formula to zoom.
Abstract
Temperature-dependent ferroelectric behavior in Ba0.85Ca0.15Ti0.9−xFexZr0.1O3 (BCT-BZT-Fe) (x = 0%, 0.5%, 1%) has been investigated. Olsen cycle is used to estimate the thermal energy conversion potential in the compositions under study. The maximum energy conversion density of 305 kJ/m3 per cycle is obtained for BCT-BZT-Fe (0.5% Fe content) when the cycle is operated between 30 and 110 °C and an electric field of 0–3 MV/m. The obtained energy density is very high for small electric field and temperature gradient as compared to other lead-free ferroelectric materials. A comparison table of previously reported Olsen cycle-based energy conversion in bulk ferroelectric ceramics is presented. Temperature also affects the hysteresis parameters, therefore, scaling relations for coercive field (Ec) and remnant polarization (Pr) as a function of temperature (T) were also observed. The power-law exponents are obtained for all hysteresis parameters in the compositions under study. The scaling relations are found as Ec ∝ T−0.658, Ec ∝ T−0.687 and Ec ∝ T−0.717 for 0%, 0.5% and 1% Fe, respectively. Similarly, Pr ∝ T−1.59, Pr ∝ T−1.65 and Pr ∝ T−1.85 are for 0%, 0.5% and 1% Fe, respectively. Additionally, back-switching polarization (Pbc) behavior as a function of temperature is estimated by well-described Arrhenius law to evaluate the average activation energy for all the compositions.
1 Introduction
Ferroelectric materials are widely used in many areas of science and technology from the last few decades [Citation1–Citation3]. It has wide applications due to its unsurpassed properties, such as hysteresis (non-volatile memory), high piezoelectric effect (actuators), strong electro-optic effect (electro-optic materials for data storage applications), high dielectric constant (capacitors), high pyroelectric coefficient (infrared detectors), high dielectric constant and anomalous temperature coefficient of resistivity [Citation2–Citation15]. Ferroelectric materials are also widely used for ambient energy conversion and scavenging waste energy [Citation16–Citation24]. In this direction, a huge number of studies report their usage for electrical energy harvesting from mechanical vibrations and temperature fluctuations [Citation19–Citation21]. Most of these ferroelectric ceramics are based on Pb(ZrxTi1−x)O3 (PZT) and Pb(Mg1/3Nb2/3)O3 (PMN) or their solid solutions [Citation1–Citation3,Citation5,Citation11,Citation25]. The main disadvantage of these ceramics is that they contain approximately 60% of lead by weight, which is highly toxic in nature and can cause several unwanted effects, such as cancer, brain damage, atmospheric issues, etc. [Citation23,Citation26–Citation28]. Lead-free ferroelectric materials are currently subject to extensive research activities owing to environmental concerns and corresponding legislation, which point to substitute lead-based ferroelectric material [Citation23,Citation26–Citation28].
In this direction, BaTiO3, Bi0.5Na0.5TiO3 and K0.5Na0.5NbO3-based ferroelectric materials have been extensively studied [Citation23,Citation26–Citation28]. These compositions are fabricated near morphotropic phase boundary (MPB); thus, the system can exhibit high piezoelectric, pyroelectric and ferroelectric properties [Citation29]. However, these materials show saturation at higher electric field. Recently, Ba0.85Ca0.15Ti0.9Zr0.1O3 (BCT-BZT) ceramic is reported for large piezoelectric and pyroelectric properties as compared to other lead-free and lead-based materials at lower electric field. It exhibits optimal properties of d33 = 650 pC/N, d31 = 74 pC/N, kp = 0.53, kt = 0.38, k31 = 0.309, , ɛr = 4500 and Pr = 11.69 μC/cm2 [Citation30]. Further, BCT-BZT also shows electric field tunable dielectric properties; the tenability is 82% under DC field of 40 kV/cm [Citation31,Citation32]. Moreover, it has low dielectric loss of 0.001, which is very small as compared to other ferroelectric materials [Citation32]. Furthermore, it consists of high pyroelectric coefficient of 5.84 × 10⁻⁸ C/(cm2 K) at room temperature, which is larger than those reported for other BaTiO3-based materials [Citation33]. These enhanced piezoelectric, pyroelectric and ferroelectric properties are achieved due to the existence of MPB near room temperature of ferroelectric rhombohedral and tetragonal phases [Citation32,Citation34,Citation35]. A detailed analysis of elastic, dielectric, and piezoelectric constants in BCT-BZT ceramic is performed by a resonance method and measured the temperature dependence of electrical properties [Citation36]. BCT-BZT has also received attention in energy conversion and refrigeration (electrocaloric) because it shows low electric field saturation. A large EC requires a large ΔS and ΔT change with applied electric field (ΔE). However, requirements for generation of high voltage are bulky, costly and tend to be unsafe. Hence, it is preferred that cooling devices should be operated at low voltage. Therefore, an EC material with a large EC induced under small electric fields is also an important parameter. EC responsivity is quantifiable, which can be defined as ΔT/ΔE and serves as a good figure of merit as reported by number of researchers [Citation37–Citation40]. Hence, for practical designs, development of dielectric materials, capable of generating giant EC at relatively low applied electric field change ΔE, is required [Citation39,Citation40]. Further, Olsen cycle-based energy conversion capabilities in BCT-BZT are reported, which is comparable with other lead-based materials [Citation41]. This energy conversion also requires small electric field. Therefore, it can be a potential material for energy conversion.
Recent investigation reveals that BCT-BZT is one of the most studied lead-free piezoelectric ceramics having high dielectric and ferroelectric properties. Therefore, the present work deals with the energy conversion capability of Ba0.85Ca0.15Ti0.9−xFexZr0.1O3 (BCT-BZT-Fe) bulk ferroelectric ceramics through Olsen cycle. In order to understand ferroelectric properties, hysteresis scaling relations of coercive field (Ec) and remnant polarization (Pr) as a function of temperature (T) are systematically investigated. Additionally, back-switching polarization (Pbc) behavior as a function of temperature is estimated by well-described Arrhenius law to evaluate the average activation energy for all the compositions.
2 Experimental method
In the present work, Ba0.85Ca0.15Ti0.9−xFexZr0.1O3 (BCT-BZT-Fe) was synthesized by the solid-state reaction route. The ceramics samples were fabricated by differing the iron (Fe) (x = 0%, 0.5%, 1%, 1.5%) content. The starting raw powders barium carbonate (BaCO3), calcium oxide (CaO), titanium oxide (TiO2), zirconium oxide (ZrO2) and iron (Fe) were mixed in stoichiometric ratio and milled in acetone to obtain physical homogeneity using mortar and pestle. The mixtures were calcined twice at 1325 °C and 1350 °C for 6 h with intermediate grinding. In the calcined powder, PVA (2% by weight) was mixed to improve the green strength of the compacts. Green samples of 12 mm (diameter) × 1 mm (thickness) were prepared using cold hydraulic press. Finally, all the samples were sintered at 1400 °C for 4 h. The crystal structure was confirmed using powder X-ray diffraction (XRD) technique employing Cu-Kα radiations. Density of the sintered pellets was measured by Archimedes principle. To confirm the topology of the sintered specimen, scanning electron microscope (SEM) was used. For making specimen electrical conducting, silver paste was electrodes on both the sides of the given specimen. Polarization–electric field (P–E) hysteresis loops were measured at different temperature by using P-E loop tracer.
3 Results and discussion
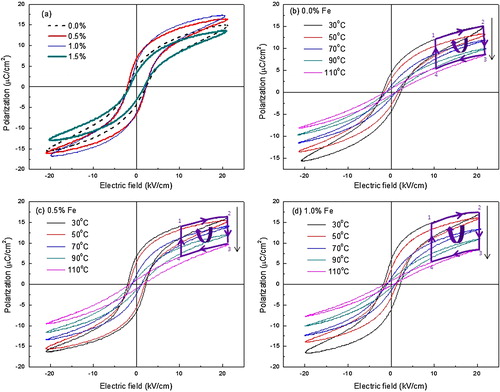
The XRD patterns of sintered samples for BCT-BZT-Fe ceramics are shown in (a). All the XRD peaks are indexed, which indicate the existence of both rhombohedral and tetragonal structures. The square mark indicates peaks split (200), which can be reflections of the coexistence of rhombohedral and tetragonal phases. Similarly, other researchers also reported coexisting of rhombohedral (R3m) and tetragonal (P4mm) phases in BCT-BZT ceramics [Citation42–Citation45]. It shows that the addition of Fe does not affect crystal structure. Further, (b)–(d) presented SEM micrographs of all the compositions under study. It indicates good density of all samples due to closely packed grains (lack of porosity), which is also confirmed by the Archimedes principle and found to be ∼93% of the theoretical density. P–E hysteresis loops of BCT-BZT-Fe for the compositions (0%, 0.5%, 1%, 1.5%) under study are represented in . (a) shows a comparison of P–E loop for all compositions, with a fixed electric field and temperature. It can be said that as the Fe content increases, polarization also increases up to 1%. However, P–E loop parameters are decreased with addition of 1.5% Fe content in BCT-BZT. It is well known that typical aliovalent dopants in PZT are Nb5+ and Fe3+ acting as donor and acceptor, which significantly alter the domain stability [Citation1]. Similarly, Humburg et al. discussed that Fe3+ doping in (Ba0.865Ca0.135)(Zr0.11Ti0.89) enhances the defect dipole model; this can be attributed to aging due to the formation of charged defect complexes in the material [Citation46]. It is very sensitive to the Zr/Ti ratio and is only observed in compositions fabricated close to their MPB [Citation46,Citation47]. Incorporation of Fe3+ ion as a b-site dopant disrupts the phase formation. It can be said that the Fe addition (up to 1%) enhanced ferroelectric properties. Moreover, addition of more than 1% Fe decreases ferroelectric properties, which can be attributed to losses in material due to difference in Fe3+ and Ti4+ atomic radius. Furthermore, this phenomenon is attributed to the influence of local compositional fluctuations and random charge introduced by the dopants that locally reduce the tetragonal symmetry and the ferroelectric state [Citation46]. However, at this point, a complete explanation for this effect is not available. Notwithstanding, the optimum Fe doping concentration is revealed to be 1%. Therefore, the present work deals with only three compositions of x = 0%, x = 0.5% and x = 1.0%. Furthermore, (b)–(d) shows the hysteresis loops for x = 0%, x = 0.5% and x = 1.0% Fe, respectively at different temperatures under constant electric field of 20 kV/cm. All these hysteresis loops are measured at a constant frequency of 50 Hz. Frequency can also affect the P–E loop parameters; however, the present work does not deal with such effect. Further, at a given temperature, if the applied electric field is small, it shows unsaturated minor loop. However, as the electric field increases, minor loop (unsaturated loop) starts converting into major loop (saturated loop) due to increase in coercive field (Ec), saturation polarization (Ps) and remnant polarization (Pr). On the other hand, Ec, Ps and Pr decrease with increase in temperature as shown in (b)–(d). Moreover, ferroelectric materials are a subclass of pyroelectric materials [Citation24]. Therefore, it produces electric current/voltage due to temporal temperature gradient; this can be used as a means of energy conversion [Citation24]. From , it is clear that there is huge possibility of pyroelectric energy conversion in these materials. Hence, we have to put light on the energy conversion capability of the material through Olsen cycle.
Fig. 1 (a) X-ray diffraction pattern for sintered Ba0.85Ca0.15Ti0.9−xFexZr0.1O3 (BCT-BZT-xFe) sample. Scanning electron microscopy image of (b) x = 0%, (c) x = 0.5% and (d) x = 1% Fe.
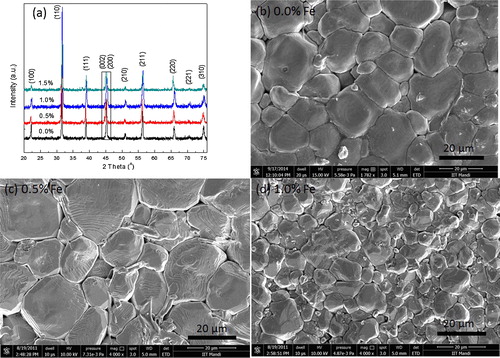
Fig. 2 (a) Polarization versus electric field (P–E) hysteresis loops for BCT-BZT-xFe bulk ceramic for all the compositions under study. P–E loop under different temperature and fixed magnitude of electric field for (b) 0%, (c) 0.5% and (d) 1% Fe content.
Ferroelectric materials show hysteresis behavior on polarization versus electric field graph (P–E). The hysteresis represents the difference in the energy required to polarize and depolarize the ferroelectric material in the form of heat. The material becomes capable to absorb the heat and generate electricity. It is reported that the reversible polarization can be made to trace a clockwise loop between two different temperatures. This cycle is known as Olsen cycle, which basically is used to convert thermal energy into electricity. This cycle mainly consists of two isothermal and two isoelectric field processes [Citation17,Citation18,Citation48–Citation50]. The schematic of the Olsen cycle for energy conversion is shown in . The processes 1′-2-3-4-1′ represent the electric analog of the Olsen cycle, whereas corresponding enclosed area shows the electric energy produced per unit volume per cycle [Citation23]. The area enclosed (1-2-1′-1) represents the hysteresis loss when Olsen cycle is operated in bipolar P–E loop [Citation17,Citation18,Citation38–Citation40]. However, in the unipolar P–E loop, hysteresis loss is very small. Therefore, for unipolar condition hysteresis loss can be neglected and the improved energy conversion is represented by the shifted loop (1-2-3-4-1), which is considered in the present work. Process 1-2 is performed at a constant lower temperature (TL) as electric field increases from lower limit (EL) to higher limit (EH) and correspondingly material polarization also increases. In process 2-3, heat (QS) is supplied to the material, which increases the temperature and produces lattice vibration. Hence, material depolarizes at constant electrical field EH. This generates a large depolarization current, which can be used or stored for powering electronic equipment using suitable circuit. Further, temperature of the material increases from lower temperature (TL) to higher temperature (TH). In the process 3-4, the electric field reduces from EH to EL at constant temperature TH. The polarization also decreases due to lack of electric field, which generates a weak depolarization current. Finally, in process 4-1, extraction of heat from the system at constant electric field (EL) is done so that the material reaches to its initial state and completes the cycle. A detailed discussion on Olsen cycle is available in a number of articles [Citation16–Citation18,Citation22,Citation23,Citation49–Citation51]. This process is known as isoelectric heat rejection. Energy density (ND) per unit volume of the material can be estimated by [Citation19,Citation23]:(1)
(1) where E and P represent the electric field and polarization, respectively. Eq. Equation(1)
(1)
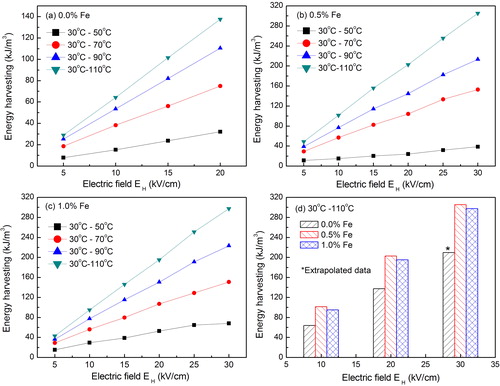
(1) represents the surface integral of E with respect to change in polarization. This cycle was employed on the BCT-BZT-Fe compositions and results are shown in . In this work, EL and TL are considered as zero electric field and 30 °C, respectively. (a) presents Olsen cycle-based energy conversion in BCT-BZT as a function of applied higher electric field (EH) at various higher temperatures (TH). It indicates that as the temperature and electric field span are increased, energy also increases. The maximum energy, 80 kJ/m3, is observed when the cycle is operated between 30–110 °C and 0–21.5 kV/cm. Similarly, (b) and (c) shows energy conversion for BCT-BZT-Fe having 0.5% and 1% Fe content, respectively. It has also similar behavior as observed in BCT-BZT. Further, it is interesting to note that the slope of energy conversion differs from each other in the compositions under study. This is due to fact that the addition of the Fe can lower the ferroelectric-paraelectric transition. Fe3+ plays the role of a B-site acceptor dopant in BCZTO-Fe. Fe doping has been reported to reduce remnant polarization, coercive field value and ferro-para transition temperature [Citation46]. However, an increase in the maximum polarization has been achieved as compared to undoped ceramics. Hence, addition of the Fe in BCT-BZT can increase energy conversion, which is also clear from the comparison graph as shown in (d). The maximum energy conversion in 0.5% Fe content ceramics is 305 kJ/m3 when the cycle is operated between 30–110 °C and 0–30 kV/cm. In (d) at 30 kV/cm, energy conversion is predicted for the BCT-BZT composition. The maximum energy conversion density of the Pb[(MnxNb1−x)1/2(MnxSb1−x)1/2]y(ZrzTi1−z)1−yO3 (PMN–PMS–PZT) based on pyroelectric effect was found as 69 kJ/cm3 per cycle [Citation52]. However, we found that BCT-BZT has almost five times larger energy conversion potential than PMN–PMS–PZT. Here, it is important to note that PMN–PMS–PZT has actual energy output; however, our estimation is based on only material energy conversion potential. A comparison of Olsen cycle-based energy conversion potential in bulk ferroelectric materials has been given in . Further, a number of researches has applied Olsen cycle on ferroelectric thin film and shown huge amount of energy conversion [Citation24,Citation48,Citation50,Citation53]. However, thin film contains very small volume; hence, for practical purpose, it cannot fulfill the energy requirements. Therefore, we have considered only bulk ferroelectric for comparison. From , it can be said that the present work has small energy conversion potential as compared to others. However, according to temperature difference ΔT (TH − TL), it indicates that the present work is in the second position after PMN-10PT. It is important to note that we have not considered ΔT of bold materials () because they have very high value of 100 °C < TL. Similarly, according to applied electric field ΔE (EH − EL), it indicates that the present work is in the third position. In the same fashion, we have not considered bold materials () because they have very high value of 5 MV/m < ΔE. Further, Vats et al. [Citation41] have reported 87 kJ/m3 as given in considering lower electric field-based large energy conversion potential in BCT-BZT. However, the present work reported 25% improvement in previously reported energy conversion due to addition of 0.5% Fe in same compositions. In summary, it can be said that for small electric field and temperature change, BCT-BZT-Fe is fairly a good candidate for thermal energy conversion.
Table 1 Comparison of energy density for various bulk ferroelectric materials.
Fig. 3 Schematic of the electrical energy conversion using Olsen cycle.
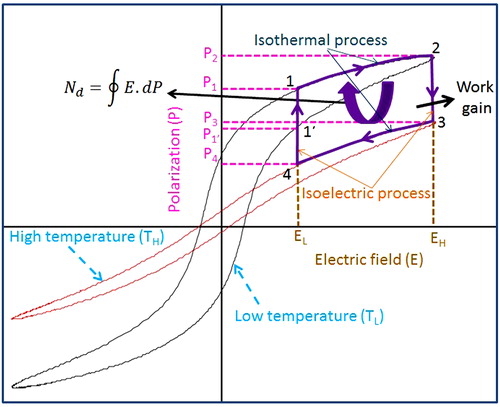
Fig. 4 Energy conversion versus electric field plots of Ba0.85Ca0.15Ti0.9−xFexZr0.1O3 (BCT-BZT-Fe) bulk ceramics for (a) x = 0%, (b) x = 0.5%, (c) x = 1% Fe content at EL = 0 kV/cm and (d) comparison of energy conversion capacity in compositions under study.
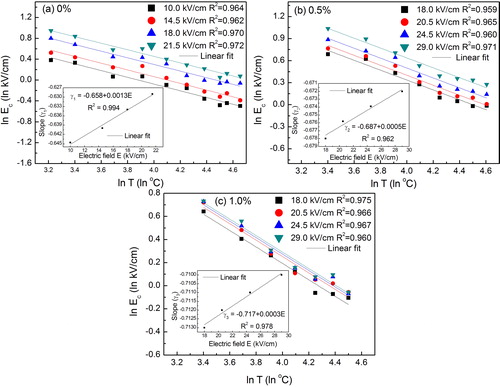
In order to further study the temperature effect on the hysteresis loop parameters, we have studied the scaling behavior of hysteresis parameter. Therefore, we have plotted logarithmic form of Ec and Pr versus T under different values of electric fields, as presented in and . (a)–(c) shows ln Ec versus ln T for all the compositions under study. The linear least square-fitting methods (with R2 ∼ 0.96–0.98) were used to explain the dependence of ln Ec on ln T. The scaling relation between Ec and T can be determined from the slope of ln Ec versus ln T. Further, effect of electric field (E) on the slope of ln Ec versus ln T are also plotted in the inset of the corresponding figures. Hence dependence of Ec on T can be written as:(2)
(2) where γ is the slope and
is Y-intercept. For BCT-BZT compositions, it can be written as,
(3)
(3) where γ1 = 0.0013E − 0.658. Here, Y-intercept
plays a role only at zero temperature. In the above equation,
can be determined when temperature approaches to zero, and its estimated value can be different from practical values. However, at the zero temperature, ferroelectric domains are freezed; hence, the ferroelectric properties dramatically vary and are entirely different for the domains at high temperature [Citation25,Citation57,Citation28,Citation58]. Therefore, we can safely neglect the effect of Y-intercept because we are not dealing with the effect on Ec at T = 0 °C. This assumption is used in the present work. Hence, Eq. Equation(3)
(3)
(3) can be written as:
(4)
(4) Further, it can be said that Ec versus T relation moderately depend on E. For the constant electric field (E), effect of E is very small, as the magnitude of E is small. This assumption is also used in the present work. Therefore, effect of E can be also ignored and Eq. Equation(4)
(4)
(4) can be rewritten as:
(5)
(5) The scaling relation between Ec and T can be written as, Ec ∝ Tγ1 or Ec ∝ T−0.658, where γ1 = 0.658 is a dimensionless number. In the same fashion, scaling relations between Ec and T have been established for BCT-BZT-Fe x = 0.5% and x = 1.0% as shown in (b) and (c), respectively. The scaling relation between Ec and T can be written as Ec ∝ Tγ2 and Ec ∝ Tγ3 for x = 0.5% and x = 1.0% Fe content, respectively. Scaling relations for x = 0.5% and x = 1.0% Fe content are found as Ec ∝ T−0.687 and Ec ∝ T−0.717.
Fig. 5 Logarithmic plot of coercive field (Ec) versus temperature (T) under different magnitude of electric field for (a) 0%, (b) 0.5% and (c) 1% Fe content. Inset indicates corresponding slope versus electric field.
Further, we have neglected the effect of applied electric field on the scaling relations. However, the slight difference in the scaling exponent can be observed due to the difference in switching behavior at constant electric field [Citation25,Citation57,Citation28,Citation58]. The scaling relation can be also estimated on the domain switching behavior as a function of E and T as reported [Citation25,Citation57,Citation59,Citation60]. In ferroelectric material, domain is a region where all the dipoles are aligned in the same direction and the direction of the dipoles depends on temperature, electric field and crystallographic structure [Citation25,Citation57,Citation59,Citation60]. The phenomena of the rotation of dipoles are known as ferroelectric domain switching. Due to these domain switching, there is a change in the shape of the unit cell, but the volume remains the same [Citation25,Citation57,Citation59,Citation60]. The whole process takes place in two steps; firstly, domain growth and secondly, rotation of domains. When the external field is less than Ec, domains growth will take place. Secondly, when electric field is greater than Ec, the rotation of domains will take place in the direction of electric field. During this process, hysteresis loop goes on increasing. When the electric field goes above the threshold value, it is unable to produce increment in polarization, which is known as saturation [Citation25,Citation57,Citation28,Citation58–Citation60]. Any further increase in the electric field leads to its dielectric breakdown. Therefore, to avoid the effect of electric field, we have considered saturated P–E loop only.
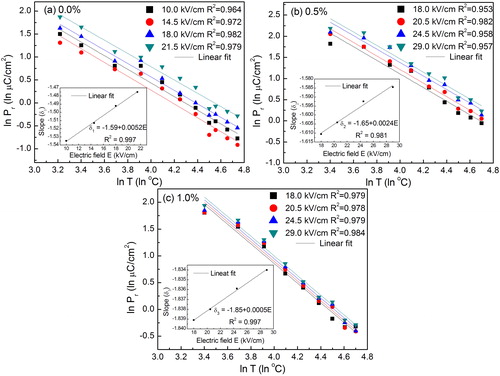
In order to further investigate similar scaling relation for Pr versus T represented in at different magnitude of electric field, (a) shows ln Pr versus ln T graph for BCT-BZT at four different electric fields. Therefore, Ec dependence on T can be written as:(6)
(6) where δ1 is the slope and Ypr is Y-intercept. Further, it can be written as
(7)
(7) Similar assumptions are considered and Eq. Equation(7)
(7)
(7) can be written as:
(8)
(8) In the similar fashion, scaling relations between Pr and T have been established for BCT-BZT-Fe x = 0.5% and x = 1.0%, as shown in (b) and (c), respectively. The scaling relation between Pr and T can be written as Pr ∝ Tδ2 or Pr ∝ T−1.65 and Pr ∝ Tδ2 or Pr ∝ T−1.85 for x = 0.5% and x = 1.0% Fe content, respectively. The sharp change in the Pr shows the phase transition in BCT-BZT and shows the diffused ferroelectric-paraelectric phase transition at temperature 80 °C [Citation29,Citation31]. Similar systematic shift in Pr can also be observed by addition of Fe content. Additionally, scaling relation of Ec, Pr versus T for previously reported bulk ferroelectric ceramics are given in . It indicates that the lead-free ferroelectric has not been given much attention for analysis of the scaling behavior. Therefore, this study can provide a significant contribution in this direction to understand the hysteresis behaviors of BCT-BZT based lead-free composition.
Table 2 Dynamic scaling exponents for different bulk ferroelectric ceramics.
Fig. 6 Logarithmic plot of remnant polarization (Pr) versus temperature (T) at various electric fields for (a) 0%, (b) 0.5% and (c) 1% Fe compositions. Inset indicates corresponding slope versus electric field.
Temperature also affects the domain wall motion; this is due to the fact that as the temperature increases, lattice vibration increases, which enhance the rotation of the domains and reduce the stability of the polarization [Citation25,Citation57,Citation58,Citation60]. Therefore, hysteresis loop area also decreases with increase in the temperature. The temperature dependence on the polarization can be explained in terms of back-switching. Generally, domain polarization takes place in two steps; firstly, switchable polarization in domain, which is known as Ps, and another is back-switched polarization, known as Pr [Citation61,Citation62]. When the external electric field is applied, polarization reaches to Ps, whereas when electric field is removed, it again comes to stable polarization Pr. Such phenomenon is known as back-switching polarization. Back-switching polarization (Pbc) can be calculated as [Citation28,Citation61,Citation62]:(9)
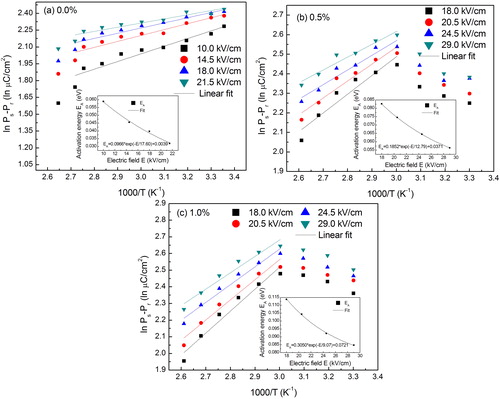
(9) shows the back-switching polarization versus temperature plots at various electric fields. (a) shows that as the temperature increases, the back-switching polarization increases; but after 355 K, it starts to decrease with temperature. It shows that the Ps have more dependence on the T as compared to Pr. Similar behavior is obtained in (b) and (c) for BCT-BZT 0.5% and 1% Fe composition, respectively. From (b) and (c), it can be seen that Pbc data have been varied above 345 K and 335 K, which indicates that there must be a phase transition. It is also evident that the addition of Fe can decrease phase transition from 355 K to 335 K. Therfore, it can be said that addition of Fe can reduce the ferroelectric-paraelectric transition by approximately 20 K. In the high-field ranges, the relationship between Ps − Pr and T obeys the Arrhenius law [Citation28,Citation61,Citation62]:
(10)
(10) where EA is the average activation energy of trapped charge defect such as oxygen vacancy, and P0 is a constant. The slope of ln(Ps − Pr) versus 1/T can be used to estimate the activation energy of the domain switching. Therefore, ln(Ps − Pr) versus 1000/T are plotted in (a)–(c) for all the compositions under study. It is important to note that the slope of ln(Ps − Pr) versus 1000/T is positive; therefore, the activation energy is negative. However, energy cannot be negative; therefore, we considered it positive. Further, field dependence of the activation energy for the BCT-BZT-Fe fits well to a simple exponential decay function, and activation energy dependence versus electric field plots are shown in insets of corresponding figure ((a)–(c)).
(11)
(11) Eq. Equation(11)
(11)
(11) represents the composition having 0% of Fe. Similar calculation is performed for the other compositions, and relations are found as EA = 0.0229 × exp((−E)/9.978) + 0.043 and EA = 0.3009 × exp((−E)/9.067) + 0.0711 for 0.5% and 1.0% Fe content, respectively. Activation energy decreases with increase in electric field, as shown in insets of . It has been suggested that the lower value of the activation energy obtained at low temperatures is associated mainly with the creation of a large number of space charge carriers in oxidation–reduction processes [Citation61,Citation62]. This work can help to understand the temperature-dependent dynamic hysteresis phenomenon in lead-free ferroelectrics.
Fig. 7 Plots for back-switching polarization (Ps − Pr) versus temperature (T) at various electric fields for (a) 0%, (b) 0.5% and (c) 1% Fe compositions.
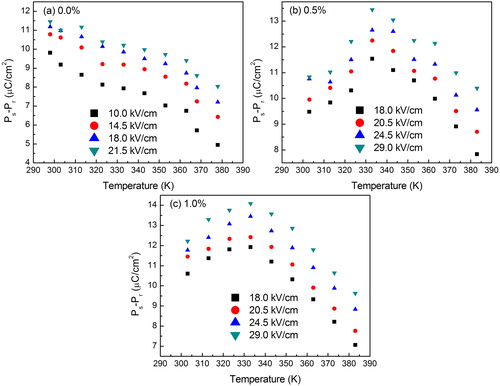
Fig. 8 ln(Ps − Pr) versus 1/T plots under different magnitude of electric fields for (a) 0%, (b) 0.5% and (c) 1% Fe. Correspondingly, inset indicates average activation energy EA versus applied electric field E.
4 Conclusions
In the present work, Ba0.85Ca0.15Ti0.9−xFexZr0.1O3 (BCT-BZT-Fe) (x = 0%, 0.5%, 1%) are studied. It is found that Fe doping is a significantly lower ferroelectric-paraelectric phase transition temperature close to room temperature. Temperature-dependence hysteresis characteristics of BCT-BZT-Fe bulk ceramics were also studied. Olsen cycle is applied to investigate thermal energy conversion capability of BCT-BZT-Fe ceramics. Maximum energy densities of 210 kJ/m3, 305 kJ/m3 and 298 kJ/m3 per cycle for BCT-BZT-Fe containing 0%, 0.5% and 1% Fe, respectively under operating condition of 30–100 °C and an electric field 0–3 MV/m were observed. The estimated energy density is comparatively high from most of the bulk ferroelectric ceramics when cycle operated at lower electric field and temperature. Results indicate that BCT-BZT-Fe ceramics can be successfully used for scavenging of waste thermal energy. Additionally, the ferroelectric scaling relations for coercive field (Ec), remnant polarization (Pr), and as a function of temperature (T) are also estimated. The power-law exponents are obtained for all hysteresis parameter and it was in the form of Ec ∝ T−0.658, Ec ∝ T−0.687 and Ec ∝ T−0.717 for 0%, 0.5% and 1% Fe, respectively. Similarly, Pr ∝ T−1.59, Pr ∝ T−1.65 and Pr ∝ T−1.85 were for 0%, 0.5% and 1% Fe, respectively. The temperature-dependence back-switching kinetics are also estimated and the relation follows the Arrhenius law. These results can help to understand the hysteresis characteristics of BCT-BZT-Fe with respect to temperature under external electric field.
Acknowledgments
One of the authors (Rahul Vaish) acknowledges support from the Indian National Science Academy (INSA), New Delhi, India, through a grant by the Department of Science and Technology (DST), New Delhi (YSS/2014/000925), under INSPIRE faculty award-2011 (ENG-01) and INSA Young Scientists Medal-2013.
Notes
Peer review under responsibility of The Ceramic Society of Japan and the Korean Ceramic Society.
References
- G.H.HaertlingJ. Am. Ceram. Soc.821999797818
- N.SetterR.WaserActa Mater.482000151178
- G.RijndersD.H.BlankNature4332005369370
- G.ArltFerroelectrics761987451458
- S.ChoiT.R.ShroutS.JangA.BhallaMater. Lett.81989253255
- H.TabataT.KawaiAppl. Phys. Lett.701997321323
- Q.ZhangJ.ZhaoK.UchinoJ.ZhengJ. Mater. Res.121997226234
- C.CanedyH.LiS.AlpayL.Salamanca-RibaA.RoytburdR.RameshAppl. Phys. Lett.77200016951697
- D.ViehlandL.EwartJ.PowersJ.LiJ. Appl. Phys.90200124792483
- J.ZhangZ.YinM.-S.ZhangJ.F.ScottSolid State Commun.1182001241246
- X.-G.TangH.L.-W.ChanJ. Appl. Phys.972005034109
- T.R.ShroutS.J.ZhangJ. Electroceram.192007113126
- S.ZhangR.XiaT.R.ShroutG.ZangJ.WangSolid State Commun.1412007675679
- Z.WuH.LiuM.CaoZ.ShenZ.YaoH.HaoD.LuoJ. Ceram. Soc. Jpn.1162008345349
- W.GeH.LiuX.ZhaoB.FangX.LiF.WangD.ZhouP.YuX.PanD.LinJ. Phys. D: Appl. Phys.412008115403
- R.OlsenD.BrunoJ.BriscoeJ.DulleaFerroelectrics591984205219
- R.B.OlsenD.A.BrunoJ.M.BriscoeJ. Appl. Phys.58198547094716
- R.OlsenD.BrunoPyroelectric conversion materialsIECEC’86; Proceedings of the Twenty-first Intersociety Energy Conversion Engineering Conference19868993
- S.PatelA.ChauhanR.VaishMater. Res. Express12014025504
- S.PatelA.ChauhanR.VaishJ. Appl. Phys.1152014084908
- S.PatelA.ChauhanR.VaishEnergy Technol.22014480485
- C.BowenJ.TaylorE.LeBoulbarD.ZabekA.ChauhanR.VaishEnergy Environ. Sci.7201438363856
- A.ChauhanS.PatelG.VatsR.VaishEnergy Technol.22014205209
- G.VatsR.VaishC.R.BowenJ. Appl. Phys.1152014013505
- R.YimnirunA.NgamjarurojanaR.WongmaneerungS.WongsaenmaiS.AnantaY.LaosiritawornAppl. Phys. A892007737741
- A.ChauhanS.PatelR.VaishAIP Adv.42014087106
- S.PatelA.ChauhanR.VaishEnergy Technol.320157076
- S.PatelA.ChauhanA.ChauhanR.VaishMater. Res. Express22015035501
- H.BaoC.ZhouD.XueJ.GaoX.RenJ. Phys. D: Appl. Phys.432010465401
- P.WangY.LiY.LuJ. Eur. Ceram. Soc.31201120052012
- V.Sreenivas PuliD.K.PradhanW.PérezR.S.KatiyarJ. Phys. Chem. Solids742013466475
- E.V.RamanaA.MahajanM.GraçaS.MendirattaJ.MonteiroM.ValenteMater. Res. Bull.48201343954401
- S.YaoW.RenH.JiX.WuP.ShiD.XueX.RenZ.-G.YeJ. Phys. D: Appl. Phys.452012195301
- I.CoondooN.PanwarH.AmorinM.AlgueroA.KholkinJ. Appl. Phys.1132013214107
- A.B.HaugenJ.S.ForresterD.DamjanovicB.LiK.J.BowmanJ.L.JonesJ. Appl. Phys.1132013014103
- D.XueY.ZhouH.BaoC.ZhouJ.GaoX.RenJ. Appl. Phys.1092011054110
- H.KaddoussiA.LahmarY.GagouJ.L.DellisH.KhemakhemM.E.MarssiCeram. Int.4120151510315110
- X.MoyaE.Stern-TaulatsS.CrossleyD.González-AlonsoS.Kar-NarayanA.PlanesL.MañosaN.D.MathurAdv. Mater.25201313601365
- X.S.QianH.J.YeY.T.ZhangH.GuX.LiC.RandallQ.ZhangAdv. Funct. Mater.24201413001305
- G.ZhangX.ZhangT.YangQ.LiL.-Q.ChenS.JiangQ.WangACS Nano9201571647174
- G.VatsA.ChauhanR.VaishInt. J. Appl. Ceram. Technol.122014E49E54
- W.LiuX.RenPhys. Rev. Lett.1032009257602
- B.LiJ.E.BlendellK.J.BowmanJ. Am. Ceram. Soc.94201131923194
- M.C.EhmkeS.N.EhrlichJ.E.BlendellK.J.BowmanJ. Appl. Phys.1112012124110
- J.P.PraveenK.KumarA.JamesT.KarthikS.AsthanaD.DasCurr. Appl. Phys.142014396402
- H.I.HumburgM.AcostaW.JoK.G.WebberJ.RödelJ. Eur. Ceram. Soc.35201512091217
- S.PatelA.ChauhanR.VaishAppl. Mater. Today120153744
- N.AshconP.LaurentSmart Mater. Struct.202011025012
- I.M.McKinleyR.KandilianL.PilonSmart Mater. Struct.212012035015
- F.Y.LeeS.GoljahiI.M.McKinleyC.S.LynchL.PilonSmart Mater. Struct.212012025021
- S.AlpayJ.ManteseS.Trolier-McKinstryQ.ZhangR.W.WhatmoreMRS Bull.39201410991111
- T.YuG.ZhangY.YuY.ZengS.JiangSens. Actuators A: Phys.2232015159166
- R.SaoG.VatsR.VaishFerroelectrics474201517
- R.KandilianA.NavidL.PilonSmart Mater. Struct.202011055020
- G.SebaldS.PruvostD.GuyomarSmart Mater. Struct.172008015012
- A.KhodayariS.PruvostG.SebaldD.GuyomarS.MohammadiIEEE Trans. Ultrason. Ferroelect. Freq. Control562009693699
- R.YimnirunR.WongmaneerungS.WongsaenmaiA.NgamjarurojanaS.AnantaY.LaosiritawornAppl. Phys. Lett.902007112906112913
- S.PatelA.ChauhanR.VaishInt. J. Appl. Ceram. Technol.122015899907
- R.YimnirunS.WongsaenmaiR.WongmaneerungN.WongdamnernA.NgamjarurojanaS.AnantaY.LaosiritawornPhys. Scr.20072007184
- X.ChenX.DongH.ZhangN.FengH.NieF.CaoG.WangY.GuH.HeJ. Appl. Phys.1052009096104
- B.WenY.ZhangX.LiuL.MaX.WangJ. Mater. Sci.47201242994304
- Y.ZhangX.ZhongZ.ChenJ.WangY.ZhouJ. Appl. Phys.1102011014102