
 ?Mathematical formulae have been encoded as MathML and are displayed in this HTML version using MathJax in order to improve their display. Uncheck the box to turn MathJax off. This feature requires Javascript. Click on a formula to zoom.
Abstract
Chalcogenide glassy alloys of Se90Cd10−xInx (x = 2, 4, 6, 8) are synthesized by melt quench technique. The prepared glassy alloys have been characterized by techniques such as differential scanning calorimetry (DSC), scanning electron microscopy (SEM) and energy dispersive X-ray (EDAX). Dielectric properties of Se90Cd10−xInx (x = 2, 4, 6, 8) chalcogenide glassy system have been studied using impedance spectroscopic technique in the frequency range 42 Hz to 5 MHz at room temperature. It is found that the dielectric constants ɛ′, dielectric loss factor ɛ″ and loss angle Tan δ depend on frequency. ɛ′, ɛ″ and loss angle Tan δ are found to be decreasing with the In content in Se90Cd10−xInx glassy system. AC conductivity of the prepared sample has also been studied. It is found that AC conductivity increases with frequency where as it has decreasing trend with increasing In content in Se–Cd matrix. The semicircles observed in the Cole–Cole plots indicate a single relaxation process.
1 Introduction
Chalcogenide glasses have attracted much attention due to their potential applications in optoelectronic devices, solar cell, memory switching, infrared photo detectors and bio-sensors [Citation1–Citation5]. A variety of applications including phase change memory, photo receivers, and change of electrical resistance have been reported using these glasses [Citation6–Citation8]. Such dielectric materials have been widely employed in various industrial devices such as dynamic access memory microwave filter, voltage controlled oscillator and telecommunication technologies [Citation9]. Among VI–II–III group ternary compound selenium–cadmium–indium (Se–Cd–In) has found applications in optoelectronics and solar cells due to its higher value of absorption coefficient. Dielectric relaxation studies are important to understand the nature and the origin of dielectric loss which, in turn, may be useful in the determination of structure and defects in solids. As these materials are covalently bonded solids, the dispersion is not expected at low frequencies. However, recent measurements have indicated [Citation10–Citation13] that dielectric dispersion loss does exist in these glasses even at very low frequency. The origin and nature of dielectric losses in these materials has, therefore, become a matter of curiosity.
Frequency-dependent electrical conductivity of chalcogenide semiconductors is helpful to understand the conduction mechanism in their alloys. Therefore, it is interesting to study the electrical behavior of these materials in AC fields which gives the important information about the transport process in localized state in the forbidden gap [Citation14].
AC conductivity and dielectric measurements have been reported for a wide variety of amorphous chalcogenide semiconductors in order to understand the mechanisms of conduction processes in these materials and type of polarization [Citation15–Citation25]. Chalcogenide glasses are known to be structurally disordered system and addition of impurities in the disordered system changes their structure, which leads to the change in conduction mechanism, which has been found to vary with different impurities [Citation26–Citation31]. The alloys produce characteristic effect which depends on the electronic structure of the alloying elements. Among various chalcogenide elements only Se is available in amorphous form, but it suffers from the disadvantage of short life time and low sensitivity [Citation32]. However, the addition of impurities leads to relatively stable glasses with improved physical qualities [Citation33,Citation34]. Many researchers have studied conduction mechanism and structural and optical properties of Se-based chalcogenide semiconductors [Citation35–Citation37]; however, the studies on AC conductivities are too limited and require more understanding.
In the present work indium (In) has been chosen as an additive element in Se–Cd alloys because it is recognized as one of the most efficient elements used to improve the opto-electronic properties of compounds [Citation38]. The third element behaves as chemical modifier and creates compositional as well as configurational disorder in the material with respect to binary alloys, which will be useful in understanding the structural, electrical and optical properties of Se–Cd–In chalcogenide glasses [Citation39–Citation41]. The literature survey on dielectric studies shows that relatively very few research works have been reported on dielectric relaxation studies of Se–Cd–In systems.
In the present work SEM and EDAX have been measured to analyze the surface morphology and elemental compositions of Se90Cd10−xInx (x = 2, 4, 6, 8) glassy alloys. Dielectric measurements of Se90Cd10−xInx (x = 2, 4, 6, 8) chalcogenide glasses have been carried out in the frequency range 42 Hz to 5 MHz at room temperature. The dependence of dielectric constant ɛ′, dielectric loss factor ɛ″ and loss angle Tan δ with In concentration as well as frequency is discussed. Frequency- and composition-dependent AC conductivity have been studied. The complex impedance plots have been studied for Se90Cd10−xInx glassy alloys.
2 Experimental details
Chalcogenide glassy alloys of Se90Cd10−xInx (x = 2, 4, 6, 8) were prepared from high purity (99.999%) Se, Cd and In elements by the melt quench technique. The exact amounts of alloying elements were weighed according to their atomic weight percentage using an electronic balance (LIBROR, AEG-120) with the least count of 10−4 g and placed into ultra-cleaned quartz ampoules (length ≈ 5 cm and internal diameter ≈ 8 mm). The ampoules were evacuated and sealed under a vacuum of 10−5 Torr to avoid reaction of alloying elements with oxygen at a higher temperature. The sealed ampoules were heated in a furnace at rate of 4–5 K min−1, the temperature raised up to 800 °C and kept at that temperature for 12 h. During the heating process, the ampoules were constantly rocked by rotating ceramic rod to ensure the homogeneity of alloying materials. The ampoules with molten materials were rapidly quenched into ice-cooled water. The ingots of glassy materials were taken out from ampoules by breaking them. To determine the glass transition and crystallization temperatures differential scanning calorimetric (DSC) measurements were carried out on powdered samples of Se90Cd10−xInx under pure N2 atmosphere using Mettler Toledo Star instrument (Model No. DSC-200PC). Surface morphology was studied using the JEOL, Japan JSM-6510 Model SEM. The magnification used was 10,000×. The compositional analysis of the prepared alloy was studied by EDAX attachment to the above-mentioned SEM model. Dielectric and electrical conductivity measurements have been done with Hioki LCR Hi-Tester (3522) in the frequency range from 42 Hz to 5 MHz. For this, glassy samples were pressed into cylindrical pellet forms having diameter 10 mm and thickness about 1.2 mm under uniform load of 5 tons using hydraulic press. A pellet was sandwiched between two circular silver discs in order to ensure good electrical contact between sample and electrodes of the LCR meter. This whole assembly of sample and discs is placed between the electrodes of the LCR meter. The signal voltage level was kept at 0.02 V.
3 Results and discussion
3.1 Differential scanning calorimetric analysis
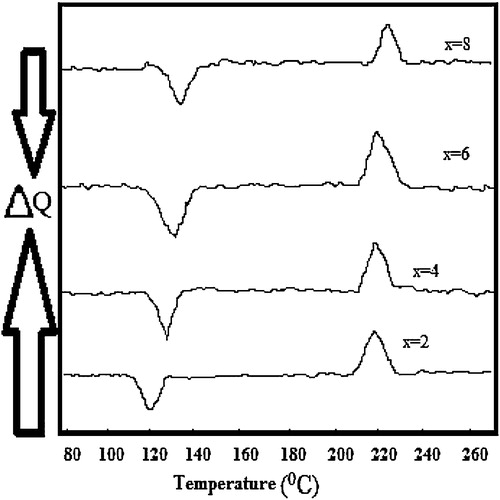
A typical DSC thermogram of Se90Cd10−xInx (x = 2, 4, 6, 8) at a particular heating rate of 10 K min−1 is shown in . Similar thermograms were obtained for other heating rates at 5, 15, and 20 K min−1 also (results not shown here). It is evident from that each thermogram shows two distinct peaks corresponding to glass transition (Tg) and peak crystallization temperature (Tc). Glass transition and peak crystallization temperatures for Se90Cd10−xInx (x = 2, 4, 6, 8) have been determined and listed in .
Table 1 Glass transition (Tg) and crystallization temperatures (Tc) for glassy Se90Cd10−xInx (x = 2, 4, 6, 8) alloys.
Fig. 1 DSC thermograms for glassy Se90Cd10−xInx (x = 2, 4, 6, 8) alloys at heating rate of 10 K min−1.
3.2 Surface morphological analysis
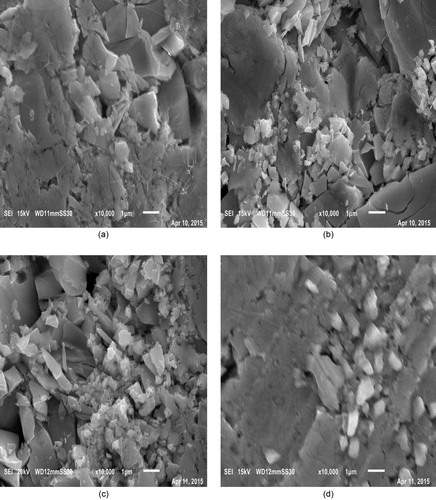
SEM is a promising technique for the topographic analysis, which gives important information regarding growth mechanism, shape and size of the sample. shows the scanning electron micrographs of the studied samples, and it can be observed that morphology of the prepared bulk samples (pellet) changes with Indium content. From SEM micrographs it is evident that images of the samples are uniform and without any pin holes or cracks and there is formation of conchoidal contours, which shows the presence of some micro-crystallites embedded in the glass matrix of the synthesized material.
Fig. 2 SEM images of Se90Cd10−xInx glassy alloys at 10,000× magnification [(a) x = 2, (b) x = 4, (c) x = 6 and (d) x = 8].
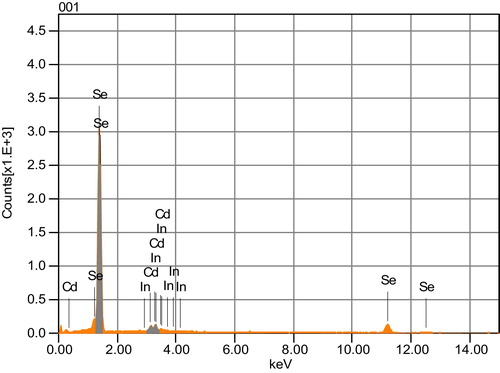
The elemental compositions of Se90Cd10−xInx glassy alloys were checked by energy dispersive X-ray analysis (EDAX). shows the energy dispersive X-ray spectroscopy (EDAX) of Se90Cd8In2 glassy alloy. EDAX for other compositions are also studied (results not shown here). gives the compositional analysis of Se90Cd10−xInx glassy alloys. EDAX analysis indicates the absence of impurity elements in the studied composition.
Table 2 The compositional analysis of Se90Cd10−xInx (x = 2, 4, 6, 8) glassy alloys.
Fig. 3 Energy dispersive X-ray analysis EDAX for Se90Cd8In2 glassy alloy.
3.3 Dielectric properties
Under dielectric studies, we measure the electrical properties of a material as a function of frequency. Dielectric analysis helps to define two fundamental electrical characteristics of materials. First the capacitive insulating nature, which represents its ability to store electrical charge and second the conduction nature, which represents its ability to transfer electric charge. In the succeeding section good attention has been paid to investigate the dielectric properties of Se90Cd10−xInx (x = 2, 4, 6, 8) glassy alloys in the frequency range 42 Hz to 5 MHz at room temperature. As a general features of the obtained results, the frequency and composition dependence of dielectric constant (ɛ′) and dielectric loss (ɛ″) are investigated. The loss factor Tan δ, which determines how well a material can absorb the electromagnetic field, has also been investigated with respect to frequency and composition.
3.3.1 The frequency and composition dependence of dielectric constant (ɛ′) and dielectric loss (ɛ″)
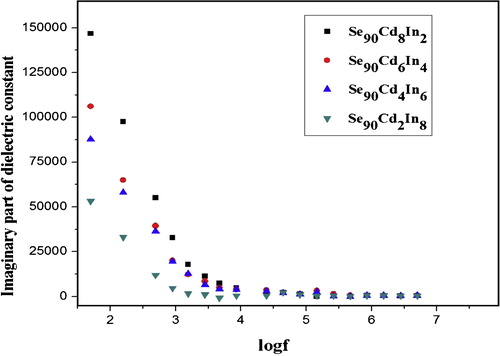
The variation of real and imaginary part of dielectric constant with frequency at room temperature for Se90Cd10−xInx (x = 2, 4, 6, 8) glassy system is shown in and respectively. The values of real part of dielectric constants (ɛ′) and imaginary part of dielectric constant (ɛ″) decrease with an increase in frequency at room temperature for all compositions. The values of ɛ′ and ɛ″ drop from a maximum value at low frequencies and then become weekly frequency dependent and finally attaining a constant value at higher frequencies. The values of dielectric constant and dielectric loss for a selected set of frequencies are given in .
Table 3 Dielectric constant (ɛ′) and Dielectric loss factor (ɛ″) for Se90Cd10−xInx (x = 2, 4, 6, 8) alloys at selected frequencies.
Fig. 4 Variation of real part of dielectric constant with log f.
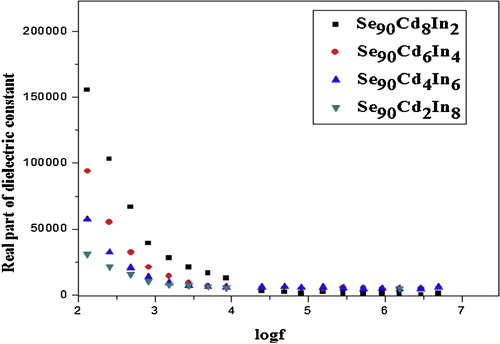
Fig. 5 Variation of dielectric loss with log f.
The decrease of ɛ′ with increasing frequency can be attributed to the fact that ɛ′ for polar material at low frequencies is explained by the contribution of multi-components of polarizability, deformational (electronic and ionic) and relaxation (orientational and interfacial) polarization. First, electronic polarization arises from the displacement of the valence electrons relative to the positive nucleus. This type of polarization takes place at frequencies up to 1016 Hz. The second type is the ionic polarization, which occurs due to the displacement of negative and positive ions with respect to each other. The maximum frequency of ionic polarization is 1013 Hz. Third, dipolar polarization occurs if the material contains molecules, with permanent electric dipole moment that can change orientation into the direction of the applied electric field. The dipolar polarization takes place at frequencies up to 1010 Hz. The final one is the space charge polarization which occurs due to impedance mobile charge carriers by interfaces. Space charge polarization typically occurs at frequency range from 1 to 103 Hz. The sum of above four types of polarization gives the total polarization for dielectric materials [Citation42,Citation43]. The obtained results in the present study referred that the ionic polarization does not play a pronounced effect in the total polarization, where the degree of covalency in the studied sample is calculated using the following relation [Citation44]:(1)
(1) where ζA and ζB are the electronegativites of atoms A and B, respectively.
The values of covalent character of the expected bonds present in the studied sample are listed in , which reveals that the covalent character of bonding is predominant in the studied sample.
Table 4 Calculated covalent character of bonds for Se90Cd10−xInx (x = 2, 4, 6, 8) glassy alloys.
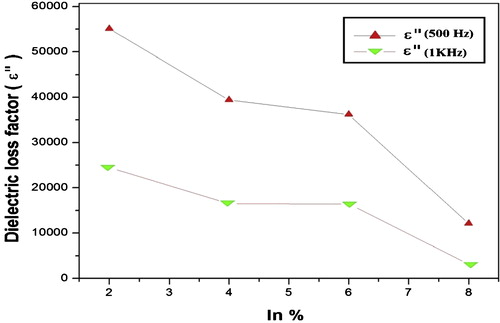
The orientational polarization decreases with increasing frequency, because it takes more time than ionic and electronic polarization. Due to this reason the value of ɛ′ decreases and reaches a constant value at higher frequency corresponding to interfacial polarization. shows the variation of dielectric loss (imaginary part of dielectric constant (ɛ″)) with frequency. The decrease of ɛ″ with frequency can be attributed to the fact that, at low frequencies, the values of ɛ″ are due to the migration of ions in the material. At moderate frequencies ɛ″ is due to the contribution of ion jumps, conduction loss of ion migration and ion polarization loss. At high frequencies ion vibrations may be the only source of dielectric loss and so ɛ″ has the minimum value [Citation45]. The characteristic of low dielectric constant and dielectric loss with high frequency for a given sample suggests that the sample possesses enhanced optical quality with lesser defects and this parameter is of vital importance for various nonlinear optical materials and their applications [Citation46]. Compositional dependence of ɛ′ and ɛ″ in Se90Cd10−xInx glassy alloys are given in and are plotted in and . The values of ɛ′ and ɛ″ are found to be decreasing with increase of In content in Se–Cd matrix which can be attributed to the fact that addition of a third element In to Se–Cd matrix is expected to modify the structure of the host alloy, which cause decrease in density of charge defects states and ultimately affects the dielectric properties. In the present case In is incorporated on the cast of Cd. The decrease in density of charge defect states can be explained on the basis of structural defect model proposed by Onozuka et al. [Citation47]. The electronegativity of Se, Cd and In is 2.55, 1.69 and 1.78 respectively, following Pauling values of electronegativity. When In having higher electronegativity than Cd is introduced, negatively charge defects will be created, thus decreasing the density of defect states in binary Se–Cd matrix. From the above discussion it is clear that the addition of In to Se–Cd matrix decreases the number of charged defect states which may affect the dielectric properties. As the dielectric loss in these glasses depends on the total number of localized states, the decrease of dielectric loss with the increase of In concentration can be understood in terms of the decreased density of defects on addition of In to Se–Cd glassy system. Due to the decrease in number of dipoles (D+ and D−) at higher concentration of In, the dielectric constant is also expected to decrease with In concentration as we have found in the present study.
Fig. 6 Compositional dependence of dielectric constant (ɛ′) in Se90Cd10−xInx glassy alloys.
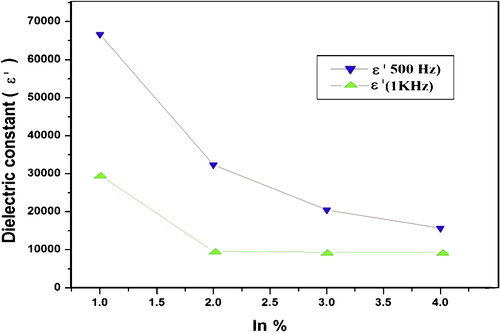
Fig. 7 Compositional dependence of dielectric loss (ɛ″) in Se90Cd10−xInx glassy alloys.
3.3.2 Frequency dependence of loss factor Tan δ
The variation of the loss factor (Tan δ) with frequency for different compositions of Se–Cd–In alloy is shown in . The variation is much prominent at lower frequencies. It has been observed that Tan δ decreases with frequency, which may be attributed to the fact that the charge carriers existing in the glassy alloys can migrate for some distance under the influence of an applied electric field. When such carriers are blocked at the electrodes, a space charge region results which leads to a substantial increase in Tan δ toward low frequencies [Citation48].
Fig. 8 Variation of loss angle Tan δ with frequency for Se90Cd10−xInx at room temperature for different compositions.

3.4 Frequency and composition dependence of AC conductivity
The frequency variation studies have been carried out to understand the electrical homogeneity of the material by identifying the relaxation mechanism as well as the nature of electrical conduction. In AC conductivity measurements, sinusoidal voltage of different frequencies is applied across the sample of thickness d and area A. If ω is the frequency of applied signal and ɛ0 is the permittivity of free space, then AC conductivity is given as [Citation49,Citation50](2)
(2)
(3)
(3) where ɛ″ = ɛ′ Tan δ is the imaginary part of dielectric constant, ɛ′ = Cpd/ɛ0A is the real part of dielectric constant and Tan δ = 1/Tan θ is the loss tangent or dissipation factor.
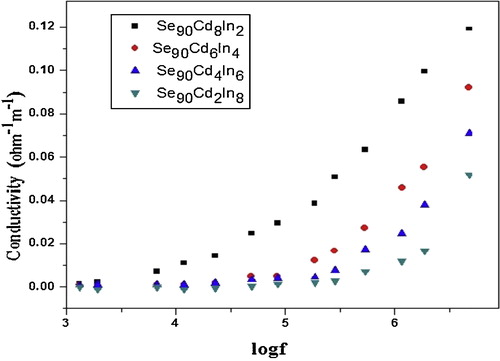
The variation of AC conductivity with frequency at room temperature for different compositions of Se–Cd–In alloy is shown in . The graph of log σ vs log f shows almost frequency-independent region in low frequency range followed by strong frequency dependence at higher frequencies. It has been observed that AC conductivity increases with increase of frequency. The increase of AC conductivity in high frequency range at a particular temperature may be due to enhancement in conduction mechanism.
Fig. 9 Variation of AC conductivity with log f.
The frequency and composition dependence of the σac(ω) are shown in for the studied alloys.
Table 5 Values of AC conductivity σac(ω) for Se90Cd10−xInx (x = 2, 4, 6, 8) alloys at room temperature.
It has been observed from , that there is a significant increase in the AC conductivity σac(ω) with increase in frequency at room temperature. Also it is found that σac(ω) decreases with In content in Se–Cd matrix, and this may be due to structural disorder produced in the binary compound Se–Cd due to addition of In. The addition of In leads to decrease in the density of localized states in the band tail which consequently results into decrease in σac(ω).
3.5 Impedance of Se90Cd10−xInx glassy alloys
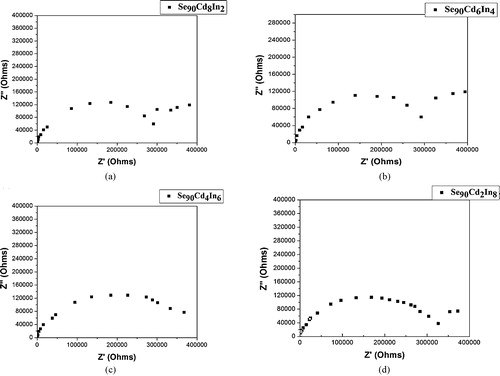
shows the complex impedance plots (Cole–Cole plot) of Se90Cd10−xInx (x = 2, 4, 6, 8) glassy alloys. In the complex impedance plot semicircular arcs were obtained for each composition originating at the origin point with their centers lying below the real axis and cutting the axis at the origin and at Z′ = Rb, where Rb is the bulk resistance. Single semicircles with a spike at low frequencies can be observed for all the samples. Since the impedance plot gives only one semicircle originating at (0,0), it indicates that the composition can be represented by two physically different regions which are in parallel with one another with same reference voltage, a bulk resistance Rb in parallel with capacitance Cb. It is important to note that Rb is considered an ideal frequency-independent element responding the same under both DC and AC currents [Citation51]. The peak of the semicircle has been used to determine the relaxation time (τ). The low frequency intercept made by the semicircle on the real impedance axes can be used to determine the DC resistance of the sample.
Fig. 10 Cole–Cole plot of Se90Cd10−xInx glassy alloys: (a) x = 2, (b) x = 4, (c) x = 6 and (d) x = 8.
The values of the real and imaginary components for such circuits are given as(4)
(4)
(5)
(5) where θ is the phase angle between current and the voltage applied on the sample, and can be given as
(6)
(6)
The values of Rb have been calculated for all the studied compositions and listed in . It is found that Rb increases with In concentration in Se–Cd matrix.
Table 6 Bulk resistance (Rb) of Se90Cd10−xInx (x = 2, 4, 6, 8) glassy alloys.
The presence of spike at low frequencies is a typical polarization effect at the electrodes and indicates the presence of an ionic contribution to electrical conductivity [Citation52,Citation53].
4 Conclusions
The SEM revealed that morphology of the prepared sample changes with In content. Dielectric behavior of Se90Cd10−xInx (x = 2, 4, 6, 8) glassy alloys has been studied using impedance spectroscopic technique. The values of dielectric constant and dielectric loss show frequency dispersion at low frequencies and show low values at high frequencies. It has been found that both ɛ′ and ɛ″ decreases with increase of In content in Se90Cd10−xInx glassy alloys. The characteristics of low dielectric constant and dielectric loss with high frequency suggest that Se90Cd10−xInx (x = 2, 4, 6, 8) glassy alloys possess enhanced optical quality with lesser defects and this parameter is of vital importance for various nonlinear optical materials and their applications. The loss factor Tan δ has been found to have decreasing trend with frequency and composition. Frequency and composition dependence of AC conductivity of the Se90Cd10−xInx glassy alloys have been studied. It has been observed that AC conductivity of Se–Cd–In glassy alloys increases with increase in frequency while it decreases with increase of In content in Se–Cd matrix. Single semicircles are observed in the complex impedance plots of Se90Cd10−xInx glassy alloy and a spike is observed at low frequencies. These semicircles reveal a single relaxation process whereas the spike observed at low frequencies indicates the presence of an ionic contribution to the electrical conductivity of the material.
Acknowledgements
The authors are very much grateful to the University Grants Commission (UGC), New Delhi, India for providing financial assistance in form of major research project F.No. 39-452/2010 (SR). The authors also thank Dr. Neelam Srivastava, Department of Physics (MMV), B.H.U., Varanasi for providing the facility of dielectric measurement. Valuable suggestions received from Dr. N. Mehta, Department of Physics, B.H.U., Varanasi are thankfully acknowledged.
Notes
Peer review under responsibility of The Ceramic Society of Japan and the Korean Ceramic Society.
Related Research Data
References
- T.MahalingamA.KathalingamS.VelumaniS.LeeK.S.LewY.D.KimSemicond. Sci. Technol.202005749754
- R.TenneY.MirovskyY.GreensteinW.GiriatJ. Electrochem. Soc.132198518291835
- S.H.ChoeB.N.ParkXi-Yu-SuS.J.OhH.L.ParkW.T.KimJ. Phys. Chem. Solids5619958992
- D.K.DwivediN.ShuklaH.P.PathakK.SinghAm. J. Mater. Sci. Eng.2220141317
- D.K.DwivediH.P.PathakR.K.ShuklaA.KumarOpt. – Int. J. Light Electron Opt.1262015635639
- H.P.PathakN.ShuklaV.KumarD.K.DwivediOpt. Mater.5220166974
- H.FritzscheJ. Phys. Chem. Solids682007878882
- S.RaouxW.WelnicD.IelminiChem. Rev.1102010240267
- M.Mohsin GanaieZulfequarActa Phys. Pol. A12820155963
- M.A.AfifiA.E.BekheetE.A.ElwahhabH.E.AtiyaVacuum612001917
- A.Abdel AalEgypt. J. Solids2922006303316
- B.S.RaoB.R.KumarV.R.ReddyT.S.RaoG.V.ChalapathiChalcogenide Lett.9122012517525
- H.E.AtyiaN.A.HegabM.A.AffiM.I.IsmailJ. Alloys Compd.5742013345353
- A.N.R.LongAdv. Phys.311981553637
- A.Abdel-AalJ. Mater. Sci. Technol.1431998247250
- R.A.BitarD.E.ArafahSol. Energy Mater. Sol. Cells51119988393
- A.E.OwenGlass Ind.481967637
- K.SedeekA.AdamL.A.WahabF.M.HafezMater. Chem. Phys.85120042026
- K.AbeH.TakebeK.MorinagaJ. Non-Cryst. Solids2121997143150
- M.A.RedwanE.H.AlyL.I.SolimanA.A.El-ShazelyH.A.ZayedVacuum6942003545555
- M.A.M.SeyamAppl. Surf. Sci.1812001128138
- B.TareevPhysics of Dielectric Materials1979Mir PublisherMoscow
- P.V.JoyothyK.V.ArunkumarS.KarthikaR.RajeshN.V.UnnikrishnanJ. Alloys Compd.4932010223226
- I.S.RamR.K.SinghP.SinghK.SinghJ. Alloys Compd.5522013480485
- H.E.AtiyaJ. Non-Cryst. Solids39120148390
- A.SharmaN.MehtaA.KumarJ. Mater. Sci.4613201145094516
- M.A.M.KhanM.ZulfequarM.HussainCurr. Appl. Phys.252002401406
- R.M.MehraS.KohliA.PundirV.K.SachdevP.C.MathurJ. Appl. Phys.81199778427844
- S.MurugavelS.AsokanPhys. Rev. B58199844494453
- L.A.WahabMater. Chem. Phys.8022003401404
- V.K.BhatnagarK.L.BhatiaJ. Non-Cryst. Solids11921990214231
- S.A.KhanM.ZulfequarM.HussainSolid State Commun.1232002463
- P.SharmaS.C.KatyalPhysica B403200836673671
- E.MarquezT.WagnerJ.M.Gonzalez-LealA.M.Bernal-OliveR.Prieto-AletonR.Jimenez-GarayP.J.S.EwenJ. Non-Cryst. Solids27420006268
- A.VidourekL.TichyM.VlcekMater. Lett.2219955964
- F.SalamJ.C.GiuntiniS.S.SoulaymanJ.V.ZanchettaAppl. Phys. A: Mater. Sci. Process.601995309312
- A.DaoudiJ.C.LevetM.PotelH.NoelMater. Res. Bull.31199612131218
- W.ZhouD.TangA.PanQ.ZhangQ.ZhangQ.WanB.ZouJ. Phys. Chem. C115201114151421
- V.M.NikaleC.H.BhosealeSol. Energy Mater. Sol. Cells822004310
- T.MahalingamS.ThanikaikarasanR.ChandramohanK.ChungJ.P.ChuS.VelumaniJ.-k.RheeMater. Sci. Eng. B1742010236241
- K.SharmaA.S.Al-KabbiG.S.S.SainiS.K.TripathiJ. Alloys Compd.56420134248
- N.A.HegabH.M.El-MallahActa Phys. Pol. A116200910481152
- M.BarsoumFund. Ceram.1977McGraw HillNew York
- L.PaulingThe Nature of Chemical Bond1960Cornell UniversityNew York
- N.A.HegabA.E.BekheetM.A.AfifiL.A.WahabaH.A.ShehataJ. Ovonic Res.320077182
- K.RajarajanG.ManiI.V.PotheherJ.G.M.JesuduraiM.VimalanD.ChristyJ. Phys. Chem. Solids68200723702375
- A.OnozukaO.OdaI.TsuboyaThin Solid Films1491987915
- A.V.HippelE.P.GrossF.G.TelstisA.GellerPhys. Rev.911953568
- B.C.BakerTemperature Sensing Technologies1998AN 679 Microchip Inc.
- S.BhatS.K.KhosaP.N.KotruR.P.TandonMater. Sci. Eng. B3091995711
- F.SalmanTurk. J. Phys.2820044148
- D.C.SinclairA.R.WestPhys. Rev. B391819891348613492
- S.LanfrediL.DessemondA.C.M.RodriguesJ. Am. Ceram. Soc.862003291298