
 ?Mathematical formulae have been encoded as MathML and are displayed in this HTML version using MathJax in order to improve their display. Uncheck the box to turn MathJax off. This feature requires Javascript. Click on a formula to zoom.
Abstract
A detailed study of conduction mechanism of glassy Se70Te30 and Se70Te28M2 (M = Ag, Zn and Cd) alloys has been carried out in terms of dielectric properties and a.c. conductivity. Temperature and frequency dependent dielectric constant, dielectric loss and σac for the same system were measured in the frequency spectrum, 1 kHz to 1 MHz and temperature range, 303–338 K. The a.c. conductivity (σac) is found to be proportional to ωs (s < 1). The temperature dependence of both a.c. conductivity and frequency exponent (s) is reasonably well interpreted by the correlated barrier hopping (CBH) model. We showed that the bi-polaron hopping is dominant over the potential barrier and estimated the density of defect states (DOS) at 10 kHz. We found a good agreement between bi-polaron conductivity and experimental results.
1 Introduction
The transport mechanism of charge carriers in amorphous semiconductors has been the subject of intensive theoretical and experimental investigations. Chalcogenide glassy semiconductors have drawn the attention of researchers due to attractive possibilities of using the structural and compositional disorder in these materials for the development of better, cheaper and more reliable solid state devices [Citation1–Citation3]. The behavior of a.c. conductivity and density of defect states (DOS) of amorphous chalcogenide semiconductors have been extensively used to understand the conduction process in these materials. Various models i.e. quantum-mechanical tunneling (QMT) [Citation4,Citation5], small polaron tunneling [Citation6,Citation7], large polaron tunneling [Citation6], atomic hopping [Citation6,Citation7] and correlated barrier hopping (CBH) model [Citation8–Citation10] have been proposed to explain the conduction mechanism for glassy materials.
The common feature of amorphous chalcogenide glasses is the presence of localized states in the mobility gap due to the absence of long-range order as well as various inherent defects [Citation4,Citation11,Citation12]. The hopping conduction can be easily distinguished from that of band conduction by measuring the frequency dependent conductivity [Citation6], arising due to conduction in localized states. The information about these states is useful for the understanding of electronic properties of these materials [Citation10,Citation13]. Dielectric and a.c. conductivity measurements have been widely used to investigate the nature of defect centers in chalcogenide glasses, since it is assumed that they are responsible for the type of conduction. Elliott [Citation14] proposed the CBH model, using the concept of charged defect states D+ and D− in chalcogenide glasses. It is reasonably assumed that for most of the materials at low to intermediate temperatures, only charged defect centers are present, i.e., the effective correlation energy, Ueff is sufficiently large (Ueff ≫ kBT) such that all neutral D0 centers are converted to D+ and D− centers. In this case if, an alternating field is applied, the simultaneous motion of two electrons is the only possible way to electron transfer between defects that preserves the identity of the defects. In the intermediate temperature regime, the CBH mechanism involving bi-polaron transport gives a satisfactory description of the experimental data in most of the amorphous alloys. The temperature dependence of σac(ω) predicted by this model indicates that σac(ω) increases with increasing temperature. Shimakawa [Citation10,Citation15] proposed that a competing process, namely the CBH of single polarons, becomes dominant, at high temperature. For the case of chalcogenide glasses, it is assumed that an electron hops between D0 and D+ and, hole between D0 and D− centers [Citation10].
Tailoring of physical properties of a particular composition of glassy Se–Te system (e.g., Se80Te20, Se70Te30, Se85Te15, etc.) by changing either its concentration with a third additive or by changing the third additive itself is a current trend. The former approach (i.e., changing the concentration with a third additive) has been used by several workers in last six decades but only few cases are available in the literature in which the later trend (i.e., changing the third additive itself) has been used. Sharma and Kumar investigated the role of metallic Zn and In additives in the electrical and dielectric properties of Se85Te15 glassy alloy [Citation16]. The same group reported the role of additives (Cd and Ge) on the a.c. conductivity and dielectric relaxation of Se70Te30 glassy alloy [Citation17]. In recent years, we have started research work in our laboratory as a part of systematic investigations to see the metal-induced effects of different additives (e.g., Ag, Cd, In, Sb, Zn, etc.) on physical properties of glassy alloys of Se100−xTex system for a particular composition [Citation18–Citation21]. Chandel et al. [Citation19,Citation20] reported the effect of Cd, In and Sb additives on a.c. conduction in Se80Te20 alloy by incorporating lower concentration (0.5 atomic percentage) and concentration (10 atomic percentage) of these additives at the cost of Te. They observed that the parameters of a.c. conduction are changed significantly for both cases. Dohare et al. [Citation21,Citation22] reported the effect of some metallic additives (Ag, Cd, Zn) on the glass transition and crystallization kinetics of glassy Se70Te30 alloy.
The present work is our new attempt in this direction. In previous work, Chandel et al. used an analog capacitance measuring assembly [Capacitance Bridge GR 1620AP] for a.c. conductivity measurements. In present paper, we have used more efficient and the state of art technique for a.c. conductivity measurements as well as dielectric measurements. For this purpose, we have employed a digital LCR meter assembly having facility of computer software for more accurate measurements. In our previous papers [Citation19,Citation20], the limitation of Capacitance Bridge was its frequency range that offers measurements of dielectric and a.c. conductivity properties only at five audio frequencies ranging from 0.5 kHz to maximum frequency 10 kHz. The advantage of digital LCR meter assembly is its wide audio frequency range from 0.5 kHz to maximum frequency 1 MHz. Thus, one can study the dielectric relaxation and a.c. conduction in chalcogenide glasses for more wide frequency range. The details of this equipment are given in next section.
The aim of this paper is to report the results of experimental investigations on dielectric parameters and a.c. conductivity for glassy Se70Te30 and Se70Te28M2 (M = Ag, Zn and Cd) alloys. The metal-induced effect of incorporated additives (Ag, Zn, Cd) on the electrical transport in parent binary Se70Te30 alloy has been studied. For this purpose, the temperature and frequency dependence of dielectric parameters and a.c. conductivity has been analyzed in the electrical transport formalism.
2 Material preparation and characterization
Glassy Se70Te30 and Se70Te28M2 (M = Ag, Zn and Cd) alloys were prepared by quenching technique as discussed in the paper [Citation21]. The pellet was mounted in between two copper electrodes of a metallic sample holder for dielectric measurements. The temperature measurement was facilitated by a copper–constantan thermocouple mounted very near to the sample. A vacuum of ∼10−3 Torr was maintained over the entire temperature range, 303–333 K in the frequency spectrum, 1 kHz to 1 MHz. The temperature dependence of ɛ′ was studied in heating run at a heating rate of 1 K/min. Dielectric measurements were made using a digital LCR meter [Wayne Kerr Electronics, Model: 4100]. Conductive-dielectric properties of chalcogenide glasses can be modeled as a parallel combination of dispersive capacitance element Cp and a resistance element Rp. For the measurements of real and imaginary parts of complex dielectric constant (ɛ = ɛ′ − iɛ″), the measurements are carried out in Cp − D mode of the LCR meter.
The parallel capacitance Cp and dissipation factor D were measured directly for calculating the ɛ′ and ɛ″ parameters. We preferred to perform experiment on the pellets rather than the bulk as macroscopic effects (gas bubbles, etc.) may appear in the bulk during preparation. It has been shown [Citation23], both theoretically and experimentally, that bulk ingots and compressed pellets exhibit similar dielectric behavior in chalcogenide glasses for the suspected inhomogeneity in case of compressed pellets in these materials.
3 Theoretical formulations
Dielectric analysis measures the electrical properties of a material as a function of temperature and frequency. It measures two fundamental electrical characteristic of materials: (1) the capacitive (insulating) nature, which represents its ability to store electric charge; (2) the conductive nature, which represents its ability to transfer electric charge. The a.c. conductivity in semiconductors has been interpreted in terms of the pair approximation. In this approximation, a pair consisting of two localized states between which electronic carriers move from side to side with a particular relaxation time. In amorphous semiconductors, the localized states have been considered to be randomly distributed in the space and pairs with various relaxation times. The a.c. conductivity is the sum of contributions from all the pairs. According to CBH model, correlated barrier hopping of bi-polarons (i.e. two electrons hopping between charged defect D+ and D−) has been proposed to interpret the frequency dependent of conductivity in chalcogenide glass according to following relation [Citation24]:(1)
(1)
Each of charged defect states D+ and D− has a coulomb potential well associated with it. For neighboring sites, at a separation r, the coulomb wells overlap resulting in a lowering of the effective barrier from Wm to a value W, which is specified as:(2)
(2) where Wm is the maximum barrier height, ɛ′ is the bulk dielectric constant, ɛ0 is the permittivity of free space, r is the distance between hopping sites and n is the number of polarons in a hop (n = 1 and n = 2 for single polaron and bi-polaron processes, respectively).
According to CBH model, the a.c. conductivity, σac(ω) for bi-polaron hopping originating from D+ and D− pairs having a non-random distribution can be written as:(3)
(3)
The hopping distance Rω for the condition ωτ ≤ 1 is given by:(4)
(4)
Here N is the density of localized states at which carriers exist; NP is the density of localized states to which the carriers hop. Tg is the glass transition temperature. The a.c. conductivity σac(ω), for single polaron hopping originating from randomly distributed defect centers can be expressed as [Citation24,Citation25]:(5)
(5)
(6)
(6)
Generally, a.c. conductivity of the chalcogenide glasses can be expressed as:(7)
(7)
Here and
are the a.c. conductivities for single polaron hopping originating from randomly distributed defect states (Eq. Equation(5)
(5)
(5) ) and bi-polaron hopping originating from non-random distribution of defect states (Eq. Equation(3)
(3)
(3) ), respectively.
The frequency dependence of dielectric loss, ɛ″ shows that it follows a power law with operating angular frequency, ω as:(8)
(8)
Here, A is proportionality constant and m is temperature dependent frequency exponent which has negative value (m < 0) at all temperatures. The frequency exponent, m is determined from the slopes of such straight lines at various temperatures for Se–Ag–In glassy system at all four compositions. Giuntini [Citation23] had proposed a dipolar model for dielectric dispersion in chalcogenide glasses. This model is based on Elliott’s theory [Citation24] for hopping of charge carriers over a potential barrier between charged defect states D+ and D−. Each pair of sites D+ and D− is assumed to form a dipole which has a relaxation time depending on its activation energy and next can be attributed to the existence of a potential barrier over which the carriers hop.
4 Results and discussion
4.1 Frequency and temperature dependence of dielectric constant and dielectric loss
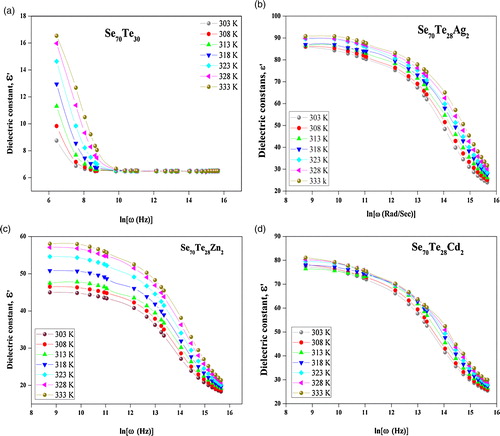
(a)–(d) represents the frequency dependence of the dielectric constant ɛ′ for present glassy Se70Te30 and Se70Te28M2 (M = Ag, Zn, Cd) alloys. From (a), one can see that there is a drastic change of dielectric constant in glassy Se70Te30 alloy at low and moderate frequencies, and shows strong frequency dependency of dielectric constant at low frequency up to 5 kHz while it shows the constant dielectric value throughout the higher frequency range up to 1 MHz. (b)–(d) shows that the nature of parent system is quite different after the incorporation of chemical modifiers, M = Ag, Zn, Cd. Dielectric constant shows nearly constant/or weak frequency dependency at low frequency range (up to ∼50 kHz) while it shows sharp frequency dependency at higher frequency (up to ∼1 MHz). These figures indicate that ɛ′ decreases with frequency and increases with temperature. The decrease in ɛ′ with increasing frequency is due to the contribution of the several components of polarization, i.e. electronic, ionic, dipolar or orientation and space charge [Citation26]. The behavior of dielectric constant with temperature can be attributed to the fact that dipoles in polar materials cannot orient themselves at low temperatures. When the temperature is increased the orientation of dipoles facilitated so, this increases the orientational polarization. This causes the increase in dielectric constant, ɛ′.
Fig. 1 (a–d) Frequency dependent dielectric constant, ɛ′ for glassy Se70Te30 and Se70Te28M2 (M = Ag, Zn, Cd) alloys.
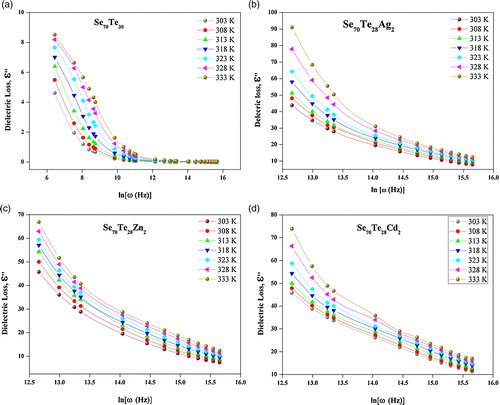
(a)–(d) shows the frequency dependence of dielectric loss ɛ″ for glassy Se70Te30 and Se70Te28M2 (M = Ag, Zn, Cd) alloys at different frequencies. From (a), it is clear that dielectric loss ɛ″ decreases with increase in frequency up to 5 kHz for parent Se70Te30. Beyond this frequency, the variation of dielectric loss ɛ″ with frequency is negligible glass and it has weak temperature dependency after 5 kHz to 1 MHz. However, in ternary glasses (see (b)–(d)), Se–Te–M (M = Ag, Zn, Cd) show a gradual decrease with normal temperature dependency throughout the whole frequency and temperatures range. It can be noticed from these figures that ɛ″ decrease with increasing frequency and increases with increasing temperature. The observed behavior of change in dielectric loss with frequency is different at different temperatures. This observed variation of dielectric loss, ɛ″ with frequency can be attributed to the fact that, at low frequencies, the experimental value of dielectric loss is due to the migration of charge carrier in material.
Fig. 2 (a–d) Frequency dependent dielectric loss, ɛ″ for glassy Se70Te30 and Se70Te28M2 (M = Ag, Zn, Cd) alloys.
4.2 Frequency and temperature dependence of a.c. conduction phenomenon
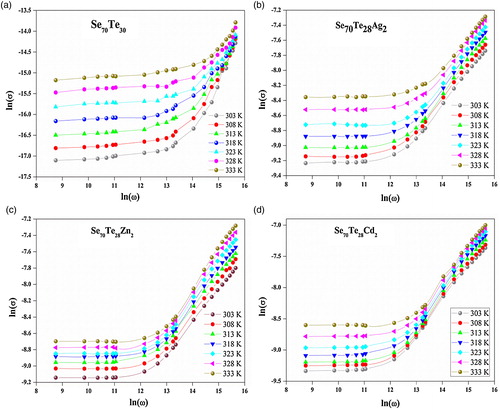
The frequency dependence of a.c. conductivity for glassy Se70Te30 and Se70Te28M2 (M = Ag, Zn, Cd) alloys at different temperatures is shown in (a)–(d). These figures reveal that ln(σac) increases linearly with ln(ω) through the measured temperature and frequency ranges mentioned above. The temperature dependence of a.c. conductivity in chalcogenide Se70Te28M2 (M = Ag, Zn, Cd) glasses is studied in the glass transition regime. The figures of ln(σ)ac vs. ln(ω) suggest two thermally activated phenomena for conduction; that conductivity, σdc is almost independent (d.c. conductivity) with angular frequency, ω up to 100 kHz; and at higher frequency range it shows linear behavior (a.c. conductivity). The estimated value of a.c. conductivity, σac (S/m) for Se–Te–M system is 5.4 × 10⁻⁸ for Se70Te30, 1.5 × 10⁻⁴ for Se70Te28Ag2, 8.8 × 10⁻⁵ for Se70Te28Zn2 and 5.5 × 10⁻⁵ for Se70Te28Cd2 alloy at 308 K.
Fig. 3 (a–d) Conductivity, as a function frequency for glassy Se70Te30 and Se70Te28M2 (M = Ag, Zn, Cd) alloys.
From Eq. Equation(1)(1)
(1) , it is clear that conductivity is dependent on ωs in high frequency regime (where s is the frequency exponent and A is the constant). The values of frequency exponent, ‘s’, were estimated from the slope of the straight lines, plotting between ln(σ)ac vs. ln(ω) in higher frequency range. The temperature dependence of the frequency exponent, ‘s’, for the investigated glassy alloys is shown in . The decrement in slope with increasing temperature for all alloys clearly indicates that the value of ‘s’ falls as the temperature rises. Thus, frequency exponent ‘s’ has been evaluated as a function of temperature, T. The observed values of ‘s’ and ‘T’ indicate that frequency exponent ‘s’ decreases with increasing temperatures for all glasses. The CBH [Citation24,Citation25] model, extensively applied to most chalcogenide semiconductors, describes the charge carriers across the defect states D+ and D−. According to the Giuntini model [Citation23], each pair of D+ and D− is assumed to form a dipole with relaxation energy.
Fig. 4 Frequency exponent, ‘s’ as a function of temperature for glassy Se70Te30 and Se70Te28M2 (M = Ag, Zn, Cd) alloys.
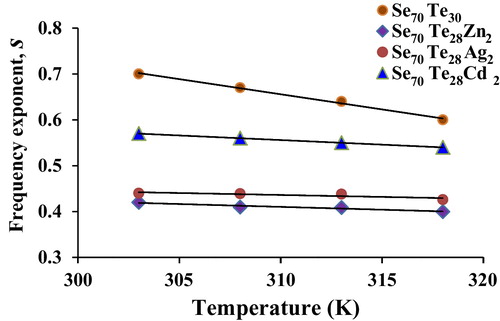
The observed behavior of s(T) indicates that the correlated barrier hopping is the possible conduction mechanism in the present glassy alloys [Citation27]. The assessment of barrier height ‘Wm’ is intended using temperature dependence of exponent, ‘s’ [Citation25] by CBH model. The estimated value of ‘Wm’ is found 0.28 eV for Se70Te30, 0.19 eV for Se70Te28Ag2, 0.22 eV for Se70Te28Zn2, and 0.25 eV for Se70Te28Cd2 system, respectively.
4.3 Metal-induced effects on dielectric constant and dielectric loss
From and , one can see that the values of dielectric constant and dielectric loss are increased appreciably after the incorporation of Ag, Cd and Zn additives. This indicates that present metallic additives influence affectively the phenomenon of dielectric relaxation in parent glass. The enhancement in dielectric parameters (ɛ′ and ɛ″) can be explained in terms of increase in the density of defect states (DOS). For this, we have determined (DOS) in next section.
4.4 Estimation of density of defect states (DOS)
shows ln σac(ω) vs. 1000/T plots for all glassy alloys. As mentioned earlier, the a.c. conduction in chalcogenide glasses can be measured as the contribution of both single and bi-polaron hopping. With this point of view, fitting of experimental data has been made to CBH model. The values of the product of N and NP are adjusted to fit the calculated curves ln σac(ω) of vs. 1/T to the experimental curves. The fitting is made at one frequency (10 kHz) and the same values of parameters are employed for other frequency. The values of Wm for different alloys are calculated using temperature dependence of exponent, ‘s’ [Citation25].
Fig. 5 (a–d) Conductivity, s (S/m) as a function of inverse temperature for glassy Se70Te30 and Se70Te28M2 (M = Ag, Zn, Cd) alloys.
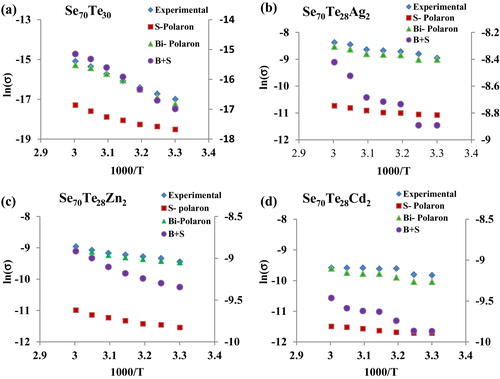
(a)–(d) shows the contributions for single polaron and bi-polaron hopping processes and their sum for Se–Te–M (M = Ag, Zn, Cd) system at a frequency of 10 kHz. As seen from this figure, theoretical curves are in fair agreement with the experimental results. It is also clear from these figures that bi-polaron contribution is dominant over single polaron for present alloys. This may be understood as follows:
It is observed that the condition, ωτ0max ≫ 1 does not hold at high temperatures for small values of Wm for n = 1. In such a case, the curve cannot be extended to the high temperature region because there will be a dielectric loss peak at the frequency, Wm which is estimated according to CBH model. Since [ln σac(ω)]s ∝ ω2 is the single-polaron contribution to a.c. conductivity may, therefore, be smaller than bi-polaron contribution to a.c. conductivity due to dielectric loss as has been observed in the present case. The density of charged defect states, N, is evaluated from the values of NNP (here NP = N/2). The value of defect states (DOS), N and the distance of intersite separation (between two localized sites), Rω at 10 kHz are specified in . From this table one can clearly see that the value of N is higher for ternary Se70Te28M2 alloys as compared to parent binary Se70Te30 glass.
Table 1 Estimated values of density of defect states (DOS) and the distance of inter-site separation (Rω present Se–Te and = Ag, Zn, Cd) alloys.
5 Conclusions
The major conclusions are pointed out as follows:
| • | Analysis of results obtained from the frequency and temperature dependence of both dielectric constant ɛ′ and dielectric loss ɛ″ proves that dielectric dispersion exists in present two glassy systems in the audio frequency range. | ||||
| • | The value of the frequency exponent, ‘s’ and its temperature dependence confirmed the applicability of the CBH model to the investigated system. Application of the CBH model clearly indicates that the electronic conduction takes place by single polaron and bi-polaron hopping processes. | ||||
| • | It has been demonstrated that the combined mechanism of single and bi-polaron hopping satisfactorily accounts for a.c. conductivity of the present Se–Te–M (M = Ag, Zn, Cd) alloys. | ||||
| • | It has also been found that for the present alloys, the bi-polaron hopping is dominant over single polaron hopping. The value of conductivity, σ (S/m) for Se–Te–M (M = Ag, Zn, Cd) alloys is achieved 1000 times higher than that of parent glassy, Se70Te30 system. | ||||
| • | The values of ɛ′ and ɛ″ are increased after addition of Ag, Zn, Cd in parent glass. This is explained in terms of increment of DOS in ternary glasses. | ||||
| • | The values of the density of charged defect states and potential barrier are found to be optimum in case of Se70Te28Ag2 system. | ||||
Acknowledgment
NM is thankful to the Department of Science and Technology (DST), Delhi, India for providing financial assistance under Fast Track Young Scientists Scheme [Scheme No. SR/FTP/PS-054/2010].
Notes
Peer review under responsibility of The Ceramic Society of Japan and the Korean Ceramic Society.
References
- D.LencerM.SalingaB.GrabowskiT.HickelJ.NeugebauerM.WuttigNat. Mater.72008972977
- N.MehtaRev. Adv. Sci. Eng.42015173182
- W.H.KimV.Q.NguyenL.B.ShawL.E.BusseC.FloreaD.J.GibsonR.R.GattassS.S.BayyaF.H.KungG.D.ChinR.E.MiklosI.D.AggarwalJ.S.SangheraJ. Non-Cryst. Solids4312016815
- M.PollakPhilos. Mag.231971519543
- A.GhoshPhys. Rev. B42199056655676
- M.PollakG.E.PikePhys. Rev. Lett.28197214491451
- A.KondoK.ShimakawaY.InagakiJ. Phys. C: Solid State Phys.16198352115216
- S.R.ElliottPhilos. Mag. B361978553560
- J.SinghK.ShimakawaAdvances in Amorphous Semiconductors2003CRC PressUSA
- K.ShimakawaPhilos. Mag.461982123135
- E.A.DavisN.F.MottPhilos. Mag.221970903922
- M.PollakProceedings of the International Conference on Physics of Semiconductor1962Execute, Institute of Physics and Physical SocietyLondon276
- M.A.AfifiN.A.HegabH.E.AtyiaA.S.FaridJ. Alloys Compd.46320081017
- S.R.ElliottPhilos. Mag. B3619771291
- K.ShimakawaJ. Phys.421981167
- J.SharmaS.KumarTurk. J. Phys.352011349
- J.SharmaS.KumarGlob. J. Sci. Front. Res. Phys. Space Sci.1320131
- H.KumarA.SharmaN.MehtaMater. Lett.1212014194197
- N.ChandelN.MehtaA.KumarSolid State Sci.132011257262
- N.ChandelN.MehtaA.KumarCurr. Appl. Phys.122012405412
- C.DohareN.MehtaA.KumarMater. Chem. Phys.1272011208
- C.DohareN.MehtaA.KumarPhase Transit.84201110641074
- J.C.GiuntiniJ.V.ZanchehaJ. Non-Cryst. Solids341982419
- S.R.ElliottPhilos. Mag.36197712911304
- S.R.ElliottAdv. Phys.361987135217
- N.ChoudharyA.KumarTurk. J. Phys.292005119125
- K.ShimkawaA.V.KolobovS.R.ElliottAdv. Phys.441995475588