
Abstract
Mg2+ and Zr4+ co-doped TiO2 was synthesized by sol–gel method. Catalysts were characterized by XRD, UV–vis DRS, SEM-EDX, TEM, BET, XPS and FT-IR to evaluate the crystal patterns and crystallite size (5.07–18.9 nm), bandgap energy, morphology, surface area, surface composition with oxidation states and incorporation of dopants into TiO2 lattice. Degradation of methylene blue was carried out under visible light irradiation by varying the reaction parameters such as initial dye concentration, catalyst loading and pH of the solution. 1.0 wt% Mg2+ and 0.25 wt% Zr4+ codoped TiO2 was found to be an efficient catalyst.
1 Introduction
From the time electrochemical splitting of water in presence of TiO2 assisted by light was reported, among semiconductor photocatalysts, nano crystalline TiO2 have attracted extensive interest as promising material in view of its applications in environmental pollution abatement and energy storage [Citation1 Citation2013;Citation6]. However, TiO2 is sensitive to only UV light due to its large band-gap energy (anatase: 3.2 eV), restricting its practical applications under visible light and also photogenerated electron–hole pairs get reduced by recombination process, enabling lower photocatalytic activity [Citation7]. In this context there is a necessity to reduce the band gap of TiO2 suitably sensitive to radiant solar energy which comprising only 3–4% of UV radiation.
In this regard, a great effort has been made to develop TiO2-based photocatalysts sensitive to visible light for the purpose of efficient utilization of solar energy such as metal and non-metal ion doping, semiconductor coupling and dye sensitization to improve the photocatalytic activity of TiO2 materials under visible light irradiation [Citation8 Citation2013;Citation10]. However, it must be noted that each of these methods has some drawbacks like limited surface area, less crystalline nature and low migration ability of the photo exited charge carriers under visible light [Citation11,Citation12]. Recently, it has been shown that codoping of titania with metals could be a beneficial solution for these problems [Citation13,Citation14]. Among various dopants studied so far, zirconium was regarded as one of the most promising metals due to its similar physicochemical properties with titanium [Citation15]. Derya Kapusuz etc. [Citation16] were synthesized boron and/or zirconium doped TiO2 and investigated the effects of doped TiO2 on photocatalytic activity and Sun Woo Kim etc. [Citation17] reported that co-doping of sulfur and zirconium improves the surface properties such as surface area, pore volume, and pore diameter and also enhances the thermal stability of the anatase phase. On the other hand, Changneng Zhang etc., investigated the effect of Mg2+ ions substituted into the anatase TiO2 lattice on the charge recombination and band-edge movement [Citation18] and Sofianou etc. reported Mg2+-doped anatase TiO2 nanocrystals synthesized by solvothermal method with exposed {0 0 1} facets and showed that there is an adsorption shift to visible light region and performing high photocatalytic property [Citation19]. Present study focused on synthesis of Mg2+ and Zr4+ co-doped TiO2 to improve the photocatalytic activity of TiO2. The more electro positive Mg2+ can favor the formation of less dense anatase phase TiO2 and Zirconium (Zr4+) having the same valence, approximately similar electronegativity and ionic radius to that of Ti4+. Hence, it can extend the light absorption towards visible region [Citation20,Citation21]. This combination can leads to improve the surface area, less band gap, reduce electron–hole recombination and improves migration ability of the photo exited charge carriers which favor high photocatalytic activity under visible light.
Contamination of water by textile dyes is one of the major environmental problem because of their persistence and potential toxicity [Citation22]. Since, Azo dyes are widely used in textiles and photographic industries are difficult to degrade by conventional techniques. Taking into consideration of the above problems an efficient utilization of solar energy and preparation of visible light responsive nanomaterial with appropriate crystal phase, particle size is needed. Therefore we proposed to synthesize Mg2+, Zr4+ co-doped TiO2 by sol–gel method with nanoparticle size, high surface area and visible light sensitivity. Moreover, in the literature review there has been no report on the synthesis as well as application of Mg2+, Zr4+ co-doped TiO2 as a visible light active photocatalyst. Later we have undertaken the characterization and evaluate the efficiency of the catalyst was determined by degradation of methylene blue as a model dye pollutant.
2 Experimental details
2.1 Materials
Titanium tetra-n-butoxide, (Ti(OBu)4) (E-Merck, Germany), Magnesium nitrate, (Mg(NO3)2) (E-Merck, Germany) and Zirconyl nitrate (ZrN2O7) (E-Merck, Germany) were used as Titanium, Magnesium and zirconium sources for preparing codoped nanomaterial. Methylene blue dye is used as a model dye pollutant for photodegradation. All the above mentioned chemicals are reagent grade and used as received without further purification. Double distilled water was used for the preparation of appropriate solutions.
2.2 Preparation of Mg2+ and Zr4+ co-doped TiO2 nanomaterial
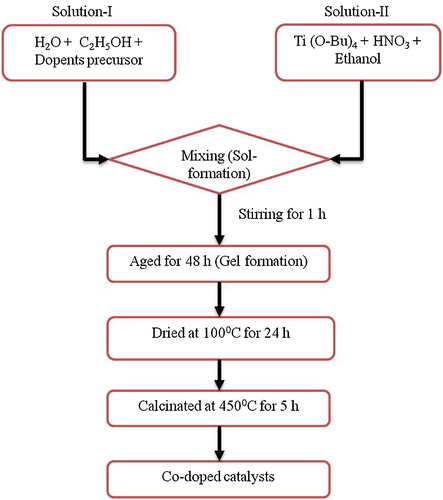
A sol–gel method [Citation23] was adopted to prepare codoped TiO2 catalyst. Initially solution-I containing 10 mL of absolute alcohol, 1.5 mL of H2O, and metal nitrates of Mg2+ and Zr4+ each 1–5 wt% are taken for the preparation of required percentages. Solution-II was prepared using 5.25 mL of Ti(O-Bu)4 dissolved in 10 mL of absolute alcohol stirred for 10 min, and then 0.75 mL of HNO3 was added drop wise under continuous stirring for 30 min. Solution-I was added to solution II slowly from the burette with vigorous stirring until the transparent sol was obtained, and the resulting sol was further stirred for 1 h. The gel was aging for 48 h at room temperature. The derived gel was dried at 100 °C in an oven and ground and calcined at 450 °C in muffle furnace for 2 h. Undoped TiO2 was also prepared with same procedure without adding the dopants metal nitrates and overall schematic process shown in . The prepared catalysts are labeled as B1–B8 and presented in .
Table 1 Shows crystallite size, band gap and BET surface area of the prepared co-doped catalysts.
Scheme 1 Schematic diagram of the sol–gel method for the preparation of the catalysts.
2.3 Instrumental techniques
The Diffuse reflectance spectra (DRS) of the samples were recorded with a Shimadzu 3600 UV–vis NIR Spectrophotometer equipped with an integrating sphere diffuse reflectance accessory, using BaSO4 as reference scatter. Powder samples were loaded into a quartz cell and spectra were recorded in the range of 200–900 nm. Crystalline structures of photocatalysts were determined by X-ray diffractometer (XRD) (Model Ultima IV, RIGAKU) using Anod Cu-WL1 (λ = 1.5406 nm) radiation with a nickel filter. The applied current and voltage were 40 mA and 40 kV, respectively. The 2θ scanning range was 5.000–90.9505 with a scan rate of 10.1600 s−1. The average crystallite size of anatase was determined according to the Scherrer equation using (FWHM) data of the selected peak. X-ray photoelectron spectroscopy (XPS) was recorded with a PHI quantum ESCA microprobe system, using the AlKα line of a 250 W X-ray tube as a radiation source with the energy of 1253.6 eV, 16 mA × 12.5 kV and a working pressure lower than 1 × 10⁻⁸ Nm−2. As an internal reference for the absolute binding energies, the C 1s peak of hydrocarbon contamination was used as reference to 284.8 eV. The fitting of XPS curves was analyzed with Multipak 6.0 A software. The morphology and size of particles was characterized using scanning electron microscope (SEM) (JSM-6610 LV) equipped with an energy dispersive X-ray (EDS) spectrophotometer and operated at 20 kV and transmission electron microscope (TEM) (TECNAI FE12 TEM) operated at 120 kV. Brunauer–Emmett–Teller (BET) surface area was determined from the N2 adsorption–desorption isotherm at 77.3 K by using a Quantachrome Nova 2200 E system. FT-IR spectra of the samples were recorded on a FT-IR spectrometer (Nicolot Avatar 360). The extent of RhB degradation was monitored using UV–vis spectrophotometer (Shimadzul 1601).
2.4 Photocatalytic activity measurements
An aqueous solution of methylene blue was chosen as a model dye compound to investigate the photocatalytic efficiency of prepared co-doped TiO2 at various parameters were carried out under self-regulating visible light instrument has been reported [Citation24]. A high pressure metal halide lamp (BAJAJ, METALUX MH 400W T) with UV filter has been used as a visible light source (output is 436–546 nm) with 35000 lm and placed 20 cm away from the photo reactor. For complete removal of UV radiation cut-off filter oriel (51 472) was placed in the path of light and running water was circulated around the sample container to filter IR radiation and to keep the reaction mixture at room temperature. A photocatalytic experiment was carried out using required amount of catalyst added to fresh 10 mg/L aqueous dye solution of required concentration in Pyrex glass vessel of 150 mL and the pH of the solution was adjusted by addition of 0.1N NaOH/0.1N HCl and tested with pH meter (Digital pH meter model 111E, EI). Earlier to irradiation solution with catalyst was stirred in closed dark box for 45 min for the establishment of adsorption–desorption equilibrium of methylene blue dye on catalyst surface. In every 30 min. of intervals 5 mL aliquots of the samples were withdrawn from the solution by using syringe with Millipore filter (0.45 μm) and analyzed for methylene blue dye concentration. The degradation percentage checked by measuring the absorbance of dye solution at 690 nm using a UV–vis (Milton-Roy Spectronic 1201) Spectrophotometer. The percentage degradation of the dye was calculated from the following equationWhere A0 is initial absorbance of dye solution before degradation and At is absorbance of dye solution at time t.
3 Results and discussion
3.1 Characterization of photocatalyst
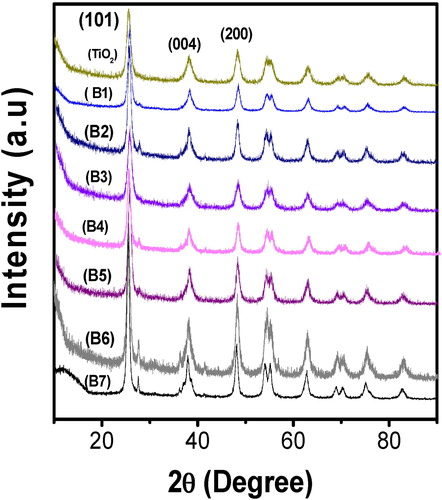
The XRD patterns of co-doped Mg2+, Zr4+-TiO2 nanomaterial and undoped titania prepared by sol–gel method are shown in . All the samples confirm the presence of anatase phase of titania (JCPDS No: 21-1272) with the corresponding (101) plane of high intensity for both undoped and doped nanomaterials indicating the existence of peaks at 25.3°, 37.9°, 48.05° and 54.1° of indices (101), (004), (200), (211) planes respectively. It is known that Mg2+ is more electro positive and the electronic cloud in each TiO2 might be loosely held, favoring the formation of less dense anatase phase [Citation25]. Further peaks belong to MgNO3, MgCO3 and ZrO2 were not detected, and this may be due to well dispersion of Mg2+ and Zr4+ content in TiO2 lattice. Due to the absence of above peaks it is assumed that Mg2+ and Zr4+ ions could easily enter into the lattice of TiO2 by replacing Ti4+ as substitutional dopants. This may be attributed that the ionic radii of Mg2+ (0.072 nm) and Zr4+ (0.072 nm) are closer to that of Ti4+ (0.0605 nm) [Citation26]. Further, this was evidenced by FT-IR spectral data. Moreover as large size and same valence nature of Zr4+, the lattice can exhibits a better stability than undoped TiO2 [Citation27]. On the other hand, when the dopants concentration changes in TiO2, small percentage of rutile phase also observed. This mixed phase can also enhance the photocatalytic activity of the catalyst [Citation28]. The crystallite size of the undoped and co-doped catalyst was calculated based on the full width at half maximum (FWHM) of the nanomaterial using Scherrer equation. An average crystallite size of the samples found to be ranging from 5.07 to 18.9 nm for co-doped and 20.3 nm for undoped TiO2 samples. When compared crystallite size of Zr4+, Mg2+ co-doped TiO2 with our previous studies of Zr–TiO2 and Mg–TiO2, The co-doped TiO2 exhibiting the less crystallite size without destruction of TiO2 lattice [Citation29,Citation30].
Fig. 1 XRD pattern of the synthesized undoped and co-doped TiO2 with different wt% of Mg2+ and Zr4+.
The UV-DRS spectra of prepared catalysts are shown in a. It was noted that, the co-doped TiO2 samples characteristic bands are in the rage of about 400–600 nm where as undoped TiO2 band at 380 nm. This indicates that, due to the doping of Mg2+ and Zr4+, the characteristic band of TiO2 completely shifted towards visible region (a). Moreover, these results indicated that there is a bond existed between the TiO2 and the dopants Mg2+ and Zr4+. The band gap energy (eV) of the samples were calculated using the formula BG = 1240/λ, where λ is the wavelength [Citation23]. The co-doped TiO2 exhibiting the band gap energy values in the range of about 2.56–3.03 eV and for undoped TiO2 is 3.19 eV. Among the co-doped catalysts, 1.0 wt% Mg2+ & 0.25 wt% Zr4+ co doped TiO2 shows 2.56 eV less band gap energy than the remaining catalysts. Moreover, it exhibits less band gap energy with extended visible light region when compared with our previous study of individual Zr–TiO2 and Mg–TiO2 [Citation29,Citation30]. In general the red shift indicates more photo generated electro/hole pairs that could be excited by photons with less energy leading to better photocatalytic degradation efficiency in the visible region.
Fig. 2 (a) The UV–vis. DRS spectra of undoped TiO2, and co-doped TiO2 with different wt% of Mg2+ and Zr4+ and (b) FT-IR spectra of undoped TiO2 and 1.0 wt% Mg2+ and 0.25 wt% Zr4+ co-doped TiO2.
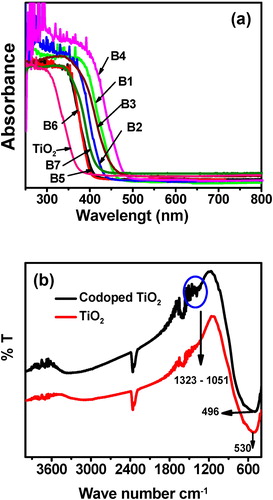
The incorporation of dopants Mg2+ and Zr4+ into TiO2 lattice was further supported with FT-IR results. b shows the FT-IR spectra of Mg2+ and Zr4+ co-doped TiO2 and undoped TiO2. The peaks at 3350–3450 and 1620–1635 cm−1 are corresponding to the stretching vibrations of O–H and bending vibrations of adsorbed water molecules respectively [Citation31]. The low intensity of the peaks below 1200 cm−1 is due to Ti–O–Ti vibration. The new peaks appeared at 1323–1015 cm−1 is due the isomorphic substitution of magnesium; it may be assigned as framework of Ti–O–Mg vibration [Citation32,Citation33]. Moreover, the stretching frequency band at 530 cm−1 can be assigned to Ti–O–Ti band in undoped TiO2 [Citation31]. This band is shifted to 496 cm−1 in the co-doped sample. This confirms that the presence of dopants in TiO2 lattice deforms the Ti–O–Ti network and forms the new interaction as a Ti–O–Zr and Ti–O–Mg.
The surface composition of Mg2+ and Zr4+ co-doped TiO2 samples was investigated by XPS. shows high resolution XPS spectra of Mg2+ and Zr4+ co-doped TiO2. The two peaks of Mg 2p to be 51.4 eV and 53.331 eV which is typical of Mg2+ that bonded to oxygen and assigned as MgO (c). The Zr 3d5/2 and Zr 3d3/2 peaks are absorbed with a binding energy of 178.250 eV and 181.250 eV respectively; this can be attributed to Zr4+ oxidation state (e). The binding energy of Ti 2p3/2 and Ti 2p1/2 components of co-doped TiO2 are located at 458.917 and 464.668 eV corresponding to the existence of Ti4+ state (f). The O1 s spectrum in d shows two peaks at 530.266 eV and 532.593 eV. The strong peak of 530.266 eV is attributed to lattice oxygen in Ti–O bonds and small peak around 532.593 eV is attributed to weakly physical adsorbed oxygen species such as O− and OH group on the surface [Citation34,Citation35]. Further, e shows the EDX analysis of the co-doped catalyst and it was reveal that the presence of all the respective elements with suitable composition. Based on these results the dopants Mg2+ and Zr4+ are completely incorporated in to TiO2 lattice with good interaction.
Fig. 3 (a) XPS survey spectrum of co-doped TiO2 (b) high resolution spectrum of C1s (c) Mg 3d (d) O1s (e) Zr 3d and (f) Ti 2p, respectively.

Fig. 4 SEM and TEM images of (a and c) undoped TiO2 and (b and d) 1.0 wt% of Mg2+ and 0.25 wt% Zr4+ co-doped TiO2 and (e) EDX spectrum of 1.0 wt% of Mg2+ and 0.25 wt% Zr4+ co-doped TiO2.
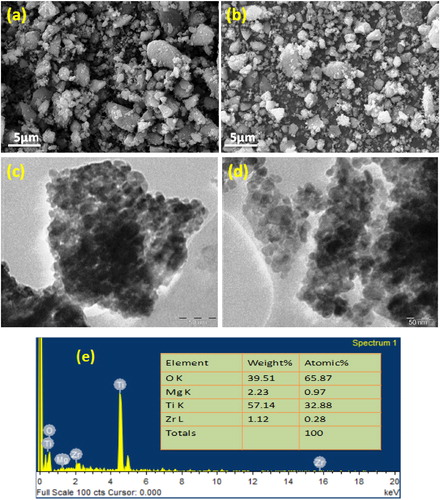
The morphology of the catalysts was studied by using the SEM and TEM analysis and the images of TiO2 and 1.0 wt% Mg2+ & 0.25 wt% Zr4+ co-doped TiO2 materials were shown in . The SEM images (a and c) of undoped TiO2 shows the agglomerated particles with uneven sizes where as co-doped TiO2 shows small and uniform particles size. This confirms that, due to the codoping of Mg2+ and Zr4+ into TiO2 lattice there may be controlling of particles with uniform size. The TEM images of co-doped and undoped TiO2 were shown in b and d. The TEM images of undoped TiO2 reveal that all the particles are in spherical shape in agglomerated form with particle size of about range 15–20 nm. On the other hand, the co-doped TiO2 shows that particles are in spherical form with particle size of about in the range 5–7 nm. All these results shows that, when the Mg2+ and Zr4+ incorporated into the TiO2 lattice, the particle size of TiO2 decreases and increases the surface area which leads to enhance the photocatalytic activity under visible light.
The results of BET surface area analysis was presented in , indicated that 1.0 wt% Mg2+ and 0.25 wt% Zr4+ codoped TiO2 shows high surface area. This is may be due to the enhanced lattice strain with two metal ions which causes decrease in grain growth rate [Citation36]. This reveals that increasing surface area favors increases in adsorption of the dye molecules on the surface of the catalyst leads to high degradation rate.
4 Photocatalytic activity of catalyst-degradation of methylene blue
In a controlled experiment, initially 150 mL of 10 mgL−1 solution of methylene blue dye and catalyst was taken in a beaker and kept it in dark for 45 min to attain the equilibrium between dye solution and catalyst surface. The same experimental procedure was followed in the presence of the visible light to study the photocatalytic activity of the catalyst by varying the following reaction parameters such as dopant concentration, pH of the solution, catalyst dosage and initial dye concentration.
4.1 Effect of dopant concentration on the degradation of MB
In order to find out the best dopant concentrations of the prepared catalysts experiments were carried out with catalysts having different dopant concentrations denoted as B1–B6 are shown in a. When comparison was made between co-doped and undoped TiO2, all the co-doped nanomaterials showed better photocatalytic activity under visible light irradiation [Citation37]. This is may be due to the narrowing band gap of TiO2, less crystallite size and high surface area which leads to adsorb more number of dye molecules (). Hence, from the synthesized nanomaterial 1.0 wt% Mg2+ & 0.25 wt% Zr4+ co-doped TiO2 has shown 99% of degradation in 150 min (a).
Fig. 5 (a) Effect of dopant concentration on photocatalytic activity of Mg2+ and Zr4+ co-doped TiO2 on the % degradation of MB. Here, catalyst dosage 0.1 g, pH 8 and [MB] = 10 mgL−1. (b) Effect of pH on the % degradation of MB by 1.0 wt % Mg2+ and 0.25 wt% Zr4+ co-doped TiO2. Here, catalyst dosage = 0.1 g and [MB] = 10 mgL−1.
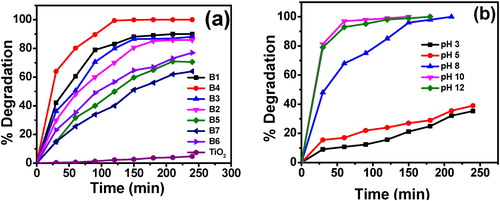
4.2 Effect of solution pH
The effect of pH on percentage degradation of methylene blue was carried out at different pH values (3, 5, 8, 10 and 12) as a function of time and the other parameters kept constant. From b it was observed that the percentage of degradation of MB was high at pH 10. At this pH catalyst surface is negative, hence the positive charged MB dye can easily adsorbed on the catalyst surface due to electrostatic interaction which leads to high percentage of MB degradation [Citation38]. But, at acidic pH the electrostatic repulsions between the dye and the catalyst surface due to both of them are having positive charge leads to low percentage of degradation of MB [Citation39].
4.3 Effect of catalyst dosage
To obtain optimum catalyst dosage experiments were conducted by varying the concentration of the catalyst ranging from 0.025 to 0.3 g by keeping other parameters constant. The results presented in a shows that with increase in catalyst dosage increases the more number of particles available favors the adsorption of more number of dye molecules causes the increase in degradation of MB [Citation40]. Further increase in the catalyst dosage the rate of degradation of MB decreases due to increasing the turbidity of solution which restricts the penetration of the visible light to activate the catalyst particles [Citation41]. From a it was observed that 0.1 g is the optimum catalyst dosage.
Fig. 6 (a) Effect of catalyst dosage on % degradation of MB by 1.0 wt% Mg2+ and 0.25 wt% Zr4+ co-doped TiO2. Here, pH 10 and [MB] = 10 mgL−1. (b) Effect of initial concentration of dye on % degradation of MB. Here, pH 10, catalyst dosage = 0.1 g.
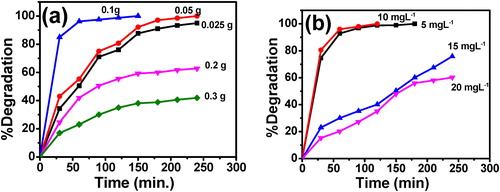
4.4 Effect of methylene blue initial concentration
At pH 10, 0.1 g of catalyst dosage and varying the initial dye concentration from 5 mg to 20 mg per litre was carried out and results were presented in b. b shows that the rate of degradation of MB increases upto 10 mgL−1 and later on decreases. This is may be due to blanket effect [Citation6] which causes the decrease in the generation of OH radicals. Therefore the optimum concentration of MB was confirmed at 10 mgL−1.
Among the different photocatalysts, 1.0 wt% Mg2+ & 0.25 wt% Zr4+ co-doped TiO2(B4) exhibits high photcatalytic activity at pH 10, 0.1 g catalyst dosage and 10 mgL−1 dye concentration. These results are strongly supported the high surface area () of the catalyst B4 than remaining catalysts which leads to adsorbe more number of the dye molecules on its surface. Moreover, the catalyst B4 having the less crystallite size than remaining catalysts, it is because of doping of Mg2+ and Zr4+ into TiO2 lattice. On the other hand, when dopants are incorporated into the TiO2 lattice, the band gap of catalyst B4 decreases and photo activity of the catalyst increases in visible light.
5 Possible mechanism
Based on the experimental results, the possible mechanism for the degradation of MB dye using 1.0 wt% Mg2+ and 0.25 wt% Zr4+ co-doped TiO2 is as follows.
i) Electrons are ejected from the valence band to the conduction band upon visible light illumination of a photocatalyst, keeping positive holes in the valence band and electrons in conduction band.
ii) The electrons in conduction band of the co-doped TiO2 can trapped by the dopants Zr4+ and Mg2+, their by holding up the recombination process of electrons and holes.
iii) The trapped electrons can be further scavenged by the molecular oxygen, which is adsorbed on the TiO2 surface, to generate superoxide radical, and this in turn produces hydrogen peroxide (H2O2), hydroperoxy (HO2•) and hydroxyl (•OH) radicals.
iv) Finally the electrons can acts as good reducing agents and holes can acts as oxidizing agents for degradation of dye in the solution. Therefore, MB is attacked by hydroxyl radicals formed mutually by trapped electrons and hole in the VB and generate organic radicals or other intermediates, which further undergo degradation.
By increasing the additive amounts of Zr4+ and Mg2+ dopants into TiO2, they may be enter into the inner core of the TiO2 lattice. Hence, there is no peak observed corresponding to ZrO2 and MgO in XRD pattern ().
6 Conclusions
A series of Mg2+ and Zr4+ co-doped TiO2 nanomaterials with high photocatalytic activity were successfully synthesized by a sol–gel method and found to be 1.0 wt% Mg2+ and 0.25 wt% Zr4+ co-doped TiO2 nanomaterial shows higher photocatalytic activity than undoped TiO2. The presence of Mg2+ and Zr4+ into the lattice of TiO2 confirmed by FTIR spectroscopic technique. The incorporation of Mg2+ and Zr4+ in to TiO2 leads to small grain size, large surface area and less band gap values were confirmed by XRD, BET, UV–vis DRS respectively. This brings to form more electron capture traps, which contribute to high separation efficiency of photo generated carriers. Finally, the 1.0 wt% Mg2+ and 0.25 wt% Zr4+ co-doped TiO2 exhibiting the high photocatalytic activity for the degradation of 10 mgL−1 MB at pH 10 with 0.1 g catalyst weight.
Acknowledgments
Thankful to University of Gondar (UOG), Government of Ethiopia and Advanced Analytical Laboratory, DST-PURSE Programme, Andhra University for their support in carrying out in this research work regarding SEM-EDX, FT-IR, XRD analysis. Sreedhar Boja (IICT-Hyderabad) for their support in carrying out in this research work regarding TEM, XPS, UV–vis DRS analysis.
References
- W.K.WangJ.J.ChenM.GaoY.X.HuangX.ZhangH.Q.YuAppl. Catal. B: Environ.19520166976
- A.AjmalI.MajeedR.N.MalikH.IdrissM.A.NadeemRSC Adv.420143700337026
- H.S.KibomboR.PengS.RasalingamR.T.KoodaliCatal. Sci. Technol.2201217371766
- S.SarkarR.DasH.ChoiC.BhattacharjeeRSC Adv.420145725057266
- S.A.AnsariM.M.KhanM.O.AnsariM.H.ChoNew J. Chem.40201630003009
- M.C.RaviT.R.SivaS.V.N.PammiB.SreedharMater. Sci. Semicond. Process.302015672681
- A.MattssonC.LejonS.BakardjievV.StenglL.SterlundJ. Solid State Chem.1992013212223
- H.TangS.ChangK.WuG.TangY.FuQ.LiuX.YangRSC Adv.620166311763130
- M.GuoRSC Adv.52015434439
- N.KaurS.K.ShahiV.SinghRSC Adv.520156162361630
- S.G.KumarL.G.DeviJ. Phys. Chem. A11520111321113241
- H.DongG.ZengL.TangC.FanC.ZhangX.HeY.HeWater Res.792015128146
- H.ParkY.ParkW.KimW.ChoJ. Photochem. Photobiol. C: Photochem. Rev.152013120
- V.EtacheriC.D.ValentinJ.SchneiderD.BahnemannS.C.PillaiJ. Photochem. Photobiol. C: Photochem. Rev.252015129
- X.Z.ShenJ.GuoZ.C.LiuS.M.XieAppl. Surf. Sci.254200847264731
- D.KapusuzJ.ParkA.OzturkJ. Phys. Chem. Solids74201310261031
- S.W.KimR.KhanT.J.KimW.J.KimBull. Korean Chem. Soc.29200812171223
- C.ZhangS.ChenL.MoY.HuangH.TianL.HuZ.HuoS.DaiF.KongX.PanJ. Phys. Chem. C11520111641816424
- M.V.SofianouM.TassiN.BoukosS.ThanosT.VaimakisJ.YuC.TrapalisCatal. Today2302014125130
- B.M.ReddyA.KhanCatal. Rev.: Sci. Eng.472005257296
- C.WangA.GengY.GuoS.JiangX.QuL.LiJ. Colloid Interface Sci.3012006236247
- D.HosseiniF.S.AsghariH.YoshidProc. World Congress on Engineering and Computer ScienceOct. 20–22, San Francisco, USA20098284
- L.C.ZhangK.F.CaiX.YaoJ. Electroceram.212008512515
- J.C.S.WuC.H.ChenJ. Photochem. Photobiol. A: Chem.1632004509515
- N.VenkatachalamM.PalanichamyV.MurugesanJ. Mol. Catal. A: Chem.2732007177185
- N.I.Al-SalimS.A.BagshawA.BittarT.KemmittM.A.JamesA.M.MillsM.J.RyanJ. Mater. Chem.10200023582363
- N.VenkatachalamM.PalanichamyB.ArabindooV.MurugesanJ. Mol. Catal. A: Chem.2662007158165
- D.KapusuzJ.ParkA.OzturkJ. Phys. Chem. Solids74201310261031
- T.Siva RaoT.B.SegneT.SusmithaA.B.KiranC.SubrahmanyamAdv. Mater. Sci. Eng.2012201219
- N.PrabhakarraoM.Ravi ChandraT.Siva RaoJ. Alloys Compd.6942017596606
- M.Ravi ChandraT.Siva RaoChin. J. Catal.36201516681677
- H.ZhangJ.ShiX.XuL.ZhuY.LuoD.LiQ.MengJ. Mater. Chem. A420161538315389
- K.MansekiT.IkeyaA.TamuraT.BanT.SugiuraT.YoshidaRSC Adv.4201496529655
- Y.N.TanC.L.WongA.R.MohamedISRN Mater. Sci.182011118
- C.FengY.WangJ.ZhangL.YuD.LiJ.YangZ.ZhangAppl. Catal. Environ.11320126171
- X.YangC.CaoL.EricksonK.HohnR.MaghirangK.KlabundeAppl. Catal. B: Environ.912009657
- C.H.WeiX.H.TangJ.R.LiangS.TanJ. Environ. Sci.1920079096
- M.A.FoxM.T.DulayChem. Rev.9311993341357
- L.B.ReutergarthM.IangpashukChemosphere351997585596
- I.K.KonstantinouT.A.AlbanisAppl. Catal. B: Environ.492004114
- S.LiuJ.H.YangJ.H.ChoyJ. Photochem. Photobiol. A: Chem.17920067580