Abstract
In regions with warm and hot climates as is the case of several countries of the Mediterranean basin, it is interesting to study the energy balance inside a greenhouse and to quantify the heat transfers along the building components (roof, walls and ground) in winter and during night time. The present experimental work was conducted in an unheated glasshouse without crop in the region of Batna, Algeria. Three types of measurements were done from January to March: the first one is at a cloudy night; the second one at a windy night and the third one at a cloudless night. The results indicate that the greenhouse ground is considered as a significant heat source which can compensate the energy losses through the walls especially during a night preceded by a significant diurnal insulation. In addition, the convection heat transfer coefficients inside and outside the greenhouse were estimated and analysed. A good agreement with the models reported in the literature was found.
1 Introduction
The microclimate parameters inside a greenhouse, not only influence the growth of vegetation, but can also be critical factors affecting the spread of epidemics inside the crops. The energy balance of greenhouse has been described for more than 40 years, in the pioneering works of Businger (Citation1963) and Walker (Citation1965)". Later on, several models of the energy balance have been developed in order to understand the relationship between the outdoor and indoor microclimates and to characterize the mean behaviour of particular elements in the greenhouse, such as the inside air, the surrounding environment, and the shape and the greenhouse cover (Kimbal, Citation1973; Bot, Citation1983; Nijskens et al., Citation1984; Joliet, Citation1991; Zhang and Margolin, Citation1997"). Other studies have analysed the thermal energy of greenhouses equipped with a heating system (de Halleux, Citation1989), or investigated the processes of heat exchange (Kittas, Citation1986; Papadakis et al., Citation1992"). Although most of these works produced reasonable estimations of heat transfers, very few models have been used in practice for predicting greenhouse microclimate over long continuous periods, and under semi-arid conditions. Recently, Singh et al. (Citation2006) developed an algebraic model and implemented a data-processing code, in order to simulate the micro climate of a greenhouse located in a hot and dry climate zone. Impron et al. (Citation2007) established a dynamic model to be used as a design tool of greenhouses in tropical lowlands. The characterization of the energy balance of the greenhouses for each bioclimatic zone of the world becomes fundamental in order to evaluate the greenhouse feasibility, to improve its microclimate control (management and profitability), and to assess the effects of the latitude on the growth. During the last two decades, the use of greenhouses in Algeria has gradually emigrated from the littoral zones towards the South of the country which is characterized by high winter insulation, varying from 10.5 to 14 h/day between October and March. The region of Batna is characterized by cold and dry winters, with average minimal temperatures between −5 and 2 °C during the night periods of January and March, and with low levels of moisture. These two factors may negatively affect the quality and the quantity of crops. To our knowledge, very few studies on the energy balance of greenhouses set up in the arid and semi-arid area of the Southern Mediterranean basin have been carried out (Mesmoudi et al., Citation2008), and little attention was paid to the analysis of the heating efficiency of these greenhouses. It is, therefore, relevant to investigate the night energy balance of a greenhouse under arid or semi-arid conditions during the winter season.
Within this context, the objectives of the present study were: (i) to quantify the night heat transfers of a greenhouse, by performing a comprehensive analysis of the energy balance components of the shelter; (ii) to estimate the energy losses of the greenhouse; (iii) to evaluate the energy effectiveness of the ground; and (iv) to investigate the feasibility of a greenhouse deprived of any heating system under these specific climatic conditions. To reach these objectives, an experimental greenhouse was equipped with a set of probes in order to measure the different components of the energy balance. From the experimental results, the magnitude of the energy flux and heat transfer coefficients were obtained, and compared with the results from the literature.
2 Materials and methods
2.1 Site, greenhouse description, and measurements
The experimentation was carried out in a closed glasshouse of 32 m2 surface area, without any crop and deprived of any artificial heating system. The experimental device was located at the department of agronomy of the University of Batna (6°11′ East, 35°33′ North). The greenhouse was a standard 4 m wide Venlo type glasshouse (3.60 m high under ridge and 3.20 m high under gutter), with a global volume of 92.75 m3 (). It was orientated East–West. The greenhouse was built with metallic frames and was covered with a horticultural glass of 4 mm thickness.
Table 1 Geometrical characteristics of the greenhouse components.
The average spectral properties of the glass, provided by the manufacturer, are reported in . The analysis of the ground of the greenhouse to a depth of 50 cm reveals the following results: 30.62% of clay, 25.60% of fine silt, 17.13% of coarse silt, 15.41% of fine sand, and 11.24% of coarse sand. The ground density and thermal conductivity were measured for sample locally collected, whereas its spectral properties () were inferred from the study carried out by Capderou (Citation1985). For the three periods of measurement, the ground of the greenhouse was bare; however, evaporation was present, which was confirmed by the analysis of the energy balance on the surface of the ground and on the interior air. The main source of the water vapour was the quantity of water contained in the ground (21.57%).
Table 2 Thermal and spectral characteristics of the greenhouse components.
provides a schematic view of the facility and shows the different probes used to measure the temperature and the relative humidity. All the measurement points are distributed along a cross-section at the centre of the greenhouse in the same vertical plane, and at different heights. The temperature and relative humidity of the air (interior air and surrounding air) were recorded by means of a data logger (OAKTON Logger Plus) which is a system of remote measurements. This system consists of six thermohygrometers, six transmitters and a recording box. The temperatures of the solid surfaces (surface ground, underground and walls surface of the cover) were measured every 2 s with thermocouples, and then averaged over 30 min periods. All the above-mentioned measurements were collected on a data logger system (Campbell Scientific Micro logger, CR3000). The outside climatic conditions were measured by a weather station. The energy balances of the components of the greenhouse have been established for three measurement series: the first was from 24 to 25 January 2007 and is representative of the cloudy night; the second was from 20 to 21 February 2007 and is representative of the windy night; the third was from 17 to 18 March 2007 and is representative of the cloudless night. The climatic conditions observed during the three periods of experimentation are reported in .
Figure 1 Experimental setup view (lengths in meter): humidity and temperature sensors (![]()
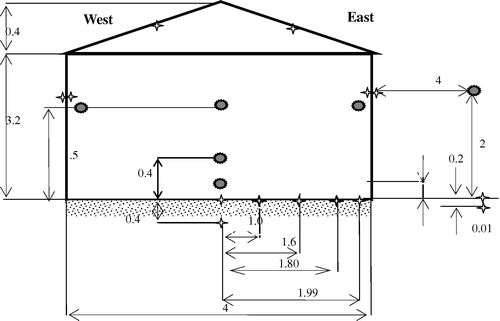
Table 3 Energy balance components values of the greenhouse ground surface.
2.2 Greenhouse energy balance
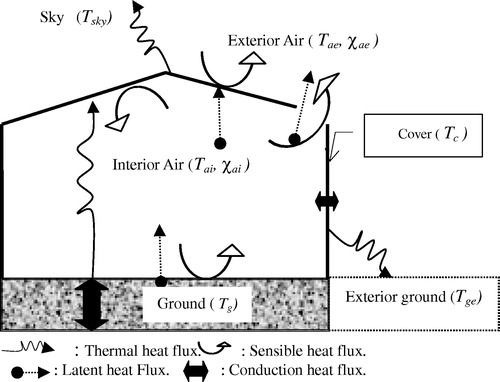
The energy balance analysis was carried out only during the periods of stable climatic conditions when the heat flux and the state variables were relatively stationary. Over a 30 min period, the variations of the radiation and the conduction of heat fluxes were lower than ±2.02 W m−2, and the variations of the recorded temperatures were lower than ±0.42 K. Under these conditions which could be considered as stationary, the energy balance of each component was calculated. By convention, the direction of each term of the equations described below is negative away from the surface, and positive towards the surface of the component. depicts the different heat fluxes exchanged between the elements of the greenhouse and with the outside environment.
Figure 2 Greenhouse physic model and energy balance.
The energy balance for each component of the greenhouse may then be established. In this section, all heat fluxes are expressed per m2 of ground surface in W m−2.
2.3 Soil surface energy balance
The surface ground energy balance of the greenhouse under steady state conditions is described by the equation(1) where
is the net radiation heat flux emanating from the ground surface of the greenhouse.
is the latent heat flux associated with the evaporation of the ground surface. It is deduced from the latent heat balance on the interior air (Eq. Equation(4)
(4) ). The conduction heat flux between two layers corresponding to the surface of the bare soil and of the layer located at 40 cm above the surface inside the ground
. The convective heat flux exchanged between the ground surface and the interior air
is given directly from a residual calculation of Eq. Equation(1)
(1) and from the coefficient of heat transfer by convection between the ground surface and the interior air hgai (W m−2 K−1) inferred from Eq. Equation(2)
(2)
(2) where Tai is the temperature of the interior air and Tg is the temperature of the ground surface in K.
2.4 Interior air energy balance
Assuming that the infra-red radiations are not absorbed by the air, only the convective and latent exchanges are considered, two interdependent equations may then be written: the sensible and the mass energy balance of the greenhouse air volume, which may be expressed as:(3)
(4) where
is the convective heat flux exchanged between the interior air and the interior wall surface of the cover, and
is the sensible heat flux due to the leakage losses through the structure of the greenhouse.
is the leakage losses of enthalpy, and
is the latent heat flux of condensation on the interior wall of the cover. The sensible and latent heat fluxes
and
due to the leakage losses, are calculated using the temperatures of the relative humidity measured in the air (interior and exterior) according to the formula provided by Fernandez and Bailey (Citation1992) (Eqs. Equation(5)
(5) and Equation(6)
(6) ):
(5)
(6)
(7) where ρa is the density of the air (kg m−3), V, the volume of the greenhouse (m−3), Ca is the mean specific heat of the air and is equal to 1004 J kg−1 K−1, T
ae, the temperature of the surrounding air (K), χai, the absolute humidity of the air inside the greenhouse, and χae, the absolute humidity of the air outside the greenhouse
. Lv is the latent heat of vaporization of water (J kg−1). The renewal rate of the air
is given as a function of the wind speed U
e (m s−1) and the temperature gradient (∆Taiae = Tai − Tae
). The latent heat flux of condensation on the interior wall of the cover
is calculated from the condensed water vapour flux ϕvap using Eq. Equation(7)
(7) . The sensible heat flux exchanged between the interior air and the interior wall of the cover
is then deducted from Eq. Equation(3)
(3) . The coefficient of heat transfer by convection haici between the interior air and the interior wall is given according to:
(8) where Tci is the temperature of the interior wall of the cover, and Sg, Sc are, respectively, the surfaces of the ground and cover (m2).
2.5 Energy balance of the cover
Because of the absence of condensation on the external wall of the glazing during the three periods of measurements, this phenomenon was neglected in the calculation of the energy balance of the outside wall of the cover (Eq. Equation(10)(10) ). Thus the heat balance on both the internal and the external surfaces of the walls, under steady state conditions, are governed by Eqs. Equation(9)
(9) and Equation(10)
(10) , respectively:
(9)
(10) These two equations include new parameters: the flux of conduction through the cover
, and the infra-red radiation heat fluxes on both faces of the cover, namely
and
. These three heat fluxes are calculated, respectively, by Eqs. (A2), (A14) and (A15) provided in the Appendix, using the measured temperatures, the thermophysical characteristics of the components, and the geometrical characteristics of the greenhouse (). The convective heat flux exchanged between the outside wall of the cover and the surrounding air
is then inferred directly from Eq. Equation(10)
(10) . The coefficient of exchange by convection hceae between the exterior wall surface of the cover and the surrounding air is calculated using Eq. Equation(11)
(11) below, where Tci is the temperature of the exterior wall of the cover:
(11)
3 Analysis and discussion of the results
All reported results are based on data collected in the greenhouse (with reference cover and geometry) during one growing season, from October 2007 to March 2008 with indoor climate as summarised in – .
3.1 Soil surface energy balance
The average values of the components of the energy balance of the ground surface described by Eq. Equation(1)(1) are represented in for the three nights of experimentation.
3.2 Conduction inside the greenhouse ground
During the three periods, the conduction of heat flux through the surface ground was ascending (positive), so the sand layer was transferring heat upwards, and the heat accumulated in the soil was released to the greenhouse during night time. This process can compensate the radiation losses of the surface ground, which represented the principal heat losses of this component ().
During the first night for instance, with a mean positive flux of 44.03 W m−2, was supplying enough energy to compensate the radiative losses, which represented the main loss component 28.09 W m−2.
The heat fluxes and
were small at that time (about 8 W m−2) and of opposite sign. In most studies of the energy balance of greenhouses, the values of
were assumed to be relatively small and thus neglected. According to Roy et al. (Citation2002), the contribution of the heat conduction flux of the soil may be considered as negligible in cases where the ground of the greenhouse is largely shaded by vegetation, or in greenhouses equipped with a heating system. On the contrary, in unheated greenhouse or those with low leaf area crops, the soil energy storage and release over 24 h period are far from being negligible. Considering a moderately heated greenhouse, Baille et al. (Citation2006) have shown that the contribution of the soil represented approximately 40% of the heating input, compared to only 15% in the case of a high input level of heat. In our case – an unheated and closed greenhouse with bare soil – the average values of the conduction flux for the three periods correspond to an energy release from the ground of 44.03, 42.23, and 38.7 W m−2, respectively, which is equivalent to an energy release from the soil during a 12-h night of: 1.63, 1.56 and 1.47 MJ m−2. These results are twice the energy release (daily energy stored in the soil and released to the greenhouse interior air during the night time) found by Baille et al. (Citation1985) and by Baille (Citation1999) for greenhouses with tomato crops under temperate climatic conditions. The results obtained in the present study are not surprising given the climatic conditions of semi-arid regions which are characterized by high winter insulation. Moreover, the experimental results show that the soil storage represents between 20% and 25% of the captured solar energy, in agreement with the conclusions of Joliet (Citation1991) who observed that the energy stored in the soil was proportional to the solar radiation contribution.
3.3 Convective heat exchange at the interface soil surface and the interior air
For the three nights of measurement, the temperature gradient values ∆Tgai are rather low (±1 K), by contrast the average values of the coefficient hgai are rather high (mean value 7.2 W m−2
K−1). This coefficient remains negative, which means that the greenhouse ground provides heat to the interior air. Plotting the hgai
values versus the temperature gradient ∆Tgai,
, shows that hgai varied within a lower and an upper limit, corresponding respectively to the models proposed by Lamrani et al. (Citation2001) for a greenhouse equipped with heated soil system, and by Silva (Citation1988)
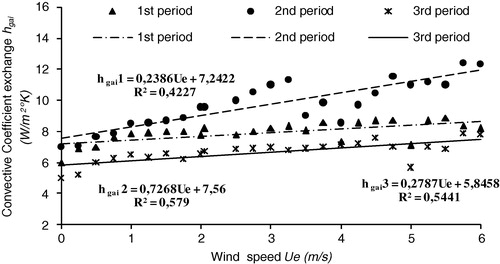
for an unheated plastic greenhouse with bare soil. The standard deviation of hgai (±1.85 W m−2 K−1) may be ascribed to the experimental errors and to the models used for the determination of the radiation fluxes. Another factor to explain this variability could be the influence of the wind velocity on the air flow inside the greenhouse. The h
gai variation versus the wind speed Ue
(
) is almost linear with a coefficient of determination R
2 within the range [0.42–0.72]. hgai appears to be also a function of the wind speed even inside the greenhouse, which suggests that hgai could be also governed by forced convection. For practical applications, the average value of hgai (=7.2 W m−2
K−1) could be considered as a reasonable estimate in the case of an unheated greenhouse located in an area belonging to a semi-arid zone.
Figure 3 Convection exchange coefficient values at the surface of the soil according to the temperature gradient during the three measurement periods compared with the models of Silva (Citation1988) and Lamrani et al. (Citation2001)".
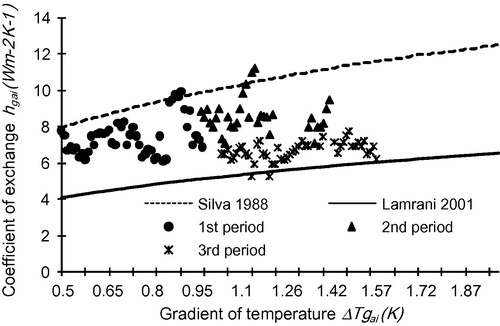
Figure 4 Convection exchange coefficient between the surface of the sheltered ground and the interior air of the greenhouse as a function of the wind speed during the three periods of measurement.
3.4 Interior air energy balance
presents the average values of heat fluxes which appear in the energy balance of the interior air during the three periods of measurements. shows the coefficient variation haici versus the temperature gradient ∆Taic and the results of the empirical models proposed by Tantau (Citation1975) cited by Roy et al. (Citation2002), Kittas (Citation1986), and Garzoli and Blackwell (Citation1987)".
Figure 5 Convective coefficient as a function of the temperature gradient ∆T aici during the three measurement periods and comparison with the models of Tantau (Citation1975), Kittas (Citation1986) and Garzoli and Blackwell (Citation1987)".
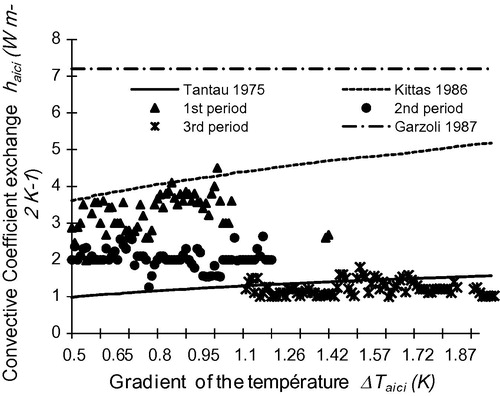
Table 4 Energy balance components values of the interior air.
For the first period (January 24th) the coefficient haici approaches the value obtained from the model of Kittas (Citation1986) (haici = 4.3∆T 0.25) while for the two other periods (February 21st and March 18th) h aici is almost similar to that deduced from the model of Tantau (Citation1975) (h aici = 1.247∆T 0.33). It should be pointed out that the convective exchange coefficient h aici depends on several factors especially on the heating system type and on the greenhouse roof slope. In the present study, all the observations lead to relatively haici low values. This may be due to the turbulence absence in our case (unheated and closed glasshouse), whereas in the work of Kittas (Citation1986)), who considered a greenhouse heated by hot pulsated air, relatively high values of haici were reported. de Halleux (Citation1989) reported similar observations from experiments carried out in a greenhouse heated by heating pipes.
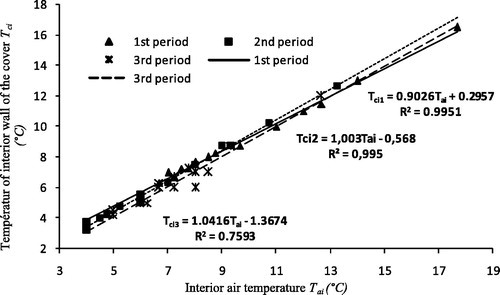
Low values of haici may thus be due to the absence of heating equipments which, if present, could enhance air movement inside the greenhouse and cause mixing and turbulence. It is well known that the air movement induced by a heating system and by the associated convection mode plays a major role in determining the convection exchange coefficient. In addition, it should be noted that positive linear correlations were found between the values of T ai and Tci ( ) with slopes near unity for all datasets (R 2 = 0.95 for the two first periods). This implies that the heating mode in the greenhouse (i.e., heat release by the ground) causes a proportional change between the two temperatures, i.e., a variation of Tci practically resulted in the same variation of Tai.
Figure 6 Temperature variations at the interior wall according to the interior air temperature Tai during the three periods of measurement and the corresponding linear fit.
3.5 Energy balance on the cover
provides the average values of the components of the energy balance of the interior and exterior walls of the greenhouse during the three periods, together with the corresponding values of ∆Tceae and outer cover-to-air heat transfer coefficient hceae.
Table 5 Energy balance components values of the cover two walls.
3.6 Convective exchange between the cover and the outside air
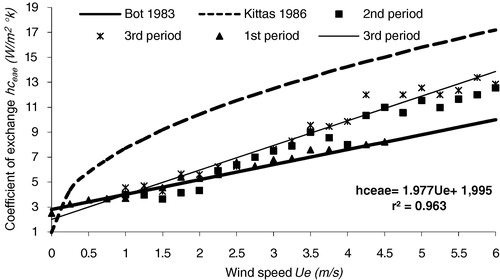
The average value of the coefficient hceae is 4.15 ± 1.03 W m−2
K−1. For two periods (1st night and 2nd night) the coefficient hceae is in agreement with the model proposed by Bot (Citation1983) (hceae
= 2.8 + 1.2Ue), but seems underestimated compared to the model of Kittas (Citation1986) . It can be ascribed in part to the convective heat exchange which is generally considered to be forced and mainly influenced by the external wind speed Ue along the outside surface of the cover. A good correlation was found (R
2
= 0.946) between the variation of the coefficient hceae and the wind speed, for the three periods of measurement (
). For the third night, the temperature gradient ∆Tceae
is the highest compared to the two preceding periods. It varies between −1.69 ± 0.33 K. The corresponding heat transfer coefficient hceae has a value of 5.47 ± 1.70 W m−2
K−1 corresponding to a convective heat flux
W m−2, which is positive for the three quarters of the period (the cover was cooler than the outside air and, therefore, was gaining heat). This process is known as the inversion phenomenon and has been reported to occur rather frequently for unheated greenhouses during calm and cloudless nights (Montero et al., Citation1985; Papadakis et al., Citation1992"). Under such conditions, the radiation losses through the cover are very high and the cover temperature may drop several degrees below the outside air temperature.
Figure 7 Heat transfer coefficient as a function of the wind speed. Comparison with the models suggested by Bot (Citation1983)and Kittas (Citation1986)" for a fixed gradient of temperature ∆Tceae = 1.5 K.
3.7 Radiative exchanges at the cover
The interior wall receives thermal energy from the inside air by the convective and latent heat fluxes and
and from the greenhouse soil by the radiative heat flux emitted by the soil surface. For the three periods of measurement, the net heat flux radiation on the interior wall
was positive () and represented the main part of the heat supply to the wall, which was twice higher than the sum of convective and latent heat fluxes. The reverse was also true for the outside wall, where a predominance of the radiation losses was clear. For the first period, the net radiation on the outside wall
was negative and lower than the flux of conduction coming from the internal face. For the second period (windy night, February 21st, 2007), the same trend was observed and the net radiation
still contributed to the major part of the wall energy losses.
The net radiation on the outside wall reached a high negative value compared with the heat gain
and
especially during the night of March 19th, 2007. This phenomenon frequently happens during nights with cloudless sky. For the three periods, the predominance of the outside wall radiative losses was, therefore, clearly established. Their intensity, however, decreases with the nebulosity of the sky and the period of sunset which just proceed the night period. These results are in agreement with those of Mesmoudi et al. (Citation2008) who reported a positive contribution of the low nebulosity of the sky on the decrease/decay of the wall radiative losses.
It is clear that the heat losses mainly include the radiation losses through the external wall surface of the cover (≈50 W m−2) for a cloudless night and the sensible losses along this wall (≈20.29 W m−2). The radiative heat exchange on the inner wall represented the main heat supply to this wall and found to be two times higher than the sum of convective and latent heat fluxes exchanged with the interior air. Inside the greenhouse the energy exchange mainly occurred between the air and the ground. The latent losses were low and the losses by leakages were proportional to the wind velocity and temperature gradient (inside–outside). For the three periods of measurements the energy balance at the soil–air interface showed that the soil heat flux provided most of the energy to compensate for the radiative ground losses (≈44, ≈42, and ≈38 W m−2). In the greenhouse air volume, energy losses mainly occurred through air-inner wall of the cover convective and latent exchange (≈8.14, ≈5.52, and ≈9.49 W m−2). At the outer wall of the cover, losses mostly occurred by radiative exchange (≈16.25, ≈22.68, and ≈53.11 W m−2).
4 Conclusions
The present study, based on experiments conducted in Batna, Algeria, provides a methodology to analyse the thermal behaviour of greenhouses installed in areas characterized by semi-arid climate of the southern Mediterranean basin. Moreover, this work can be regarded as a useful contribution to the comprehension of the energy balance of the unheated greenhouses. Concerning these aspects, the following results could be pointed out:
| 1. | The greenhouse soil is an important heat source during the night time. It can provide up to approximately (44.03 W m−2) in the case of a night preceded by a significant diurnal insulation. Compared with an artificial heating system, approximately 78 W m−2, would be necessary under similar outside climatic conditions to maintain the temperature of the air inside the greenhouse between 15 and 18 °C. | ||||
| 2. | The estimation of convection exchange coefficients between the components of the greenhouse are in agreement with the models reported in the literature. The convection mode inside the greenhouse induced by the type of heating system seems to play a significant role in the determination of the convective exchange coefficient. | ||||
| 3. | The radiation losses are the main components of the greenhouse energy losses, mainly for the cover outside wall. This phenomenon is enhanced when the sky is relatively clear (low nebulosity). | ||||
Concerning the feasibility of building greenhouses and their extension in the area, the following conclusions may be drawn: (i) since the process of thermal exchanges is dominated by the dissipation of heat through the cover, the implementation of heat shields, or the use of covers (plastic, glass) with a low thermal emissivity could generate substantial economies; (ii) the losses by leakage could be overcome by increasing the air tightness of the structure of the greenhouse; (iii) the ground of the greenhouse is a significant source of heat in Mediterranean countries which could be extracted and stored for other applications. This solution could increase significantly the thermal efficiency of the greenhouses in strongly sunny areas.
Related Research Data
References
- A.BailleEnergy cycleH.Z.EnochG.StanhillEcosystems of the World 20 Greenhouse Ecosystems1999ElsevierAmsterdam265286 (Chapter 12)
- A.BailleF.AriesM.BailleInfluence of thermal screen optical properties on heat lossesand microclimate of greenhousesActa Horticulturae1741985111118
- A.BailleJ.C.LopezS.BonachelaM.M.Gonzalez-RealJ.I.MonteroNight energy balance in a heated low-cost plastic greenhouseAgricultural and Forest Meteorology1372006107118
- Bot, G.P.A., 1983. Greenhouse climate: from physical processes to a dynamic model. Ph.D. Thesis, Wageningen Agricultural University, The Netherlands.
- J.A.BusingerThe glasshouse climatePhysics of Plants Environment1963North-Holland Publishing Co.Amsterdam pp. 277–318
- Capderou, M., 1985. Atlas Solaire d’Algérie. Office des Publications Universitaires d’Algérie, Alger.
- J.E.FernandezB.J.BaileyMeasurements and prediction of greenhouse ventilation ratesAgricultural and Forest Meteorology581992229245
- K.GarzoliJ.BlackwellAn analysis of the nocturnal heat loss from a double skin plastic greenhouseAgricultural Engineering Research3619877585
- de Halleux, D., 1989. Dynamic model of heat and mass transfer in greenhouses: theoretical and experimental study. Ph.D Thesis, Gembloux University, Belgium.
- I.ImpronS.HemmingG.P.A.BotSimple greenhouse climate model as a design tool for greenhouse in tropical lowlandBiosystems Engineering9820077989
- O.JolietHRTICERN: an improved static model for predicting the energy consumption of a greenhouseAgricultural and Forest Meteorology551991265294
- B.A.KimbalSimulation of the energy balance of a greenhouseAgricultural Meteorology111973243260
- C.KittasGreenhouse cover conductanceBoundary Layer Meteorology361986213225
- M.A.LamraniT.BoulardJ.C.RoyA.JaffrinAir flows and temperature patterns induced in a confined greenhouseAgricultural Engineering Research78120017588
- K.MesmoudiA.SoudaniL.SerirModèle de bilan énergétique d’une serre en verre sans couvert végétalRevue des Énergies Renouvelables11120085164
- F.D.Molina-AizD.L.ValeraA.J.AlvaresMeasurement and simulation of climate inside Almeria-type greenhouse using computational fluid dynamicsAgricultural and Forest Meteorology12520043351
- J.I.MonteroN.CastillaE.Gutiérrez de RavéF.BretonesClimate under plastic in the Almeria areaActa Horticulture1701985227234
- J.NijskensJ.DeltourS.CoutisseA.NisenHeat transfer through covering materials of greenhousesAgricultural and Forest Meteorology331984193214
- G.PapadakisS.FrangoudakisS.KyritsisMixed, forced and free convection heat transfer at the greenhouse coverAgricultural Engineering Research511992191205
- J.C.RoyT.BoulardC.KittasS.WangConvective and ventilation transfers in greenhouse. Part IBiosystems Engineering832002120
- Silva, A.M., 1988. A contribution to the study of the greenhouse climate, analysis of some processes of energy transfer. Ph.D. Thesis, University of Evora, Portugal.
- G.SinghP.P.SinghP.P.S.LubanaK.G.SinghFormulation and validation of mathematical model of microclimate in a greenhouseRenewable Energy31200615411560
- Tantau, H.J., 1975. Effects of single and double covering on climate and heat management in greenhouses. Ph.D. Thesis, Fak. Gartenau und Landeskerutur, Tech. Univ. Hannover, Germany.
- J.N.WalkerPredicting temperatures in ventilated greenhouseTransactions of the ASAE81965445448
- S. MahrerZhangM.Y.MargolinPredicting the microclimate inside a greenhouse: an application of a one-dimensional numerical model in an unheated greenhouseAgricultural and Forest Meteorology861997291297
Further reading
- F.J.BaptistaGreenhouse ventilation rate: theory and measurements with tracer gas techniquesAgricultural Engineering Research721999363374
- T.BoulardA.BailleSimulation and analysis of soil heat storage systems for a solar greenhouse IIEnergy in Agriculture51986285293
- T.BoulardJ.C.RoyA.JaffrinAir flows and temperature patterns induced in a confined greenhouseAgricultural Engineering Research78120017588
- C.GauthierM.LacroixH.BernierNumerical simulation of soil heat exchanger-storage systems for greenhouseSolar Energy6061997333346
- Guyot, G., 1999. Climatologie de l’Environnement. Edition Dunod, Paris, France.
- Hill, J.M., 2006. Dynamic modeling of tree growth and energy use in a nursery greenhouse using Matlab and Simulink. Master Thesis, Cornell University, UK.
- Mesmoudi, K., Adjroudi, R., Soudani, A., Bougoul, S., 2007. Etude de la distribution de la température de l’air à l’intérieur d’une serre en plastique sans couvert végétal dans la région des Aurès, Etude Expérimentale. In: ICRESD_07, Congrès international sur les énergies renouvelables et le développement durable, Tlemcen, Algeria, May 21–24, 2007.
- S.WangT.BoulardPredicting the microclimate in naturally ventilated plastic house in Mediterranean climateAgricultural Engineering Research7520002738
Appendix
Expressions of the heat fluxes
Most model parameters of the heat fluxes can be estimated from literature. The heat flux of conduction between the surface of the soil and the point situated at the depth
, and the heat flux of conduction
through the thickness of the wall of the cover are given by Eq. (A1) and (A2) respectively:
(A1)
(A2) where
is the mean thermal conductivity of the ground, and
are the temperature of the surface of the ground and of the point located at a depth
respectively.
is the mean thermal conductivity of the cover, and
and
are the temperatures of the interior and exterior walls respectively.
and
are the surface of the cover and ground and
is the thickness of the cover.
The ventilation rate given by the Eq. Equation(A3)
(A3) is used for the calculation of the air infiltration inside the building. The formula is inferred from the works of Joliet (1988) who considered the losses due to leakage in a closed Venlo glasshouse.
is the surface of the escapes,
, the wind speed, and
and
are the temperatures of the inside and outside air respectively.
(A3)
The latent heat of condensation on the interior wall of the cover is given by:
(A4) where
is the water vapour flux of condensation calculated by the Eq. Equation(A5)
(A5) .
(A5)
(A6)
is the latent heat of vaporization of water,
is the conductance of the mass transfer of the water vapor,
is the density of the interior air,
is the humidity of the interior air and
is the saturate humidity of the air near the inside wall.
According to Eq. (A4), (A5) and (A6), the latent heat flux of condensation may be written as:
(A7) where
and
are the water and air molar mass respectively,
is the atmospheric pressure,
is the vapour pressure of the inside air, and
is the vapour pressure at saturation of the inside air.
Stanghellini (1995) indicated that the conductance of the mass transfer of the water vapor can be calculated starting from the virtual temperatures of the interior air and the interior wall of the cover
according to Eq. Equation(A8)
(A8) .
(A8) Each virtual temperature is determined by Eq. Equation(A9)
(A9) given by Hill (2006).
(A9) Hence the latent heat flux of condensation on the internal walls of the cover may be written in the form:
(A10)
The vapor pressure of saturation of the air is given by the Eq. Equation(A11)
(A11) , according to the NASA (2005) cited by Impron et al., (2007).
(A11) The vapor pressure of the air is given by the formula of Tetens (1973) Equation(A12)
(A12) :.
(A12)
The net Radiative heat flux on the surface ground of the greenhouse is described by Eq. Equation(A13)
(A13) according to Singh et al. (Citation2006) where
is the emissivity of the surface ground,
is the Stefan Boltzmann constant,
is the emissivity of the cover,
is the shape factor for the interior wall to the ground of the greenhouse, and
is the infrared coefficient of absorption of the cover.
(A13)
The net radiative heat flux on the interior wall of the cover is described by Eq. Equation(A14)
(A14) according to Singh et al. (Citation2006). This equation comprises the radiative heat flux emitted by the surface of the ground of the greenhouse, and the radiative heat flux emitted by the interior wall of the cover towards the ground of the greenhouse.
(A14)
According to Kittas (Citation1986) and Singh et al. (Citation2006), the net Radiative heat flux on the outside wall of the cover can be calculated starting from: the radiative heat flux emitted by the wall towards the outside, the radiative heat flux intercepted from the sky, and the radiative heat flux emitted by the external ground towards the cover Equation(A15)
(A15) .
is the shape factor for the outside wall of the cover to the sky,
is the infrared coefficient of absorption of the cover,
is the emissivity of the sky,
is the temperature of the sky,
is the shape factor for the outside wall of the cover to the outside ground,
is the emissivity of the ground, and
is the temperature of the outside ground.
(A15)
Finally, the temperature of the sky is given according to Eq. Equation(A16)
(A16) provided by Aubinet (1994), with
the temperature of the outside air,
, the total solar radiation, and
the nebulosity of the sky.
(A16)