Abstract
Three rapid, selective and sensitive spectrophotometric methods have been proposed for the quantitative determination of levocetirizine dihydrochloride (LCT) in pure form as well as in its pharmaceutical formulation. The methods are based on the charge transfer complexation reaction of LCT as n-electron donor with 2,4-dinitrophenol (DNP), picric acid (PA) as π-acceptors and iodine (I2) as σ-acceptor to give highly colored radical anion species. The colored products were quantified spectrophotometrically at 420 nm with both DNP (method A) and PA (method B) and at 375 nm with I2 (method C). Under the optimized experimental conditions, Beer’s law is obeyed over the concentration ranges of 1.2–24, 1.6–32 and 2.4–48 μg mL−1 LCZ for method A, method B and method C, respectively. The values of molar absorptivity, Sandell sensitivity, limits of detection and quantification are also reported. The effect of reaction medium, reaction time and reagent concentration on the sensitivity and stability of the complexes formed has been examined. The proposed methods were successfully applied to the determination of LCT in pure form and commercial tablets and in syrup with good accuracy and precision. Statistical comparison of the results was performed using Student’s t-test and F-ratio at 95% confidence level and the results showed no significant difference between the reference and proposed methods with regard to accuracy and precision. Further to the accuracy and reliability the methods were confirmed by recovery studies via the standard addition technique.
1 Introduction
Levocetirizine dihydrochloride (LCT), (2-[4-[(R)-(4-chlorophenyl) phenylmethyl]-1-piperazinyl]ethoxy]-acetic acid dihydrochloride) () is a third generation non sedative antihistamine (O’Neil and Merck, Citation2001), and is the active enantiomer of cetirizine dihydrochloride. In many cases, the two racemic enantiomers differ in their pharmacokinetic and pharmacodynamic properties. Replacing existing recemates with single isomers has resulted in improved safety and/or efficacy profile of various recemates (Patil and Kothekar, Citation2006; Bernard et al., Citation1990). LCT has the advantages of higher efficacy, less side effects, and longer duration over other antihistamines, and has begun to replace cetirizine in clinical therapy stepwise. It has been chemically proved that the half dosage form of LCTZ (2.5 mg) has comparable antihistaminic activity to normal amount (5.0 mg) of cetirizine in the treatment of allergic rhinitis and chronic idiopathic urticaria (Devalia et al., Citation2001).
Figure 1 Structure of LCT.
Official method (Indian Pharmacopoeia, Citation2007) describes acid–base titration with 0.1 M NaOH in acetone/water medium. Literature survey revealed that LCT has been determined in human serum by reverse-phase high performance liquid chromatography (RP-HPLC) along with other H1-receptor antagonists (Saeed arayne et al., Citation2010) and in plasma by liquid chromatography-tandem mass spectrometry (Gunasakaran et al., Citation2010). Xiangping et al. (Citation2009) have recently reported a study on the interaction of LCT with human serum albumin by molecular spectroscopy.
Determination of small amounts of LCT in pharmaceutical preparations is important for medical and pharmaceutical needs, and hence it is crucial to develop simple, sensitive, selective, and cost-effective methods for its determination as a part of compliance of specifications study: specimen quantity, sample homogenity, and content uniformity in tablets.
LCT in combination with a number of other drugs in tablet dosage form has been assayed by UV-spectrophotometry (Lakshmana Prabhu et al., Citation2008; Merukar et al., Citation2009), ratio derivative spectrophotometry (Choudhari et al., Citation2010), TLC-densitometry (Smita et al., Citation2010) RP-HPLC (Ashokkumar et al., Citation2009; Ambadas and Vaishali, Citation2010; Kamarapu et al., Citation2010; Shaikh and Patil, Citation2010). However, there are only three reports dealing with the determination of LCT when present alone in its dosage forms. Li et al. (Citation2000) have reported an UV-spectrophotometric method to determine the effective content of LCT in its tablets. The drug and related substance in solid oral formulation were assayed by HPLC (Yadav Birendra and Sumit Yadav, Citation2010). The same technique has been applied for the stability-indicating method for the drug in bulk form and in dosage forms (Dhaneshwar et al., Citation2006) and for the determination of LCT configuration stability in tablets using the chiral mode (Raghad Hommoss and Hind elzein, Citation2011).
However, many of the reported methods for LCT in single-dosage form, particularly, the chromatographic methods are complex, requiring expensive instrumental set up and skilled operator which are not always found in laboratories of developing and under developed countries. Thus, the need for a simple, selective and low-cost method is obvious, especially for routine quality control analysis of pharmaceuticals containing LCT. Hence, the authors have made an attempt in this direction and succeeded in developing three visible spectrophotometric methods based on charge transfer complex formation reaction involving two π-acceptors (dinitrophenol and picric acid) and a σ-acceptor (iodine).
Nitrophenol derivatives such as 2,4-dinitrophenol (DNP), picric acid (PA) are excellent π-acceptors (El-Yazbi et al., Citation2003; Abdel-Hay et al., Citation2004), and iodine (I2), a σ-acceptor (Gamal, Citation1998; Azza et al., Citation2002) and have been widely used in the assay of several drugs. This paper, for first time, describes the application of these three reagents for the rapid, selective and sensitive spectrophotometric assay of LCT in bulk drug and in its dosage forms. The methods involve the charge-transfer (C-T) complex formation reaction of the drug with DNP (method A), PA (method B) and I2 (method C) in dichloromethane to form intensely colored radical anions measurable at 420 nm in methods A and method B and at 375 nm in method C. The proposed methods are determined to be simple and rapid employing low cost reagents and instruments.
2 Experimental
2.1 Apparatus
All absorption measurements were made using a Systronics model 106 digital spectrophotometer (Systronics Ltd., Ahmedabad, India) with 1 cm path length matched quartz cells.
2.2 Chemicals and reagents
Pharmaceutical grade LCT (certified to be 99.85% pure) was procured from Jubiliant Life Sciences Limited, Mysore, India, and used as received. Allercet 5 mg (Micro labs Ltd.) and Xyzal 5 mg (UCB India Pvt. Ltd.) tablets and Lezyncet syrup (Mepro pharmaceuticals Pvt. Ltd.) were purchased from the local market and dichloromethane (spectroscopic grade) was purchased from Merck, Mumbai, India. Distilled water was used wherever required.
2.2.1 Dinitrophenol (0.05%)
Prepared by dissolving 0.05 g of dinitrophenol (S.D. Fine Chem Ltd., Mumbai, India) in 100 mL of dichloromethane and used for the assay in method A.
2.2.2 Picric acid (0.1%)
Prepared by dissolving 0.1 g of picric acid (S.D. Fine Chem Ltd., Mumbai, India) in 100 mL of dichloromethane and used for the assay in method B.
2.2.3 Iodine solution (0.5%)
Prepared by dissolving 0.5 g of the pure resublimed iodine (S.D. Fine Chem Ltd., Mumbai, India) in 100 mL of dichloromethane and used after 30 min for the assay in method C.
2.2.4 Sodium hydroxide (1.0 M)
Accurately weighed 1 g of the pure NaOH (Merck, India) was dissolved in water; the solution was made up to 100 mL with water.
2.2.5 Standard drug solution (LCZ)
A 300 μg mL−1 solution of levocetirizine base was prepared by dissolving accurately weighed 35.7 mg of the pure LCT in water and the volume was brought to 100 mL with water in a calibrated flask and mixed well.
2.3 General procedures
2.3.1 Preparation of LCT base (LCZ) solution
Transferred accurately 20 mL of the pure LCZ solution (300 μg mL−1) into a 125 mL separating funnel containing 5.0 mL of 1.0 M NaOH and the content was mixed well. The levocetirizine base was extracted with three 20 mL portions of dichloromethane, the extract was passed over anhydrous sodium sulphate and collected in a 100 mL volumetric flask, the volume was made up to mark with dichloromethane and the resulting solution (60 μg mL−1 LCZ) was used for the assay in method C and diluted to 30 and 40 μg mL−1 LCZ for method A and method B, respectively.
2.4 Construction of calibration curves
2.4.1 Method A (using DNP)
Different aliquots (0.2, 0.5………4.0 mL) of standard LCZ solution (30 μg mL−1) were accurately transferred into a series of 5 mL calibration flasks using a micro burette. One milliliter of 0.05% DNP solution was added to each flask and diluted to volume with dichloromethane. The content was mixed well and the absorbance was measured at 420 nm against a reagent blank.
2.4.2 Method B (using PA)
Aliquots (0.2, 0.5……..4.0 mL) of a standard LCZ (40 μg mL−1) solution were accurately transferred into a series of 5 mL calibration flasks. To each flask, 1 mL of 0.1% PA solution was added and the solution was made up to volume with dichloromethane. The content was mixed well and the absorbance was measured at 420 nm against a reagent blank.
2.4.3 Method C (using I2)
Varying aliquots of standard LCZ solution equivalent to 2.4–48 μg mL−1 (0.2–4.0 mL of 60 μg mL−1) were accurately measured and transferred into a series of 5 mL calibrated flasks and 1 mL of 0.5% iodine solution was added to each flask, the content was mixed well and the flasks were allowed to stand at room temperature for 15 min. The volume was brought up to the mark with dichloromethane and the absorbance was measured at 375 nm against a reagent blank similarly prepared without adding LCZ base solution.
Standard graph was prepared by plotting the absorbance versus drug concentration, and the concentration of the unknown was read from the calibration graph or computed from the respective regression equation.
2.5 Procedure for commercial dosage forms
2.5.1 Tablets
Twenty tablets were weighed and pulverized. The amount of tablet powder equivalent to 35.7 mg of LCZ was transferred into a 100 mL volumetric flask. The content was shaken well with about 50 mL of water for 20 min and diluted to the mark with water. It was filtered using Whatmann No. 42 filter paper. First 10 mL portion of the filtrate was discarded. Twenty milliliters of the tablet extract (300 μg mL−1) was quantitatively transferred to a separating funnel, pH was raised by adding 5.0 mL of 1.0 M NaOH and the content was mixed well. The levocetirizine base was extracted with three 20 mL portions of dichloromethane, the extract was passed over anhydrous sodium sulphate and collected in 100 mL volumetric flask, the volume was made up to mark with dichloromethane and the resulting solution (60 μg mL−1 LCZ) was used in method C and diluted to 30 and 40 μg mL−1 LCZ for method A, method B, respectively, and used for the assay.
2.5.2 Syrup
The content of five syrup bottles (5 mL lezyncet syrup equivalent to 2.5 mg levocetirizine dihydrochloride) were pooled and mixed together. Volume of Lezyncet syrup equivalent to 35.7 mg of LCZ was accurately measured and transferred into a 100 mL volumetric flask. The content was shaken well with about 50 mL of water for 20 min and diluted to the mark with water. It was filtered using Whatmann No. 42 filter paper. First 10 mL portion of the filtrate was discarded. Transferred accurately 20 mL of the syrup extract (300 μg/mL) into a 125 mL separating funnel and levocetirizine base was prepared as described earlier and used for the assay.
2.5.3 Procedure for the analysis of placebo blank and synthetic mixture
A placebo blank containing starch (40 mg), acacia (35 mg), sodium citrate (35 mg), hydroxyl cellulose (35 mg), magnesium stearate (35 mg), talc (40 mg) and sodium alginate (35 mg) was prepared by mixing all the components into a homogeneous mixture. A 10 mg of the placebo blank was accurately weighed and its solution was prepared as described under ‘tablets’, and then subjected to analysis by following the general procedures.
An accurately weighed quantity of LCZ was added to 200 mg of placebo blank and homogenized. An amount of synthetic mixture equivalent containing 10.0 mg LCZ was accurately weighed and transferred into a 50 mL volumetric flask and the extract equivalent to 100 μg mL−1 LCZ was prepared as described under the general procedure for pure drug and further diluted to the required concentration and used for the assay in all the three methods.
3 Results and discussion
3.1 Absorption spectra
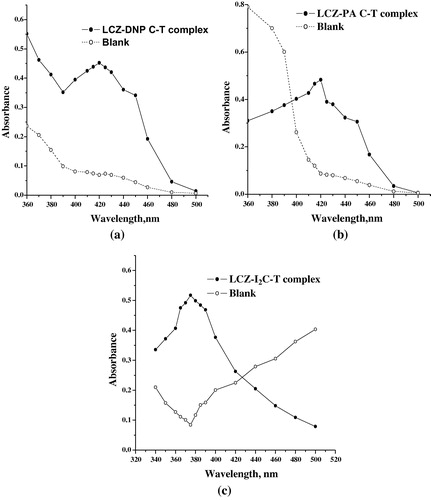
The reaction of levocetirizine base (LCZ) as n-electron donor) and the π-acceptors such as DNP and PA, and σ-acceptor, I2 result in the formation of C-T complexes. The absorption spectra of LCZ-DNP and LCZ-PA C-T complex resulted in the formation of intense yellow products which exhibit absorption maxima at 420 nm (a and b). Similarly, the reaction of LCZ with I2 results in the formation of a yellow product which exhibits an absorption maximum 375 nm (c).
Figure 2 Absorption spectra (a) LCZ-DNP (b) LCZ-PA (c) LCZ-I2.
3.2 Reaction scheme
Charge-transfer complex is a complex formed between an electron-donor and an electron-acceptor, characterized by electronic transition(s) to an excited state in which there is a partial transfer of electronic charge from the donor to the acceptor moiety. As a result, the excitation energy of this resonance occurs very frequently in the visible region of the electro-magnetic spectrum (Foster, Citation1969). This produces the usually intense color characteristic of these complexes. Therefore, LCZ, a nitrogenous base is an n-donor, was made to react with dinitrophenol, picric acid (π-acceptors) and iodine (σ-acceptor) to produce a colored charge transfer complex in dichloromethane.
3.3 Reaction with π-acceptors
3.3.1 Dinitrophenol (method A) and picric acid (method B)
Trinitrophenol (picric acid) and dinitrophenol react with electron donor molecule to form charge transfer and proton transfer complexes (Sadeghi and Shamsipur, Citation1998; Mahrous, Citation1992; Issa and Amin, Citation1993; Xuan et al., Citation1998). It was used for the determination of some amine derivatives through the formation of intense yellow colored complex. Interestingly, the application of picric acid for the quantitative estimation of orphendrine citrate and phentolamine mesylate injections is official in the USP (United State Pharmaco, Citation2002).
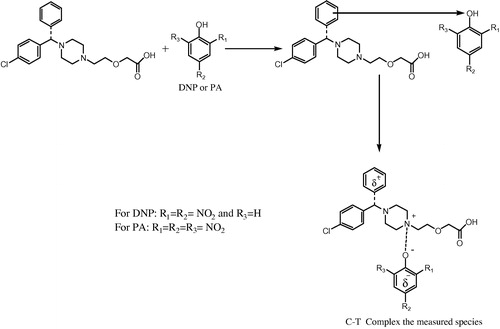
When an amine is combined with a polynitrophenol, one type of force field produces an acid–base interaction, and the other, an electron donor–acceptor interaction. The former interaction leads to the formation of true phenolate by proton-transfer, and the latter, to a true molecular compound by charge-transfer (El-Yazbi et al., Citation2003). Based on this, the mechanism for method A and method B can be discussed in terms of transfer of electronic charge from the benzene ring of LCZ, an electron-rich molecule (a Lewis-base donor), to the ring of DNP or PA, an electron-deficient molecule (a Lewis-acid acceptor), and at the same time the proton of the hydroxyl group of DNP or PA will transfer to the tertiary amine of LCZ. The explanation for the produced color in method A and method B lies in the formation of complexes between the pairs of molecules LCZ-DNP and LCZ-PA, and this complex formation leads to the production of two new molecular orbitals and, consequently, to a new electronic transition (Regulska et al., Citation2002).
Because LCZ has two tertiary amino groups in their molecular structure with the availability of non-bonding electron donors, it reacts with dinitrophenol and picric acid in dichloromethane to yield a yellow colored C-T complex peaking at 420 nm (a and b). The interaction between LCZ (D), an n-donor and nitrophenols (A), π-acceptors, is a charge transfer complexation reaction followed by the formation of radical ions (Douglas and Donald, Citation1971) according to the .
Scheme 1 Reaction pathway for the formation of electron donor–acceptor complex and radical ions between LCZ and nitrophenols.
3.3.2 Reaction with σ-acceptor (iodine) (method C)
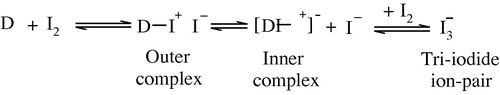
LCZ, an n-donor (D), in dichloromethane forms a lemon yellow colored C-T complex with iodine (I2) (σ-acceptor) and the resulting colored species was found to absorb maximally at 375 nm (c). The color of iodine in dichloromethane is violet showing absorption maximum (λmax) at 500 nm. This color was changed into lemon yellow when mixed with drug. This change in color and the appearance of the peak were attributed to the formation of charge-transfer complex between LCZ and iodine. The interaction between the donor and acceptor occurs according to the .
Scheme 2 Reaction pathway for the formation of electron donor–acceptor complex and radical ion between LCZ and iodine.
3.4 Optimization of experimental variables
Many experimental variables which were found to affect the color intensity and stability of the resulting complexes were optimized to achieve maximum sensitivity and adherence to Beer’s law.
3.4.1 Effect of reagent concentration
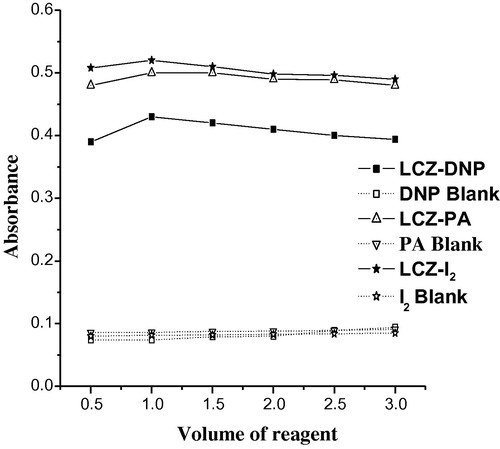
The optimum concentration of the reagent required to achieve maximum sensitivity of the developed color species in each method was ascertained by adding different amounts of the reagent DNP, PA or I2 to a fixed concentration of LCZ. The results showed that 1.0 mL each of 0.1% DNP 0.05% PA and 0.5% I2 solution was optimum for the production of maximum and reproducible color intensity ().
Figure 3 Effect of reagent concentration on the formation of (LCZ–DNP complex, 12 μg mL−1 LCZ), (LCZ_PA complex, 16 μg mL−1 LCZ) and (LCZ–I2 complex, 24 μg mL−1 LCZ).
3.4.2 Effect of solvent
In order to select a suitable solvent for preparation of the reagent solutions used in the study, the reagents were prepared separately in different solvents such as 1,4-dioxane, chloroform, acetonitrile, acetone, t-butanol,2-propanol and dichloromethane. The reaction of LCZ with DNP, PA or I2 was followed; dichloromethane was best suited for the preparation of DNP, PA and I2 solution. Similarly, the effect of the diluting solvent was studied for all the methods and the results showed that the ideal diluting solvent to achieve maximum sensitivity and stability of the colored species was dichloromethane in all the three methods.
3.4.3 Effect of reaction time and stability of the C-T complexes
The optimum reaction times were determined by measuring the absorbance of the complex formed upon the addition of reagent solution to LCT solution at room temperature. The reaction of LCZ with DNP in method A and PA in method B was instantaneous while complete color development was attained after 15 min with I2. The absorbance of the resulting C-T complexes remained stable for at least more than 20 h for method A and method B and at least for 45 min in method C.
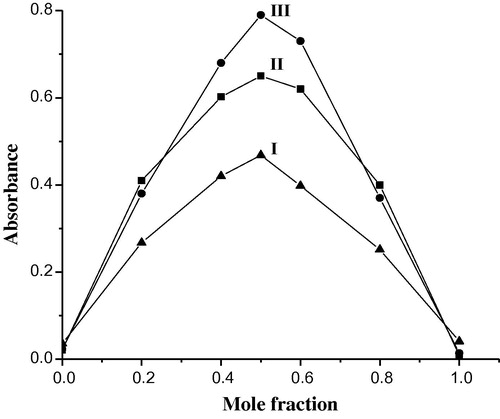
3.5 Composition of the C-T complexes
The composition of the C-T complex was established by Job’s method of continuous variations (Harikrishna et al., Citation2008) using equimolar concentrations of the drug (base form) and reagents (4.48 × 10⁻⁴ M in method A, 2.16 × 10⁻⁴ M in method B and 4.26 × 10⁻⁴ M). The results indicated that 1:1 (drug/reagent) complex is formed in all the methods. Five solutions containing LCZ and the reagent (DNP, PA or I2) in various molar ratios, with a total volume of 5 mL in all the methods were prepared. The absorbance of solutions was subsequently measured at 420 nm in method A and method B and 375 nm in method C. The graphs of the results obtained () gave a maximum at a molar ratio of Xmax = 0.5 in all the methods which indicated the formation of a 1:1 C-T complex between LCZ and reagent (DNP, PA or I2). Since the steric hindrance to nitrogen attached to tertiary carbon only the nitrogen attached to secondary carbon is vulnerable for ion pair.
Figure 4 Job’s continuous-variations plots (I) LCZ + DNP (II) LCZ + PA and (III) LCZ+I2.
4 Method validation
The proposed methods were validated for linearity, sensitivity, selectivity, accuracy, precision, robustness, ruggedness and recovery according to the current ICH guidelines (ICH guidelines, Citation2005).
4.1 Linearity and sensitivity
Under the optimum conditions a linear relation was obtained between absorbance and concentration of LCT in the ranges given in . The calibration graph in each instance is described by the equation:(where Y = absorbance, a = intercept, b = slope and X = concentration in μg mL−1). LOD and LOQ were calculated according to the current ICH guidelines and compiled in .
Table 1 Sensitivity and regression parameters.
4.2 Accuracy and precision
In order to determine the accuracy and precision of the proposed methods, pure drug (LCT) solution at three different concentration levels (within the working range) were prepared and analyzed during the same day (intra-day precision) and on five consecutive days (inter-day precision) and the results are presented in .
Table 2 Evaluation of intra-day and inter-day accuracy and precision.
4.3 Selectivity
The selectivity of the proposed methods for the analysis of LCT was evaluated by placebo blank and synthetic mixture analyses. The recommended procedures were applied to the analysis of placebo blank and the resulting absorbance readings in all the methods were same as that of the reagent blank, confirming no interference from the placebo. The analysis of synthetic mixture solution prepared as described earlier yielded percent recoveries of 98.3 ± 2.13, 99.1 ± 1.76 and 98.9 ± 1.91 (n = 5) for method A, method B and method C, respectively. The results of this study showed that the inactive ingredients did not interfere in the assay indicating the high selectivity of the proposed methods and its utility for routine determination in pure drug and in tablets form.
4.4 Application to analysis of tablets/syrup containing LCT
The proposed methods were successfully applied to the determination of LCT in two brands of tablets and syrup and the results are compiled in . The results obtained were statistically compared with those obtained by the reference method (Indian Pharmacopoeia, Citation2007), by applying the Student’s t-test for accuracy and F-test for precision at 95% confidence level. The reference method involves acid–base titration to the potentiometric end point in acetone/water system. As can be seen from the , the calculated t- and F-values at 95% confidence level did not exceed the tabulated values for four degrees of freedom. This indicates that there are no significant differences between the proposed methods and the reference method with respect to accuracy and precision.
Table 3 Results of analysis of tablets/syrup by the proposed methods.
4.5 Recovery study
The accuracy and validity of the proposed methods were further ascertained by performing recovery studies. Pre-analyzed tablet powder was spiked with pure LCT at three concentration levels (50%, 100% and 150% of that in tablet powder) and the total was analyzed by the proposed methods. The results of this study are presented in and indicate that the excipients present in the tablets did not interfere in the assay.
Table 4 Results of recovery study for tablets and injection by standard addition method.
5 Conclusion
Three simple, sensitive, extraction-free, rapid and cost-effective spectrophotometric methods based on charge transfer complex formation reaction are described for the determination of LCT. The methods were developed and validated as per the current ICH guidelines. The proposed methods utilize a single step reaction and a single solvent. No substantial differences among the proposed methods arose from analysis of the experimental results. The methods are free from interferences from the common excipients and additives. The statistical parameters and the recovery data reveal good accuracy and precision of the methods. These methods can be used as general methods for the determination of LCT in bulk powder, tablets and syrup, have many advantages over the separation techniques such as HPLC, are of reduced cost, and speed with high accuracy. Hence, these methods can be used in routine analysis of drug in quality control laboratories.
Acknowledgements
Authors thank Jubiliant Life Sciences Limited, Mysore, India, for gifting pure levocetirizine. Authors are grateful to thank the authorities of the University of Mysore, Mysore, for permission and facilities.
References
- M.H.Abdel-HayS.M.SabryM.H.BararyT.S.BelalSpectrophotometric determination of bisacodyl and piribedilAnal. Lett.372004226247
- R.R.AmbadasS.N.VaishaliDetermination of montelukast sodiumand levocetirizine dihydrochloride in combined pharmaceutical dosage form by RP-HPLCLat. Am. J. Pharm.29201010201023
- S.AshokkumarM.Senthil RajaP.PerumalRP-HPLC method development and validation for simultaneous estimation of montelukast sodium and levocetirizine dihydrochlorideInt. J. Pharm. Res.12009812
- A.M.AzzaI.B.LoriesH.R.HebaSpectrophotometric determination of clobetasol propionate, halobetasol propionate, quinagolide hydrochloride, through charge transfer complexationJ. Pharm. Biomed. Anal.272002889899
- T.BernardF.WilliamTragerRacemates versus Enantiomers in drug development. Dogmastic or pragmatismChirality21990129133
- V.ChoudhariA.KaleS.AbnaweB.KuchekarV.GawliN.PatilSimultaneous determination of montelukast sodium and levocetirizine dihydrochloride in pharmaceutical preparations by ratio derivative spectroscopyInt. J. Pharm. Res.2201049
- J.L.DevaliaF.HanotteE.BaltesC.De VosAllergy5620015057
- S.DhaneshwarK.BhutaleV.MhaskeS.KadamStability indicating HPLC method for the determination of levocetirizine dihydrochloride as bulk and in pharmaceutical dosage formsJ. Pharm. Pharmacol.58200699
- Douglas, A. S., Donald, M. W., 1971. Principels of Instrumental Analysis, Holt, Rinhart and Winston, New York, 104.
- F.A.El-YazbiA.A.GazyH.MahgoubM.A.El-SayedR.M.YoussefSpectrophotometric and titrimetric determination of nizatidine in capsulesJ. Pharm. Biomed. Anal.31200310271034
- R.FosterOrganic charge-transfer complexes1969Academic PressNew York 51
- A.S.GamalCharge-transfer complexes of barbiturates and phenytoinTalanta461998111121
- S.GunasakaranNageshwara.RaoR.ArunkumarA.OlaganathanDetermination of levocetirizine in human plasma by liquid chromatography electrospray tandem mass spectrometryBiomirror2010116
- K.HarikrishnaB.S.NagaralliJ.SeetharamappaExtractive spectrophotometric determination of sildenafil citrate (viagra) in pure and pharmaceutical formulationsJ. Food Drug Anal.1620081117
- Indian Pharmacopoeia, 2007. Government of India, New Delhi: Controller of Publications. II, 1290.
- International Conference on Hormonisation of Technical Requirements for Registration of Pharmaceuticals for Human Use, ICH Harmonised Tripartite Guideline, Validation of Analytical Procedures: Text and Methodology Q2(R 1), Complementary Guideline on Methodology dated 06 November 1996, incorporated in November 2005, London.
- Y.M.IssaA.S.AminSpectrophotometric determination of ampicillin with some nitro compoundsAnal. Lett.26199323972407
- S.K.KamarapuVaijayanthiBahlul zeaR.K.VenisettyDevelopment of RP-HPLC method for the analysis of levocetirizine. 2HCl andambroxol. HCl in combination and its applicationInt. J. Phar. Sci Nanotech.320101
- S.Lakshmana PrabhuA.ShirwaikarAnnieShirwaikarC.Dinesh KumaG.Aravind KumarSimultaneous UV spectrophotometric estimation of ambroxol hydrochloride and levocetirizine dihydrochlorideIndian J. Pharm. Sci.702008236238
- J.LiJ.YuF.HouUsing UV spectrophotometr method to determine the Effective content of levocetirizine hydrochloride tabletsJ. Huaihua. University.200020062008
- M.E.MahrousSensitive spectrophotometric methods for determination of non uv absorbing ethambutolAnal. Lett.251992269280
- O’Neil, M.J., Merck, 2001. The Merck Index, 13th ed. Merck Research Laboratories.
- S.S.MerukarP.S.MhaskarS.R.BavaskarK.B.BuradeP.N.DhabaleSimultaneous spectrophotometric methods for estimation of levocetirizine and pseudoephedrine inpharmaceutical tablet dosage formJ. Pharm. Sci. Res.120093842
- P.PatilKothekarDevelopment of safer molecules through chiralityInd. J. Med. Sci.602006427437
- Raghad.HommossHind elzeinDetermination of levocetirizine configurational stability in tablets using chiral HPLC methodInt. J. Pharm. Pharmaceut. Sci.32011103107
- E.RegulskaM.TarasiewiczH.Puzanowska-TarasiewiczExtractive spectrophotometric determination of some phenothiazines with dipicrylamine and picric acid.JPharm. Biomed. Anal.272002335340
- S.SadeghiM.Shamsipurnew extractive-spectrophotometric method for the determination of ketoconazole from pharmaceutical preparationsAnal. Lett.31199826912705
- M. Saeed arayneSultana najmaAgha zeeshan mirzaFarhan ahmed siddiqui Simultaneous determination of gliquidone, fexofenadine, buclizine, and levocetirizine in dosage formulation and human serum by RP-HPLC J. Chrmatogr. Sci.482010382385
- K.A.ShaikhA.T.PatilA stability-indicating LC method for the simultaneous determination of levocetirizine dihydrochloride and pseudoephedrine sulfate in tablet dosage formsInt. J. Chem. Tech. Res.22010454461
- S.SmitaM.C.SharmaD.V.KohlibA.D.SharmaDevelopment and validation of TLC-densitometry method for simultaneous quantification of montelukast sodium and levocetirizine dihydrochloride pharmaceutical solid dosage formDer. Pharmacia. Lettre22010489494
- The United State Pharmacopeia (USP 25), National Formulary (NF 19), The United States Pharmacopeial Convention, Inc., Rockville, 2002, 1270.
- LiuXiangpingDuXinxiangKouJunpingYuBoyangStudy on the interaction of levocetirizine dihydrochloride with human serum albumin by molecular spectroscopySpectrochimica Acta A.741200911891196
- C.S.XuanZ.Y.WangJ.L.SongSpectrophotometric determination of some antibacterial drugs using p-nitrophenolAnal. Lett.31199811851195
- Yadav.BirendraSumit.YadavSensitive HPLC method for determination of related substance of levocetirizine dihydrochloride in solid oral formulationsJ. Pharmacy Res.3201028172820