
Abstract
New sensitive and rapid spectrophotometric methods for the determination of four analgesic drugs namely, nalbuphine (NALB), naltrexone (NALT), morphine (MORF) and tramadol (TRAM) in pharmaceutical formulations were developed and optimized. The proposed methods involve the addition of a measured excess of N-bromosuccinimide in acid medium followed by determination of unreacted NBS by reacting with either a fixed amount of methyl orange and measuring the absorbance at 508 nm (Method A), or orange G and measuring the absorbance at 478 nm (Method B). In both methods, the amount of NBS reacted corresponds to the amount of drugs. Under the optimum conditions, Beer’s law limit, molar absorptivity and Sandell’s sensitivity were calculated. The limits of detection and quantification were also reported for both methods. Statistical evaluation of the methods was examined by determining intra-day and inter-day precisions. The methods were successfully applied to the assay of drugs in their pharmaceutical formulations. No interference was observed from common additives and the validity of the methods was tested.
1 Introduction
Nalbuphine (−)-17-(cyclobutylmethyl)-4,5α-epoxymorphinan-3,6α,14-triol (a) is a semisynthetic narcotic agonist–antagonist of the phenanthrene series. Structurally, it is closely related to naloxone, an antagonist of the opiate receptors and to oxymorphone, a narcotic agonist. Nalbuphine has been shown to be approximately equianalgesic to morphine, yet with a ceiling effect on ventilator depression and fewer adverse effects than pethidine or pentazocine. As an analgesic agent, it is almost as potent as morphine and has been widely used in the treatment of acute and chronic pain (CitationPick et al., 1992). Its main advantages over morphine are a ceiling effect of respiratory depression, low tolerance liability and a lack of significant withdrawal symptoms. It is available as an injection for intramuscular and intravenous administration. The usual recommended doses are 10–20 mg by intravenous or intramuscular injection every 3–4 h. As to our best knowledge, there is no official analytical method for analyzing NALB in ampoule, in pharmacopoeias and the literatures.
Figure 1 Chemical structure of the selected drugs.
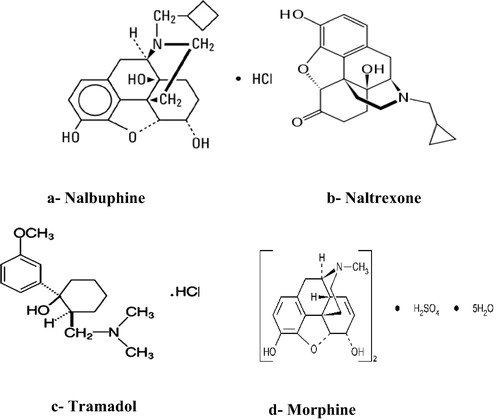
Table 2 Evaluation of intra-day and inter-day accuracy and precision of the proposed methods using MO dye.
Table 3 Evaluation of intra-day and inter-day accuracy and precision of the proposed methods using OG dye.
A few methods have been described to detect nalbuphine in pharmaceutical formulations and in biological fluids; they include gas chromatography coupled to electron-capture detection (CitationWeinstein et al., 1978), or mass spectrometry (CitationYoo et al., 1995), high-performance liquid chromatography with electrochemical detection (Groenendaal et al., Citation2005; Pao et al., Citation2000) and LC–MS/MS (CitationCai et al., 2011). The GC methods (CitationYoo et al., 1995), although sensitive, involved expensive equipment and time consuming preparation of samples and are not easily available for routine drug monitoring.
Naltrexone (17-cyclopropylmethylmethyl-6-deoxy – 7,8 – dihydro-14-hydroxy-6-oxo-17-normorphine) (b), is a long-acting synthetic opiate antagonist with few side effects that is efficacious when administered orally, either daily or three times a week for a sustained period of time. Naltrexone has been determined by using a wide variety of analytical techniques, particularly chromatographic, such as high-performance liquid chromatography (HPLC) with electrochemical detection (CitationBrünen et al., 2010), liquid chromatography (CitationSlawson et al., 2007), and gas chromatography coupled with mass spectrometry (CitationMehrdad et al., 2009).
Tramadol hydrochloride is a centrally acting analgesic, used for treating moderate to severe pain. Tramadol hydrochloride possesses agonist actions at the μ-opioid receptor and effects reuptake at the noradrenergic and serotonergic systems. Tramadol is a compound with μ-agonist activity. Chemically it is [2-(dimethylaminomethyl)-1-(3-methoxyphenyl) cyclohexanol)], (c). It is used to treat moderate to moderately severe pain and most types of neuralgia, including trigeminal neuralgia. The BP (CitationBritish Pharmacopoeia, 2003), specifies the non-aqueous titration technique detecting the end point potentiometrically for the determination of tramadol and dothiepin hydrochlorides while acebutolol was assayed in aqueous medium using 0.1 M NaOH titrant. Because of its wide use, several techniques have been reported for its assay in biological and pharmaceutical samples that include a number of high-performance liquid chromatographic (HPLC) (Chandra et al., Citation2012; Saccomanni et al., Citation2010), electrochemical (CitationGarrido et al., 2003), potentiometric methods (Ganjali et al., Citation2008; Abu Shawish et al., Citation2011), and amperometry (CitationMalongo et al., 2008), voltammetry (CitationGhorbani-Bidkorbeh et al., 2010), and flow injection chemiluminescence spectrophotometry (CitationZhang et al., 2009). The literature reported three spectrophotometric methods differed from our described work (Anis et al., Citation2011; Abdellatef et al., Citation2006).
Morphine (5α,6α-didehydro-4,5-epoxy-17-methylmorphinan-3,6-diol) (d), is a therapeutic drug that is used commonly for the control of pain and also abused as an illicit drug. It is recommended by the World Health Organization (WHO) for the relief of moderate cancer-related pain. Moreover, heroin is hydrolyzed in the organism to morphine; therefore, the determination of morphine content of biological samples is helpful for clinical and forensic purposes (CitationHoffman et al., 1997). However, it is toxic in excess and when abused. To prevent overdose-induced toxication, it is necessary to sensitively monitor the concentrations of morphine in a patient’s blood or urine. Various analytical methods have been developed for the determination of morphine and its major metabolites. The most common analytical techniques currently used include gas chromatography (Matyus et al., Citation2012; Barroso et al., Citation2010), high-performance liquid chromatography (Berga et al., Citation2009; Ruzilawati et al., Citation2012), and their combination with other detection methods, capillary electrophoresis (CitationMi et al., 2004), chemiluminescence (CitationFrancisa et al., 2008), voltammetric (Ali et al., Citation2011; Li et al., Citation2009), and electrochemical (CitationLi et al., 2010). To the best of our knowledge, only a report was found on the determination of morphine by spectrophotometry (CitationSheibani et al., 2010).
Reviewing the literature revealed that, up to the present time nothing has been published concerning the spectrophotometric determination of nalbuphine and naltrexone and little detection has been reported for the determination of morphine and tramadol by spectrophotometric methods. For these reasons, the present study describes simple, sensitive and economical spectrophotometric methods for the analysis NALB, NALT, MORF and TRAM in pure and pharmaceutical preparations. Analytical criteria including linearity, sensitivity, precision, accuracy and recovery are discussed.
2 Experimental
2.1 Apparatus
All the absorbance spectral measurements were made using spectroscan 80 D double-beam UV/Vis spectrophotometer (Biotech Engineering Ltd., UK), with wavelength range 190–1100 nm, spectral bandwidth 2 nm, with 10 mm matched quartz cells.
2.2 Reagents and materials
All reagents and chemicals used were of analytical or pharmaceutical grade and all solutions were prepared fresh daily.
2.2.1 Standard solution of pure drugs
A stock standard solution containing 20 mg of nalbuphine (NALB), naltrexone (NALT), morphine (MORF) and tramadol (TRAM) was prepared by dissolving an appropriate weight of pure drugs in distilled water and made up to the mark in a 100 mL calibrated flask. The analytical standard solutions of drugs were prepared daily by appropriate dilution of the stock standard solution in water.
2.2.2 N-bromosuccinimide (0.01%)
A stock solution of 0.01% N-bromosuccinimide (Aldrich Co., Ltd., Gillingham-Dorst, Germany) [1-Bromo-2,5-pyrrolidinedione], (C4H4BrNO2, M.Wt. 177.98 g mol−1) was freshly prepared by dissolving 10 mg of NBS in a least amount of warm water in a 100 mL measuring flask and then diluted with distilled water to the mark.
2.2.3 Methyl orange (5 × 10⁻⁴ M)
A stock solution of 5 × 10⁻⁴ M methyl orange (E. Merck) [4-dimethylaminoazobenzene-4′-sulfonic acid sodium salt], (C14H14N3NaO3S, M.Wt. 327.33 g mol−1) was prepared by dissolving 16.36 mg of dye (99% purity) in distilled water and diluting to 100 mL in a measuring flask with distilled water.
2.2.4 Orange G (1 × 10⁻³ M)
A stock solution of 1 × 10⁻³ M orange G (Aldrich) [1-Phenylazo-2-naphthol-6,8-disulfonic acid disodium salt], (C16H10N2Na2O7S2, M.Wt. 452.38 g mol−1) was prepared by dissolving 45.2 mg of dye in distilled water and diluting to 100 mL in a measuring flask with distilled water.
2.2.5 Hydrochloric acid (0.5 M)
A 0.5 M of HCl was prepared by diluting 4.47 mL of concentrated acid (Merck, Darmstadt, Germany, sp. gr. 1.18%, 37%) to 100 mL with distilled water.
2.2.6 Potassium bromide (1.0%)
A 1% KBr solution is used.
2.3 Recommended procedures
2.3.1 Method A: using methyl orange dye
Aliquot solutions of pure NALB (1.0–4.5 μg mL−1), NALT (1.5–6.5 μg mL−1), MORF (1.0–4.0 μg mL−1) and TRAM (1.0–5 μg mL−1) were transferred into a series of 10 mL volumetric flasks by means of a micro buret. Then, 0.6 mL of 0.5 M HCl was added; followed by 1.0 mL of 0.01% NBS for TRAM and MORF; 0.8 and 1.2 mL for NALT and NALB, respectively and then add 0.5 mL of 1.0% KBr. The contents were mixed and then left for 5 min at room temperature, with occasional shaking. Finally, add 0.8, 0.7, 0.6 and 1.1 mL of 5 × 10⁻⁴ M MO for TRAM, MORF, NALT and NALB, respectively. The absorbance of the solution was measured at 508 nm against a blank solution prepared by the same way without drugs.
2.3.2 Method B: using orange G dye
Varying aliquots of standard solution of NALB (1.0–6.0 μg mL−1), NALT (0.5–7.0 μg mL−1), MORF (1.0–6.0 μg mL−1) and TRAM (1.0–7.0 μg mL−1) were transferred into a series of 10 mL volumetric flasks by means of a micro buret. Then, 0.6 mL of 0.5 M HCl was added; followed by 1.0 mL of 0.01% NBS for TRAM, NALT and NALB, and 1.4 mL for MORF and then add 0.5 mL of 1.0% KBr. The contents were mixed and then left for 5 min at room temperature. Finally, add 1.2 mL of 1 × 10⁻³ M of OG for each drug and the solution was allowed to stand at room temperature for 5 min. Complete to 10 mL with distilled water. The absorbance of the solution was measured at 478 nm against a blank solution prepared by the same way without drugs. In either method, the concentration of the unknown was read from the calibration graph or calculated using the regression equation obtained by using Beer’s law.
2.3.3 Procedure for the tablets
Ten tablets of deltrexone (Manufactured by Delta Pharmaceuticals Co., Egypt) each containing 50 mg of NALT were crushed, powdered, weighed out and the average weight of one tablet was determined. An accurate weight equivalent to 20 mg of NALT was dissolved in 20 mL distilled water and then filtered. The filtrate was diluted to 100 mL with distilled water in a 100 mL measuring flask. This solution was further diluted stepwise to the required concentration with water and then analyzed as described under the general procedure. Suitable dilution was made to fit the applicable concentration range and the above described procedures were followed. The nominal content of the tablet was assayed from the calibration curves.
2.3.4 Procedure for ampoules
The content of five nalufin ampoules (20 mg mL−1) of nalbuphine, five morphine ampoules labeled to contain 20 mg mL−1 and five ampoules of TRAM (100 mg/2 mL) (Manufactured by Misr Pharmaceuticals Co., Egypt) were mixed and the average volume of one ampoule was determined. Accurately measured volume equivalent to 20 mg of each drug was transferred into a 100 mL measuring flask and diluted to the mark with distilled water. Suitable dilution was made to fit the applicable concentration range and the above described procedures were followed. The nominal content of the ampoules was calculated either from calibration graph or using the regression equation.
3 Results and discussion
3.1 Optimum conditions
The effects of the reagent concentrations, temperature, mixing time, order of addition with respect to maximum sensitivity, minimum blank adherence to Beer’s law and stability were studied through control experiments. The optimum conditions were established by varying one variable and observing its effect on the absorbance of the colored products.
3.1.1 Absorption spectra
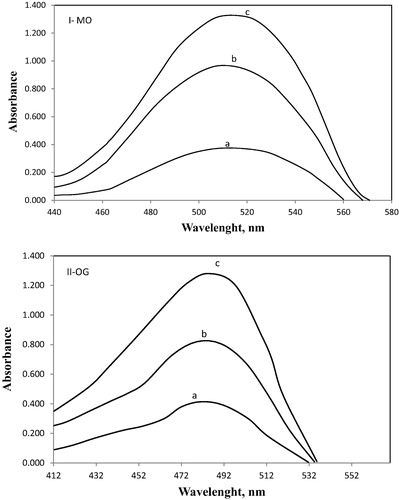
The proposed methods are based on the oxidation of TRAM, MORF, NALT and NALB drugs by adding a known excess of NBS in HCl medium, then left for fixed time to enhance the oxidation process of the drugs. After the oxidation of the drugs was ensured to be complete; then the unreacted NBS was reacted with a fixed quantity of dye (MO and OG) and the resulting change in absorbance was measured at 508 nm for MO and for OG at 478 nm. The decrease in concentration of NBS upon reacting with a fixed concentration of MO and OG resulted in an increase in absorbance at 508 nm and 478 nm respectively, due to the bleaching of dyes by the oxidant, which is related to the drug concentrations and the discoloration being caused by the oxidative destruction of the dyes (). This is observed as a proportional increase in the absorbance of MO and OG with an increase in the concentrations of TRAM, MORF, NALT and NALB, which formed the basis for the assay.
Figure 2 Absorption spectra for I-MO and II-OG. (MO: (a) 1.0 μg mL−1, (b) 2.5 μg mL−1, (c) 4.0 μg mL−1 and II-OG: (a) 1.0 μg mL−1, (b) 3.0 μg mL−1, (c) 5.5 μg mL−1 of MORF.
3.1.2 Chemistry of the reactions
NBS is widely used as an oxidizing or brominating reagent for the determination of many pharmaceutically important compounds (Zenita and Basavaiah, Citation2011; Vinay et al., Citation2011). It is also a specific reagent for the bromination of organic compounds at allylic position (CitationMorison and Boyd, 1992). The analytical reactions involved two steps; the first one was concerned with the treatment of the investigated drugs with a known excess amount of NBS. The second step involved the determination of the excess unreacted NBS via its reaction with a fixed amount of both MO and OG dyes and measuring the absorbance at either 508 nm or 478 nm, respectively. In either method, the absorbance increased linearly with increasing concentration of drugs. The latter methods make use of the bleaching action of NBS on either dye, the discoloration being caused by the oxidative destruction of the dye.
3.1.3 Effect of temperature and mixing time
The effect of temperature was studied by heating a series of sample and blank solutions at different temperatures ranging from 40 to 70 °C in water bath. It was found that raising the temperature does not accelerate the oxidation process and does not give reproducible results, so maximum color intensity was obtained at room temperature. The effect of mixing time required completing oxidation of the studied drugs and for reducing the excess oxidant was studied by measuring the absorbance of sample solution against blank solution prepared similarly at various time intervals 5–30 min, at 508 and 478 nm for methods A and B, respectively. It was found that the contact times gave constant and reproducible absorbance values at 5 min at room temperature (25 ± 2 °C) for each drug. The time required for complete oxidation of the drug is not critical and any delay up to 20 min in the determination of unreacted NBS had no effect on the absorbance. A 5.0 min standing time was found necessary for the complete bleaching of the dye color by the residual NBS for each drug was found necessary for complete reduction of residual NBS by the two dyes.
3.1.4 Selection of acid type and acid concentration
The reactions were tested in HCl, H2SO4, HNO3, and CH3COOH solutions. The results indicate that the reaction is suitable in hydrochloric acid medium. A 0.5 M HCl was found to be adequate for the oxidation of the drugs. The variation in HCl concentration indicated that constant absorbance was obtained with 0.2–2.0 mL of 0.5 M HCl for each drug; so subsequent studies were performed with 0.6 mL of 0.5 M HCl for each drug.
3.1.5 Effect of NBS concentration
The effect of NBS concentration was examined in the range of 0.2–1.4 mL. It was found that maximum color intensity of the products in case of MO was achieved with 1.0 mL of 0.01% NBS for TRAM and MORF, but with 0.8 and 1.2 mL for NALT and NALB, respectively while in case of OG, the maximum color intensity of the products was achieved with 1.0 mL of 0.01% NBS for TRAM, NALT and NALB, but with 1.4 mL for MORF. The color intensity decreased above the upper limit.
3.1.6 Sequence of addition
The best sequence of addition was drug-HCl-NBS-KBr and then the dye. Other sequences gave lower absorbance value under the same experimental conditions.
3.1.7 Effect of KBr concentration
The effect of KBr concentration was studied in the range of 0.5–2.5 mL. 0.5 mL of 1.0% KBr was chosen as the optimal volume to accelerate the oxidation process.
3.1.8 Effect of dye concentration
The effect of MO and OG concentration on the intensity of the color developed was carried out to obtain the optimum concentration of dyes that produces the maximum and reproducible color intensity by reducing the residual of NBS. The effect of concentration of 5 × 10⁻⁴ M of MO was studied in the range of 0.2–1.1 mL. It was found that maximum color intensity of the oxidation products was achieved with 0.8 and 1.1 mL of 5 × 10⁻⁴ M MO for TRAM and NALB, respectively, but with 0.7 mL for MORF and NALT. The effect of concentration of 1 × 10⁻³ M of OG was studied in the range of 0.4–1.4 mL and it was found that the optimum concentration to have maximum absorbance was obtained with 1.2 mL of 1 × 10⁻³ M OG for each drug.
3.2 Method validation
3.2.1 Analytical data
A linear correlation was found between absorbance at λmax and concentration of the studied drugs. The graphs showed negligible intercept and are described by the equation:(where Y = absorbance of 1-cm layer of solution; a = intercept; b = slope and X = concentration in μg mL−1). Regression analysis of Beer’s law data using the method of least squares was made to evaluate the slope (b), intercept (a) and correlation coefficient (r) for each system and the values are presented in . The optical characteristics such as Beer’s law limits, molar absorptivity and Sandell’s sensitivity values of both methods are also given in . The limits of detection (LOD) and quantitation (LOQ) calculated according to ICH guidelines (CitationValidation of Analytical Procedures, 1994) are also presented in and reveal the very high sensitivity of the methods.
Table 1 Optical characteristics, statistical data of the regression equations and validation parameters for the studied drugs (n = 5).
3.2.2 Accuracy and precision
The precision of the proposed methods was calculated in terms of intermediate precision (intra-day and inter-day). Three different concentrations of the studied drugs were analyzed in five replicates during the same day (intra-day precision) and for seven consecutive days (inter-day precision). The analytical results obtained from the investigation are summarized in and . The percentage relative error (RE%) and the percentage relative standard deviation (RSD%) are considered very satisfactory. This level of precision of the proposed methods was adequate for the quality control analysis of the studied drugs.
3.2.3 Robustness
Robustness was examined by evaluating the influence of a small variation of the method variables including the concentration of analytical reagents and reaction time on the performance of the proposed methods. In these experiments, one parameter was changed whereas the others were kept unchanged and the recovery percentage was calculated for each time. It was found that small variations in these variables did not affect the method significantly. This was an indication of the reliability of the proposed method during its routine application for the analysis of the investigated drug and so the proposed spectrophotometric methods are considered robust.
3.3 Analysis of pharmaceutical formulations
The proposed methods have been successfully applied to determine TRAM, MORF, NALT and NALB in tablet and ampoule dosage forms and the results obtained are satisfactorily accurate and precise as indicated by the excellent% recovery ().
Table 4 Assay results of NALB, NALT, MORF and TRAM in pharmaceutical preparations using MO and OG.
4 Conclusion
The proposed methods have the advantages of simplicity and rapidity for the determination of four analgesic drugs in pure, pharmaceutical preparations. The assay methods involve less stringent control of experimental parameters such as the stability of the colored species, time of analysis and temperature independence. The reagents utilized in the proposed methods are cheaper, readily available and the procedures do not involve any tedious sample preparation. These advantages encourage the application of the proposed methods in routine quality control analysis of the selected drugs in pharmaceutical formulations.
Notes
Peer review under responsibility of University of Bahrain.
References
- H.E.AbdellatefM.M.El-HenaweeH.M.El-SayedM.M.AyadSpectrophotometric and spectrofluorimetric methods for analysis of tramadol, acebutolol and dothiepin in pharmaceutical preparationsSpectrochim. Acta Part A65200610871092
- H.M.Abu ShawishS.M.SaadehA.R.Al-DalouN.Abu GhalwaA.A.Abou AssiOptimization of tramadol–PVC membrane electrode using miscellaneous plasticizers and ion – pair complexesMater. Sci. Eng. C312011300306
- S.R.AliP.ChandraM.LatwalS.K.JainV.K.BansalGrowth of cadmium hexacyanidoferrate(III) nanocubes and its application in voltammetric determination of morphineBull. Chem. Soci. Japan84201113551361
- S.M.AnisM.M.HosnyH.E.AbdellatefM.N.El-BalkinySpectrophotometric, atomic absorption and conductometric analysis of tramadol hydrochlorideChem. Ind. Chem. Eng. Q.172011269282
- M.BarrosoM.DiasD.N.VieiraM.López-RivadullaJ.A.QueirozSimultaneous quantitation of morphine, 6-acetylmorphine, codeine, 6-acetylcodeine and tramadol in hair using mixed-mode solid-phase extraction and gas chromatography–mass spectrometryAnal. Bioanal. Chem.396201030593069
- T.BergaE.LundanesA.S.ChritophersenD.H.StrandDetermination of opiates and cocaine in urine by high pH mobile phase reversed phase HPLC–MS/MSJ. Chromatogr. B8772009421432
- British Pharmacopoeia, 2003. Stationary office, Her Majesty’s Stationary Office, London, pp. A136–A137.
- S.BrünenR.KrügerS.FingerF.KorfF.KieferK.WiedemannK.J.LacknerC.HiemkeDetermination of naltrexone and 6-β-naltrexol in human blood: comparison of high-performance liquid chromatography with spectrophotometric and tandem-mass-spectrometric detectionAnal. Bioanal. Chem.396201012491257
- L.J.CaiJ.ZhangX.M.WangR.H.ZhuJ.YangQ.Z.ZhangW.X.PengValidated LC–MS/MS assay for the quantitative determination of nalbuphine in human plasma and its application to a pharmacokinetic studyBiomed. Chromatogr.25201113081314
- P.ChandraA.S.RathoreS.LohidasanK.R.MahadikApplication of HPLC for the simultaneous determination of aceclofenac, paracetamol and tramadol hydrochloride in pharmaceutical dosage formScientia pharmaceutica802012337351
- P.S.FrancisaJ.L.AdcockJ.CostinS.D.PurcellF.M.PfefferN.BarnettChemiluminescence detection of opium poppy (Papaver somniferum) alkaloidsJ. Pharm. Biomed. Anal.482008508518
- M.R.GanjaliZ.MemariF.FaridbodR.DinarvandP.NorouziSm3+ potentiometric membrane sensor as a probe for determination of some pharmaceuticsElectroanalysis20200826632670
- E.M.P.J.GarridoDevelopment of electrochemical methods for the determination of tramadol-analytical application to pharmaceutical dosage formsJ. Pharm. Biomed. Anal.322003975981
- F.Ghorbani-BidkorbehS.ShahrokhianA.MohammadiR.DinarvandSimultaneous voltammetric determination of tramadol and acetaminophen using carbon nanoparticles modified glassy carbon electrodeElectrochim. Acta55201027522759
- D.GroenendaalM.C.M.Blom-RoosemalenM.DanhofE.C.M.de LangeHigh-performance liquid chromatography of nalbuphine, butorphanol and morphine in blood and brain microdialysate samples: application to pharmacokinetic/pharmacodynamic studies in ratsJ. Chromatogr. B8222005230237
- M.HoffmanJ.C.XuC.SmithC.FanelliV.PascalC.DegaetanoA pharmacodynamic study of morphine and its glucuronide metabolites after single morphine dosing in cancer patients with painCancer Invest.151997542547
- F.LiJ.SongD.GaoQ.ZhangD.HanL.NiuSimple and rapid voltammetric determination of morphine at electrochemically pretreated glassy carbon electrodesTalanta792009845850
- F.LiJ.SongC.ShanD.GaoX.XuL.NiuElectrochemical determination of morphine at ordered mesoporous carbon modified glassy carbon electrodeBiosens. Bioelectron.25201014081413
- T.K.MalongoS.PatrisP.MacoursF.CottonJ.NsanguJ.KauffmannHighly sensitive determination of iodide by ion chromatography with amperometric detection at a silver-based carbon paste electrodeTalanta762008540547
- M.MatyusG.KocsisO.BoldisG.KarvalyE.MagyarJ.FureszA.GachalyiDetermination of morphine and codeine in serum after poppy seed consumption using gas chromatography-mass spectrometryActa Chromatogr.242012351365
- R.MehrdadA.KhosrouD.RassoulV.G.SanazA.MohsenA simple and sensitive analytical method for determination of naltrexone level in plasma by GC–MSChromatographia70200914911494
- J.Q.MiX.X.ZhangW.B.ChangDetermination of morphine by capillary zone electrophoresis immunoassay combined with laser-induced fluorescence detectionJ. Immun. Immunochem.2520045770
- R.T.MorisonR.N.BoydOrganic Chemistry1992Prentice-Hall Inc.Upper Saddle River, New Jersey, NJ, USA
- L.H.PaoC.H.HsiongO.Y.HuS.T.HoHigh-performance liquid chromatographic method for the simultaneous determination of nalbuphine and its prodrug, sebacoyldinalbuphine ester, in dog plasma and application to pharmacokinetic studies in dogsJ. Chromatogr. B7462000241247
- C.G.PickD.PaulG.W.PastemakPharmacologic activity of CI-977, a selective kappa opioid agonist, in rhesus monkeysJ. Pharmcol. Exp. Ther.262199210441049
- A.B.RuzilawatiA.L.N.SuzianaG.R.A.HanumW.Y.W.NazirahR.NorzihanaComparison of HPLC and GCMS methods for determination of morphine in human urineJ. Pharmacol. Sci.1182012249P
- G.SaccomanniS.Del CarloM.GiorgiC.ManeraA.SabaM.MacchiaDetermination of tramadol and metabolites by HPLC–FL and HPLC–MS/MS in urine of dogsJ. Pharm. Biomed. Anal.532010194199
- A.SheibaniM.R.ShishehboreE.MirpariziKinetic spectrophotometric method for the determination of morphine in biological samplesSpectrochim. Acta Part A772010535538
- M.H.SlawsonM.ChenD.MoodyS.D.ComerE.S.NuwayserW.B.FangR.L.FoltzQuantitative analysis of naltrexone and 6-β-naltrexol in human, rat, and rabbit plasma by liquid chromatography-electrospray ionization tandem mass spectrometry with application to the pharmacokinetics of depotrex in rabbitsJ. Anal. Toxicol.312007453461
- Validation of Analytical Procedures, 1994. Methodology, International Conference on Harmonization (ICH), pp. 6.
- K.B.VinayH.D.RevanasiddappaO.Z.DeviP.J.RameshK.BasavaiahRapid titrimetric and spectrophotometric determination of ofoxacin in pharmaceuticals using N-bromosuccinimideBraz. J. Pharm. Sci.472011251260
- S.H.WeinsteinM.AlterasJ.GaylordQuantative determination of nalbulhine in plasma using electron-capture detectionJ. Pharm. Sci.671978547548
- Y.C.YooH.S.ChungI.S.KimW.T.JinM.K.KimDetermination of nalbuphine in drug abusers’ urineJ. Anal. Toxicol.191995120123
- O.ZenitaK.BasavaiahUtility of N-bromosuccinimide for the titrimetric and spectrophotometric determination of famotidine in pharmaceutical formulationsInt. J. Anal. Chem.201110.1155/2011/581372
- J.K.ZhangJ.G.LiY.F.TuFlow injection chemiluminescence determination of tramadol hydrochlorideFenxi Kexue Xuebao252009173176