
Abstract
A simple, rapid and selective high performance thin layer chromatography (HPTLC) method was developed for the simultaneous determination of cinnarizine (CNZ) and dimenhydrinate (DMH) in pure form and in their combined dosage form. Reviewing the literature revealed that there are no reports for the use of TLC for the assay of this mixture. Effective separation was achieved using Fluka HPTLC aluminum sheets of silica gel 60 F254 using chloroform–n-hexane–methanol (8.5:0.8:0.7, by volume) as mobile phase, followed by densitometric measurement of CNZ and DMH spots at 254 and 279 nm, respectively. The reliability and analytical performance of the proposed HPTLC method were statistically validated with respect to linearity, ranges, precision, accuracy, selectivity, robustness and detection and quantification limits. Calibration curves were linear in the ranges of 50–400 and 50–500 ng/spot for CNZ and DMH, respectively with correlation coefficients >0.9998. The limits of detection were 8.1 and 8.0 ng/spot for CNZ and DMH respectively. The validated HPTLC method was applied to the simultaneous analysis of CNZ and DMH in laboratory-prepared tablets. Both analytes were successfully quantified with good recovery values, and no interference was encountered from the inactive ingredients.
1 Introduction
Cinnarizine (CNZ) (), chemically known as (E)-1-(Diphenylmethyl)-4-(3-phenylprop-2-enyl)piperazine, is a piperazine derivative with antihistamine, sedative and calcium-channel blocking activity. It is used for the symptomatic treatment of nausea and vertigo caused by Ménière’s disease and other vestibular disorders and for the prevention and treatment of motion sickness. It is also used in the management of various peripheral and cerebral vascular disorders (CitationSweetman, 2009). The British Pharmacopoeia (BP) describes a non-aqueous titration procedure for the assay of CNZ (CitationThe British Pharmacopoeia, 2010). Alternatively, several methods have been described in the literature for the determination of CNZ in its pharmaceutical dosage forms or in biological samples. Examples of these methods are various spectrophotometric and/or chemometric spectrophotometric methods (El-Gindy et al., Citation2004; Metwally et al., Citation2005; Gazy et al., Citation2006; El-Bardicy et al., Citation2008; Abdelrahman, Citation2013"), synchronous fluorescence spectroscopy (CitationWalash et al., 2008), chemiluminescence using flow-injection analysis (CitationTownshend et al., 2003), voltammetry (El-Sayed et al., Citation2008; Hegde et al., Citation2009"), potentiometric membrane sensors (CitationHassan et al., 1996), HPLC with UV detection (El-Gindy et al., Citation2004; Metwally et al., Citation2005; Heda et al., Citation2010; Navaneethan et al., Citation2013"), HPLC with fluorescence detection (Angelov and Christova-Bagdassarian, Citation2003; Nowacka-Krukowska et al., Citation2007") and capillary electrophoresis (CitationAbdelal et al., 2008). Few articles reported the HPTLC determination of pharmaceutical mixtures containing CNZ with piracetam (CitationMetwally et al., 2005) and domperidone (Argekar and Powar, Citation1999; Bagade et al., Citation2005; Vinodhini et al., Citation2005").
Figure 1 Chemical structures of cinnarizine (CNZ) and dimenhydrinate (DMH).
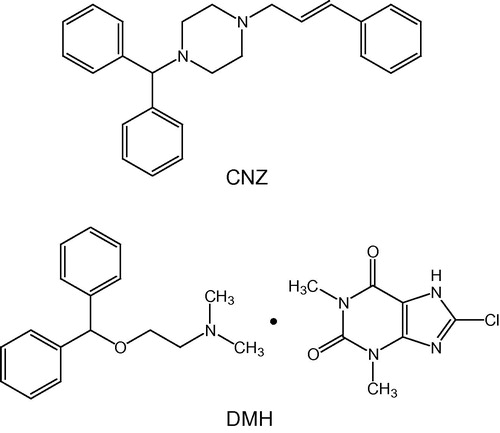
Dimenhydrinate (DMH) () is the diphenhydramine salt of 8-chlorotheophylline. It is chemically known as 8-chloro-3,7-dihydro-1,3-dimethyl-1H-purine-2,6-dione compound with 2-(diphenylmethoxy)-N,N-dimethylethanamine (1:1) (CitationMoffat et al., 2004). DMH is an antihistamine with antimuscarinic and significant sedative effects. It is mainly used as an antiemetic in the prevention and treatment of motion sickness. It is also used for the symptomatic treatment of nausea and vertigo caused by Ménière’s disease and other vestibular disturbances (CitationSweetman, 2009). The DMH monograph in the BP describes titration procedures for the assay of the bulk powder and tablets (CitationThe British Pharmacopoeia, 2010). On the other hand, the United States Pharmacopeia (USP) suggests a titration procedure for the bulk form, while HPLC is recommended for the assay of all DMH dosage forms (CitationThe United States Pharmacopeia, 2011). The quantification of DMH in various drug formulations and/or biological samples was addressed in some reports. Analytical methodology in these reports involved the use of spectrophotometry (Kar and Aniuha, Citation1981; Mitic et al., Citation2012"), UV spectroscopic multisensor with the aid of partial least squares (PLS) regression (CitationCañada et al., 1999), adsorptive stripping voltammetry (CitationShubietah et al., 1999), capillary electrophoresis (CitationOng et al., 1991), liquid chromatography-tandem mass spectrometry (LC-MS-MS) (CitationTavares et al., 2007), HPLC with fluorescence detection (CitationÖzkan et al., 2013) and HPLC with UV detection (Barbas et al., Citation2000; Döge and Eger, Citation2007"). Only a single published paper reported the HPTLC determination of DMH in tablets (CitationDiGregorio et al., 2000).
CNZ (20 mg) and DMH (40 mg) are co-formulated in a fixed-dose combination tablets for treatment of vestibular vertigo of central and/or peripheral origin. The efficacy of the fixed combination exceeded that of each of the equally dosed active substances given as monotherapy (CitationHahn et al., 2011; Arlevert webpage). Few reports can be found in the scientific literature for the simultaneous determination of CNZ and DMH. These reports presented HPLC with UV detection (CitationPatel et al., 2012) and spectrophotometric methods (Shah and Patel, Citation2012a,Citationb"). To the best of our knowledge, no attempts have yet been made to assay this drug combination by any TLC method. HPTLC is becoming a routine analytical technique due to its advantages of low operating cost, high sample throughput, and minimum sample clean up. The major advantage of HPTLC is that several samples can be run simultaneously using a small quantity of mobile phase unlike HPLC, thus lowering analysis time and cost per analysis. The aim of this work is the development of a simple, rapid and reliable HPTLC procedure for the simultaneous estimation of CNZ and DMH in pure form and in tablets.
2 Experimental
2.1 Instrumentation and chromatographic conditions
The samples were spotted in the form of bands with a Cammag microliter syringe under nitrogen stream using a Cammag Linomat IV sample applicator (Switzerland). Precoated TLC silica gel aluminum plates 60 F254 (20 × 20 cm, 200 μm thickness, Fluka, Switzerland) were used. Development was performed in a Cammag twin trough glass chamber (20 × 20 cm) saturated with the mobile phase. The mobile phase (20 mL) was chloroform:n-hexane:methanol (8.5:0.8:0.7, v/v/v). The optimized chamber saturation time for mobile phase was 30 min at room temperature (25 ± 2 °C). Densitometric scanning was performed on Cammag TLC scanner III operated by CATS software (V 3.15 CAMAG). The source of radiation utilized was deuterium lamp emitting a continuous UV spectrum between 190 and 400 nm. The obtained spots were scanned at three wavelengths 220, 254 and 279 nm.
2.2 Materials
Pharmaceutical grades of CNZ and DMH were kindly supplied by Amriya Pharmaceutical Industries, Alexandria, Egypt. Analytical grade of all solvents was used including methanol (Fine-Chem Limited, Mumbai, India), n-hexane (Carlo-Erba Reagents, SDS, France) and chloroform (BDH Chemicals Ltd, Poole, England). The formulation assayed in the study was laboratory-prepared tablets each containing 20 mg CNZ and 40 mg DMH. The prepared tablets contained maize starch, microcrystalline cellulose (Avicel), magnesium stearate, hydroxypropylmethylcellulose (HPMC) and colloidal silica (Aerosil) in the ratio 150:50:7:1.5:1.5 (by weight) respectively as tablet fillers. These tablet fillers were obtained from Pharco Pharmaceuticals Co., Alexandria, Egypt.
2.3 General procedure
CNZ stock solution (500 μg/mL) and DMH stock solution (500 μg/mL) were prepared in methanol. The working solutions were prepared by dilution of the stock solutions with methanol to reach the concentration ranges 10–80 and 10–100 μg/mL for CNZ and DMH respectively. From each working standard solution, 5-μL portions were spotted as bands on HPTLC plate to obtain final concentrations of 50–400 and 50–500 ng/spot for CNZ and DMH, respectively. Triplicate applications were made for each solution. The plate was then developed using the previously described mobile phase. The peak areas of CNZ and DMH at 254 and 279 nm, respectively were plotted against the corresponding concentrations to obtain the calibration graph for each compound.
2.4 Assay of laboratory-prepared tablets
A total of 10 tablets were weighed and finely powdered. To an accurately weighed quantity of the powder equivalent to 25 mg CNZ and 50 mg DMH, 25 mL methanol were added, stirred for 20 min then filtered into a 50-mL volumetric flask. The residue was washed with two 10 mL portions of methanol and washings were added to the filtrate and diluted to volume with the same solvent. Aliquots of the tablet solution were diluted with methanol to obtain final concentrations within the previously mentioned concentration ranges. From each working sample solution, 5-μL portions were spotted as bands on HPTLC plate to obtain final concentrations within the specified ranges (50–400 and 50–500 ng/spot for CNZ and DMH, respectively), and then chromatographed using the conditions mentioned earlier. Recovery values were calculated from similarly treated external standard solutions. For standard addition assay, sample solutions were spiked with aliquots of standard solutions of both compounds to obtain total concentrations within the previously specified ranges then treated as under General procedure. Recovered concentrations were calculated by comparing the analyte response with the increment response attained after addition of the standard.
3 Results and discussion
3.1 Optimization of HPTLC densitometric method
The experimental conditions, such as mobile phase composition and wavelength of detection were optimized to achieve the best separation between CNZ and DMH, together with the separation of the components of DMH (diphenhydramine and 8-chlorotheophylline). Various solvent systems were carefully evaluated to reach an optimum resolution of the mixture components. Initially, methylene chloride and methanol or ethanol in different ratios were tried but insufficient separation between 8-chlorotheophylline and CNZ occurred even upon the addition of minute amounts of acetic acid or ammonia to the mobile phase. In these previous trials, diphenhydramine was easily separated however 8-chlorotheophylline and cinnarizine were not adequately resolved. Retardation factors (Rf) were about 0.15, 0.74 and 0.78 for diphenhydramine, 8-chlorotheophylline and cinnarizine, respectively. Replacing methylene chloride by chloroform in different ratios with methanol resulted in a slight improvement that happened only in a ratio of chloroform and methanol (9:1, v/v). This improvement was demonstrated by the slightly better resolution between 8-chlorotheophylline and cinnarizine (Rf = 0.69 and 0.76, respectively). Again, addition of minute amounts of acetic acid or ammonia to the aforementioned mobile phase did not improve the separation. On the other hand, addition of n-hexane or toluene to the same mobile phase produced substantial improvement in both separation and peak characteristics. The optimized solvent system consisting of chloroform:n-hexane:methanol (8.5:0.8:0.7, v/v/v) showed an acceptable TLC resolution and gave compact spots together with sharp and well defined symmetrical peaks for all separated components.
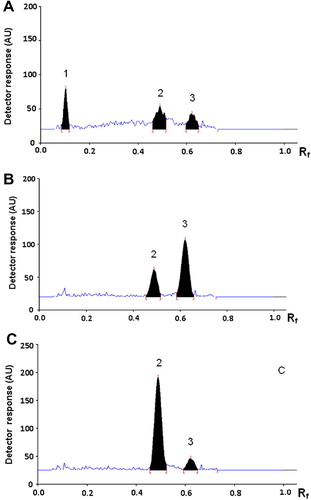
The densitometric scanning wavelengths were optimized in order to achieve the highest sensitivity for quantification of both drugs. CNZ exhibits an absorption band with maximum at 254 nm which was chosen for its measurement. DMH is resolved into two components: the diphenhydramine component is a weak UV absorbing compound with measurable absorbance only in the short UV region (below 230 nm); consequently, 220 nm was found suitable to detect its peak. On the other hand, the 8-chlorotheophylline shows an absorption spectrum with prominent maximum at 279 nm which was selected for its measurement. shows typical HPTLC chromatograms for the separation of standard mixture of CNZ and DMH using the optimized conditions. As illustrated in , peaks of diphenhydramine, 8-chlorotheophylline and cinnarizine appear at retardation factor (Rf) values of 0.10, 0.49 and 0.62, respectively. It is reported that a resolution value of 1 implies almost complete separation between two successive peaks, and a resolution of 1.25 is sufficient for quantitative measurements (CitationSpangenberg et al., 2011). Resolution values were found to be 4.59 between diphenhydramine and 8-chlorotheophylline peaks, and 1.37 between 8-chlorotheophylline and cinnarizine peaks.
Figure 2 HPTLC chromatograms of a mixture of 200 ng/spot CNZ and 400 ng/spot DMH at 220 nm (A), 254 nm (B) and 279 nm (C). The peaks correspond to diphenhydramine (1), 8-chlorotheophylline (2) and cinnarizine (3).
Taking into consideration the range of concentrations applied and number of tracks, the optimum band width was 6 mm and the best interspaces between bands were 5 mm. The spots appeared more compact and peak shapes were more symmetrical when the HPTLC plates were pretreated with methanol and activated at 80 °C for 10 min. Well defined spot for each compound was obtained when the developing chamber was saturated for 30 min at room temperature.
3.2 Validation of the proposed method
The proposed method was validated according to the International Conference on Harmonization (ICH) guidelines on validation of analytical procedures (CitationICH, 2005).
3.2.1 Linearity and concentration ranges
The linearity of the proposed HPTLC procedure was evaluated by analyzing a series of different concentrations for each of the two analytes. The linear regression equations were generated by least squares treatment of the calibration data. In case of DMH, peaks of the 8-chlorotheophylline component at 279 nm provide higher area values and more reliable measurement than those of diphenhydramine at 220 nm; therefore quantification of DMH was based on measurement of 8-chlorotheophylline peak areas at 279 nm. Under the optimized conditions described above, the measured peak areas at 254 and 279 nm were found to be proportional to concentrations of CNZ and DMH, respectively. presents the performance data and statistical parameters including linear regression equations, concentration ranges, correlation coefficients, standard deviations of the intercept (Sa), slope (Sb) and standard deviations of residuals (Sy/x). Regression analysis shows good linearity as indicated from the correlation coefficient values (>0.9998). In addition, deviation around the slope can be further evaluated by calculation of the RSD% of the slope (Sb%) which were found to be less than 1.1%. In addition to the previous parameters, linearity can be further guaranteed by the analysis of variance (ANOVA) test (CitationMiller and Miller, 2000). The most important statistic in this test is the F-value which is the ratio of the mean of squares due to regression divided by the mean of squares due to residuals. High F values reveal an increase in the mean of squares due to regression and a decrease in the mean of squares due to residuals. The greater the mean of squares due to regression, the steeper is the regression line. The smaller the mean of squares due to residuals, the less is the scatter of experimental points around the regression line. Consequently, regression lines with high F values (low significance F) are much better than those with lower ones. Good regression lines show high values for both r and F statistical parameters.
Table 1 Analytical parameters for the determination of CNZ–DMH mixture using the proposed HPTLC method.
3.2.2 Detection and quantification limits
Limit of detection (LOD) was defined as 3.3 Sa/b and limit of quantification (LOQ) was computed as 10 Sa/b, where Sa is the standard deviation of the intercept and b is the slope of the calibration curve. The sensitivity of the proposed method can be confirmed by the low LOD and LOQ values obtained ().
3.2.3 Precision and accuracy
The within-day repeatability of the proposed method was assessed through the analysis of three concentration levels for each drug prepared in triplicates. Correspondingly, the between-day precision was studied on the same levels over three consecutive days. shows the values of percentage relative standard deviation (RSD%) which did not exceed 1% for both drugs indicating the high level of precision of the proposed method. The adequate recovered concentrations in addition to the low values of percentage relative error (Er%) gathered in also confirm the accuracy of the developed method.
Table 2 Precision and accuracy for the determination of CNZ and DMH in bulk form using the proposed HPTLC method.
3.2.4 Selectivity
Method selectivity was examined by preparing several laboratory-prepared mixtures of the two compounds at various concentrations within the linearity ranges mentioned in . These mixtures were of different ratios both above and below the normal ratio expected in the dosage form (CNZ–DMH 1:2). The laboratory-prepared mixtures were analyzed according to the previously described procedure. The analysis results including percentage relative standard deviation (RSD%) and the percentage relative error (Er%) values shown in were satisfactory thus validating the selectivity, precision and accuracy of the developed method and demonstrating its capability to resolve and quantify the analytes in different ratios.
Table 3 Determination of CNZ–DMH laboratory-prepared mixtures using the proposed HPTLC method.
3.2.5 Robustness
The robustness of an analytical procedure is a measure of its capability to remain unaffected by small but deliberate variations in method parameters and provides an indication of its reliability during normal usage (CitationICH, 2005). Robustness was examined by making small changes in the mobile phase composition and volume. The ratios of the two minor components of the mobile phase (n-hexane and methanol) were slightly changed (±2%); also different mobile phase volumes were tested (±5 mL). It was found that variation in the studied parameters had no significant influence on the separation and quantification of CNZ and DMH using the proposed method. In these experiments, the drugs were effectively separated with almost unchanged retardation factors (Rf) (). Moreover, values of RSD% of the peak areas of both drugs under the investigated changes did not exceed 0.4% (). The low values of RSD% of peak areas along with obviously unaffected Rf values indicated the robustness of the developed method.
Table 4 Robustness of the proposed HPTLC method for determination of CNZ and DMH.
3.2.6 Stability of solutions
The stability of working solutions in the diluting solvent (methanol) was examined and no chromatographic changes were observed within 24 h at room temperature. Chromatographic parameters including Rf values and peak areas of the drugs remained almost unchanged and no significant degradation was observed during this period. Also, the stock solutions prepared in methanol were stable for at least two weeks when stored refrigerated at 4 °C.
3.3 Analysis of pharmaceutical dosage form
Due to the unavailability of the commercial tablets in the local market, laboratory-made tablets were prepared and analyzed by the proposed HPTLC method. The active ingredients (CNZ and DMH) eluted at their specific Rf values. No interfering peaks were observed from any of the inactive ingredients. Peak purity was verified by comparing the absorption spectra of each drug obtained from tablets analysis with those of the drug standard solution. The spectra were found identical and superimposable as shown in . Furthermore, a methanol extract of the inactive ingredients used in the preparation of tablets (maize starch, microcrystalline cellulose, magnesium stearate, HPMC and colloidal silica) was chromatographed using the developed procedure then scanned at the working wavelengths. The chromatograms of the inactive ingredients extract illustrated in reveal the absence of any interfering peaks which can be considered further evidence for selectivity of the proposed method for the assay of CNZ and DMH. Recovered concentrations were calculated using both external standard and standard addition methods (Tables and ). For the external standard analysis, the contents of both drugs in tablets were determined by analysis of three independently prepared solutions each repeated 5 times, and recovered (found) concentrations were calculated using similarly treated standard solutions (). For the standard addition analysis, tablet solutions were spiked with different portions of standard solutions of the two drugs at three levels: 50%, 100% and 200% of the nominal concentration; and the assay of each solution was repeated 5 times (). The assay results revealed satisfactory accuracy and precision as indicated from the recovered (found) concentrations, SD, RSD% and Er% values. It is evident from these results that the proposed method is applicable to the assay of this fixed dose combination with satisfactory level of selectivity, accuracy and precision.
Figure 3 Overlay spectra of standard and sample 200 ng/spot CNZ (A) and 400 ng/spot DMH (B).
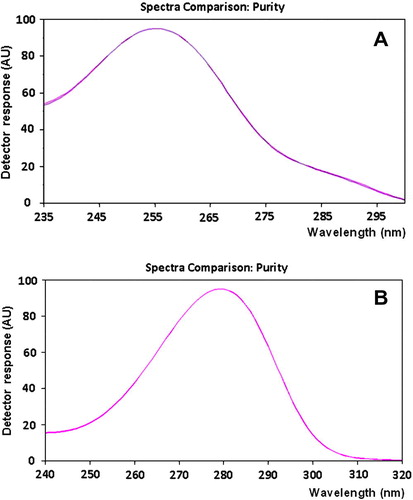
Figure 4 HPTLC chromatograms of the inactive ingredients extract at 254 nm (A) and 279 nm (B).
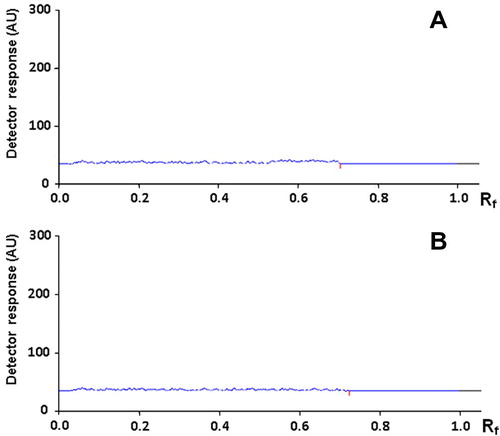
Table 5 Application of the proposed HPTLC procedure to the analysis of CNZ–DMH mixture in laboratory prepared tablets using the external standard method.
Table 6 Application of the proposed HPTLC procedure to the analysis of CNZ–DMH mixture in laboratory prepared tablets using the standard addition method.
4 Conclusion
This study described a simple, selective and reliable HPTLC procedure for the simultaneous determination of cinnarizine and dimenhydrinate. Very few reports can be found for the analysis of this recently introduced pharmaceutical mixture. Reviewing the literature exposed that there were no reports for the application of a TLC-based method for the assay of this mixture. Obviously, the described HPTLC method offers selectivity advantage over the previously published spectrophotometric non-separation methods (Shah and Patel, Citation2012a,Citationb"). Moreover, the proposed method does not require elaborate treatment or sophisticated experimental setup usually associated with HPLC methods of analysis. The HPTLC method uses a minimal volume of solvents and is suitable for use in quality control laboratories where economy and time are essential. Reliability was guaranteed by testing various validation parameters of the proposed method and successful application to laboratory prepared tablets without interference from commonly encountered dosage form additives. Finally, the proposed method was found accurate and precise; hence, it can be recommended for the routine analysis of the studied drugs either in bulk form or in their combined tablet dosage forms.
Notes
Peer review under responsibility of University of Bahrain.
References
- A.A.AbdelalS.KitagawaH.OhtaniN.El-EnanyF.BelalM.I.WalashMethod development and validation for the simultaneous determination of cinnarizine and co-formulated drugs in pharmaceutical preparations by capillary electrophoresisJ. Pharm. Biomed. Anal.4632008491497
- M.M.AbdelrahmanSimultaneous determination of Cinnarizine and Domperidone by area under curve and dual wavelength spectrophotometric methodsSpectrochim. Acta, Part A1132013291296
- T.AngelovV.Christova-BagdassarianHigh-performance liquid chromatographic determination of cinnarizine in workplace airChromatographia587–82003483485
- A.P.ArgekarS.G.PowarSimultaneous HPTLC determination of cinnarizine and domperidone maleate in formulationsJ. Planar Chromatogr.--Mod. TLC1241999272274 Arlevert information from the webpage: http://www.mhra.gov.uk/home/groups/l-unit1/documents/websiteresources/con014026.pdf
- S.B.BagadeS.G.WalodeM.S.ChardeM.R.TajneA.V.KastureSimultaneous HPTLC estimation of cinnarizine and domperidone in their combined dose tabletAsian J. Chem.172200511161126
- C.BarbasA.GarcíaL.SaavedraM.CastroOptimization and validation of a method for the determination of caffeine, 8-chlorotheophylline and diphenhydramine by isocratic high-performance liquid chromatography. Stress test for stability evaluationJ. Chromatogr. A8701–2200097103
- M.J.A.CañadaM.I.P.RegueraA.M.DíazL.F.Capitán-VallveySolid-phase UV spectroscopic multisensor for the simultaneous determination of caffeine, dimenhydrinate and acetaminophen by using partial least squares multicalibrationTalanta4931999691701
- D.DiGregorioE.WestgateJ.ShermaAnalysis of the active ingredient dimenhydrinate in motion-sickness tablets by high-performance thin-layer chromatography with ultraviolet absorption densitometryActa Chromatogr.102000190194
- U.DögeK.EgerA simple HPLC-UV method for the determination of dimenhydrinate and related substances – identification of an unknown impurityPharmazie6232007174178
- M.G.El-BardicyH.M.LotfyM.A.El-SayedM.F.El-TarrasSmart stability-indicating spectrophotometric methods for determination of binary mixtures without prior separationJ. AOAC Int.9122008299310
- A.El-GindyS.EmaraA.MostafaSpectrophotometric and LC determination of two binary mixtures containing antihistaminsFarmaco5992004713722
- G.O.El-SayedS.A.YasinA.A.El BadawyVoltammetric behavior and determination of cinnarizine in pharmaceutical formulations and serumAnal. Lett.4117200830213033
- A.A.GazyE.M.HassanM.H.Abdel-HayT.S.BelalSimultaneous determination of cinnarizine and domperidone maleate using H-point standard additions method, derivative and derivative-ratio spectrophotometryBull. Fac. Pharm., Cairo Univ.4422006175184
- A.HahnM.NovotnýP.M.ShotekovZ.CirekI.Bognar-SteinbergW.BaumannComparison of cinnarizine dimenhydrinate fixed combination with the respective monotherapies for vertigo of various origins: a randomized, double-blind, active-controlled, multicentre studyClin. Drug Invest.3162011371383
- S.S.M.HassanR.M.Abdel-AzizA.B.AbbasPotentiometric membrane sensors for the selective determination of cinnarizine in pharmaceutical preparationsAnal. Chim. Acta321119964752
- A.A.HedaA.R.SonawaneG.H.NaranjeP.K.PuranikA rapid determination of cinnarizine in bulk and pharmaceutical dosage form by LCE.-J. Chem.73201010801084
- R.N.HegdeR.R.HosamaniS.T.NandibewoorVoltammetric oxidation and determination of cinnarizine at glassy carbon electrode modified with multi-walled carbon nanotubesColloids Surf., B7222009259265
- ICH, Q2A (R1), Validation of Analytical Procedures: Text and Methodology, International Conference on Harmonisation, November 2005. http://www.ich.org/fileadmin/Public_Web_Site/ICH_Products/Guidelines/Quality/Q2_R1/Step4/Q2_R1__Guideline.pdf.
- A.KarG.I.AniuhaSpectrophotometric determination of dimenhydrinate with Reinecke saltJ. Pharm. Sci.7061981690691
- F.H.MetwallyB.A.ElzeanyH.W.DarwishNew methods for determination of cinnarizine in mixture with piracetam by spectrodensitometry, spectrophotometry, and liquid chromatographyJ. AOAC Int.886200516661676
- J.N.MillerJ.C.MillerStatistics and chemometrics for analytical chemistryfourth ed.2000Pearson Education LimitedEngland pp. 126–137
- S.S.MiticG.Z.MileticA.N.PavlovicE.T.PecevD.S.VelimirovicQuantitative estimation of dimenhydrinate in pharmaceuticals and human control serum using ligand-exchange reactionOxid. Commun.3542012856868
- A.C.MoffatM.D.OsseltonB.WiddopClark’s Analysis of Drugs and Poisons2004The Pharmaceutical PressLondon, UK926927 2
- G.NavaneethanK.KarunakaranK.P.ElangoStability indicating and simultaneous determination of cinnarizine and piracetam from capsule dosage form by reversed phase high performance liquid chromatographyIndian J. Chem. Technol.2052013323326
- H.Nowacka-KrukowskaM.RakowskaK.NeubartM.KobylińskaHigh-performance liquid chromatographic assay for cinnarizine in human plasmaActa Pol. Pharm.-Drug Res.6452007407411
- C.P.OngC.L.NgH.K.LeeS.F.Y.LiDetermination of antihistamines in pharmaceuticals by capillary electrophoresisJ. Chromatogr. A5881–21991335339
- C.K.ÖzkanU.TaşdemirC.TaşA.SavaşerH.ErolY.ÖzkanDetermination of dimenhydrinate nasal delivery system in the blood by RP-LCChromatographia7621–22201315211525
- A.P.PatelH.K.KadikarR.R.ShahD.P.PatelP.K.TankAnalytical method development and validation of RP-HPLC method for simultaneous estimation of cinnarizine and dimenhydrinate in combined dosage formPharma. Sci. Monitor.3201225862600 (4 Supply 1)
- P.B.ShahP.U.PatelQ-absorbance ratio spectrophotometric method for the simultaneous estimation of cinnarizine and dimenhydrinate in their combined dosage formJ. Pharma. Sci. Biosci. Res.2220128387
- P.B.ShahP.U.PatelFirst derivative spectrophotometric method for the simultaneous estimation of cinnarizine and dimenhydrinate in their combined dosage formInt. J. Univers. Pharm. Life Sci.222012238247
- R.M.ShubietahA.Z.Abu ZuhriA.G.FoggAdsorptive stripping voltammetric determination of dimenhydrinate at a hanging mercury drop electrodeMicrochim. Acta13031999165171
- B.SpangenbergC.F.PooleC.WeinsQuantitative Thin-Layer Chromatography2011Springer-Verlag, Berlin HeidelbergGermany p. 37
- S.C.SweetmanMartindale-The Complete Drug Reference36th ed.2009The Pharmaceutical PressLondon, UK573576 p. 1
- V.TavaresC.C.MacedoL.MontanhezF.A.P.BarrosE.C.MeurerD.R.CamposE.C.CoelhoS.A.CalaffatiJ.PedrazzoliJr.Determination of dimenhydrinate in human plasma by liquid chromatography-electrospray tandem mass spectrometry: application to a relative bioavailability studyJ. Chromatogr., B: Anal. Technol. Biomed. Life Sci.8531–22007127132
- The British Pharmacopoeia, 2010. Her Majesty’s Stationery Office, London, pp. 507–508, 703–704, 2620.
- The United States Pharmacopeia, 34th edition, The National Formulary, 29th edition, 2011. The Official Compendia of Standards, The United States Pharmacopeial Convention, Rockville, MD, pp. 2587–2589. .
- A.TownshendN.YoungvisesR.A.WheatleyS.LiawruangrathFlow-injection determination of cinnarizine using surfactant-enhanced permanganate chemiluminescenceAnal. Chim. Acta4991–22003223233
- C.VinodhiniA.S.KalidossV.VaidhyalingamSimultaneous estimation of cinnarizine and domperidone by high performance thin layer chromatography in tabletsIndian Drugs4292005600603
- M.I.WalashF.BelalN.El-EnanyA.A.AbdelalSecond-derivative synchronous fluorometric method for the simultaneous determination of cinnarizine and domperidone in pharmaceutical preparations. Application to biological fluidsJ. Fluoresc.18120086174