
 ?Mathematical formulae have been encoded as MathML and are displayed in this HTML version using MathJax in order to improve their display. Uncheck the box to turn MathJax off. This feature requires Javascript. Click on a formula to zoom.
Abstract
A fast, simple, sensitive cathodic adsorptive stripping voltammetric procedure for quantitative analysis of Cd–oxine complex in al-Madinah city water samples and human plasma is described. The technique involves adsorptive accumulation of the complex on the working electrode, followed by square wave voltammetric determination of the preconcentrated analyte. In basic media, a cathodic electrochemical process involving the elimination of two protons occurs, and a mechanism for the reduction process is suggested. The optimal experimental parameters for assay of this complex are: carbonate supporting electrolyte pH 8, accumulation time 30 s, accumulation potential −0.1 V, scan rate 200 mV s−1, pulse amplitude 80 mV, frequency 40 Hz, surface area of working electrode 0.6 mm2 and convection rate 1000 rpm. The calibration graph for determination of Cd–oxine was linear over the concentration range 5 × 10⁻⁸ to 4 × 10⁻⁷ mol l−1 (r = 0.998), with a detection limit of 3.5 × 10⁻⁹ mol l−1. The precision of the proposed procedure was estimated by 10 successive voltammetric measurements of 2 × 10⁻⁶ mol l−1 Cd with 4 × 10⁻⁶ mol l−1 oxine, and the calculated relative standard deviation was 0.39%. The percentage recovery, indicating the accuracy of the analytical method, was 94 ± 1.0%. Possible interference by several substances, including metals and ligands, was also evaluated. The electroanalytical method was successfully applied to assaying cadmium in water samples and biological fluids such as plasma.
1 Introduction
In voltammetry, current rather than voltage curves are recorded when a gradually changing voltage is applied to a cell containing the solution of interest, a stable reference electrode and a small-area working or indicator electrode. Usually, the voltage is increased linearly with time. Such curves are known generically as voltammograms. In the special case in which the indicator electrode is a dropping mercury electrode, introduced by J. Heyrovsky in 1922, the technique is known as “polarography”, and the current-versus-voltage curves are called “polarograms”. Stripping voltammetry is considered a voltammetric technique. The sensitivity of voltammetric techniques for cations of amalgam-forming metals and for anions forming slightly soluble compounds with mercury can be increased by accumulating the material within the electrode (as an amalgam) or at the surface of the electrode by pre-electrolysis [Citation1]. Cathodic stripping voltammetric (CSV) is one type of stripping voltammetry used to measure a wide range of organic and inorganic compounds capable of forming insoluble salts with mercury, including various thiols and penicillins, halide ions, cyanide and sulfide [Citation2]. Many reviews have emphasized and illustrated the wide spectrum and scope of CSV applications and its potential in the analysis of metal ions [Citation3,Citation4], organic analytes [Citation5], pharmaceutical drugs and biomedical compounds [Citation6,Citation7].
Heavy metals such as cadmium, lead and mercury are present at rapidly increasing, alarming levels, particularly in rivers and inshore waters where industrial wastes are discharged, and they tend to concentrate in all matrices [Citation8]. Mining, pouring, casting, processing and metal use have led to their dispersion into the general environment. Ingestion of food and beverages contaminated with heavy metals can impair the health of the general population [Citation9]. Heavy metals have been extensively investigated by atomic adsorption spectrometry [Citation10,Citation11], atomic emission spectrometry [Citation12] and ion chromatography techniques [Citation13,Citation14]; however, these techniques have certain defects, such as complicated operation, high cost of maintenance and expensive apparatus requiring well-controlled experimental conditions.
Cadmium has been determined in various samples by several analytical methods, including spectrophotometry [Citation15–Citation18], stripping voltammetry and square wave voltammetry in water samples in the presence of different chelating agents [Citation19–Citation21]. We optimized certain experimental conditions and propose a voltammetric method for determination of cadmium (II) in al-Madinah natural water. The method is convenient and is more sensitive, has a lower detection limit and cost less than other methods.
2 Materials and methods
2.1 Apparatus
Cathodic adsorptive stripping, polarography and cyclic voltammetry measurements were carried out with 797 AV Computrace (Metrohm, Switzerland) connected to a Dell computer and controlled by VA Computrace 2.0 control software. Cathodic voltammograms were printed on a HP Color Laserjet 1215 printer. A conventional three-electrode system was used in the hanging mercury drop electrode (HMDE) mode. pH values were measured on a Hanna pH 211 (Romania). Biohit adjustable micropipettes and Brand adjustable micropipettes (Germany) were used to measure microlitre volumes of standard solutions and of all analyzed samples. A Labofuge 200 Heraeus Sepatech (Germany) centrifuge was used to prepare biological fluids for voltammetric analysis.
2.2 Reagents
A cadmium stock solution at 1 × 10⁻³ mol l−1 was prepared by dissolving the appropriate amount of Cd(NO3)2 in distilled water, and an oxine stock solution of 1 × 10⁻³ mol l−1 was prepared by dissolving the appropriate amount of oxine (8-hydroxyquinoline) in ethanol in 25-ml volumetric flasks. These stock solutions were stored in the dark. Standard solutions of lower concentrations were prepared daily by diluting the stock solution with distilled water and ethanol. Britton-Robinson supporting buffer (pH ≈ 2, 0.04 mol l−1 in each constituent) was prepared by dissolving 2.47 g of boric acid (Winlab, UK) in 500 ml distilled water containing 2.3 ml of glacial acetic acid (Winlab, UK) and then adding 2.7 ml of o-phosphoric acid (Riedal-deHaen, Germany) and diluting to 1 l with distilled water. The carbonate buffer was made up to 0.1 mol l−1 in both sodium hydrogen carbonate (Winlab, UK) and disodium carbonate (BDH, UK), while phosphate buffer was prepared from 0.1 mol l−1 in both phosphoric acid (Riedal-deHaen, Germany) and sodium dihydrogen phosphate (Winlab, UK). The acetate buffer was prepared from 0.02 M in both sodium acetate (Winlab, UK) and acetic acid (Winlab, UK).
2.3 Procedure
The general procedure for obtaining cathodic adsorptive stripping voltammograms was as follows: A 10 ml aliquot of carbonate supporting buffer (unless otherwise stated) at the desired pH was pipetted into a clean, dry voltammetric cell, and the required standard solutions of complex were added. The test solutions were purged with nitrogen for 3 min initially, while the solution was stirred. The accumulation potential of −0.1 V vs. Ag/AgCl was applied to a HMDE, and the solution was stirred for 30 s. After the preconcentration period, cathodic stripping was stopped, and, after 10 s, cathodic scans were carried out over the range −0.3 to −1.2 V. All voltammetric measurements were carried out at room temperature.
2.4 Analysis of Cd–oxine in spiked human plasma
Accurately measured aliquots of complex solutions were pipetted into centrifugation tubes containing 500 μl human plasma and vortexed for 5 min. Into each tube, 0.5 ml methanol, 0.1 ml NaOH (0.1 M) and 0.5 ml ZnSO4·7H2O (5%, w/v) [Citation22] were added, and the tubes were then centrifuged for 8 min at almost 4000 rpm. The clear supernatant layer was filtered through a 0.45–μm ml pore filter. A 0.1-ml volume of the supernatant liquor was transferred into the voltammetric cell and brought up to 10 ml with a carbonate pH 8 universal buffer. The complex was quantified by the proposed cathodic stripping voltammetric method.
3 Results and discussion
3.1 Voltammetric behaviour of Cd–oxine complex
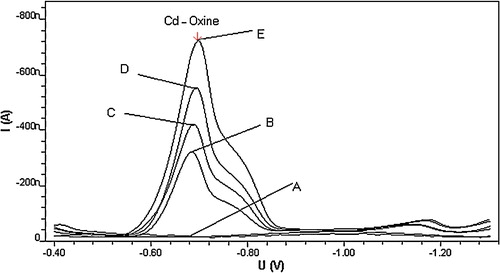
In order to evaluate the cathodic voltammetric behaviour for complexes, Cd2+ was applied alone. It did not yield a cathodic reduction response on the working mercury electrode at the suggested complex potential, as can be seen from , which shows a flat background line (A) for 3 × 10⁻⁷ mol l−1 Cd2+ in pH 8.0 carbonate buffer. The addition of 5 × 10⁻⁷ mol l−1 oxine ligand to the metal test solution, however, resulted in a well-defined line (B) with a cathodic peak at −700 mV (versus Ag/AgCl reference electrode). The oxine ligands exhibited strong affinity to Cd ions, forming a highly stable Cd–oxine complex, which was strongly adsorbed onto the HMDE surface. A well-developed cathodic stripping voltammetric peak was found to respond sharply to the addition of either Cd2+ or oxine (lines C, D and E), probably reflecting formation and adsorption of the suggested complex. The observed CSV peak is probably due to cathodic reduction of Cd2+ in the adsorbed complex with oxine ligand. The electrochemical mechanism of this reduction process for Cd–oxine complex is described by the following equation:Cd(ox)2 + 2e– = Cd(Hg) + 2ox−, where ox is 8-hydroxyquinoline [Citation23].
Fig. 1 Cathodic stripping voltammetric behaviour of Cd–oxine in carbonate buffer at pH 8.0. Experimental conditions: tacc = 30 s, Eacc = −0.1 V, scan rate 200 mV s−1 and concentrations: A = 3 × 10⁻⁷ Cd2+, B = A + 5 × 10⁻⁷ oxine, C = B + 5 × 10⁻⁷ Cd2+, D = C + 1 × 10⁻⁶ oxine and E = D + 8 × 10⁻⁷ Cd2+ mol l−1.
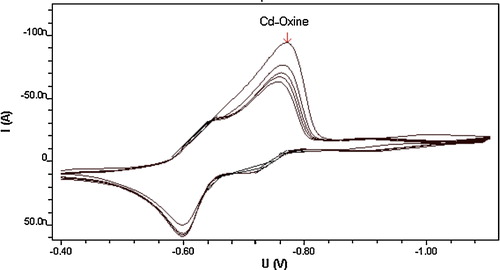
This proposed electrochemical reduction mechanism suggests a reversible oxidative process for Cd ions in the adsorbed complex, an assumption that was confirmed by cyclic voltammetric measurement of 8 × 10⁻⁶ mol l−1 oxine and 4 × 10⁻⁶ mol l−1 Cd2+ in pH 8.0 carbonate buffer at 100 mV s−1 scan rate. As can be seen from , which shows the cyclic voltammogram of the complex, the anodic peak on the reverse scan confirms the reversible nature of the reduction process. Furthermore, as can be seen from , repeated cyclic voltammetric measurements of this complex resulted in well-developed peaks on all cathodic and anodic scans. Succeeding cathodic scans, however, exhibited a gradual decrease in voltammetric peak intensity, which may indicate the adsorptive characteristic of this complex at the surface of the working electrode used. The interfacial accumulation of this oxine–metal complex onto the HMDE surface can nevertheless be used as an effective accumulation step to enhance electroanalytical determination of cadmium ions.
Fig. 2 Cyclic voltammetry of 4 × 10⁻⁶ mol l−1 Cd2+, 8 × 10⁻⁶ mol l−1 oxine, at carbonate buffer pH 8.0 Britton-Robinson buffer, scan rate 100 mV s−1.
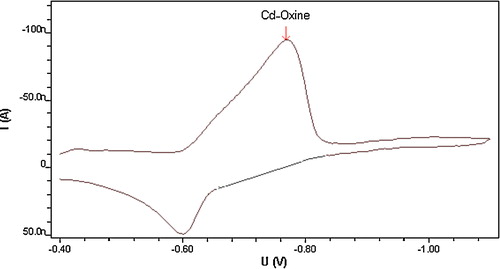
Fig. 3 Multi-cyclic voltammetry of 4 × 10⁻⁶ mol l−1 Cd2+, 8 × 10⁻⁶ mol l−1 oxine, at carbonate buffer pH 8.0 Britton-Robinson buffer, scan rate 100 mV s−1(sweep rates: (1) 80, (2) 66, (3) 60, (4) 57 and (5) 54 nA).
3.2 Factors affecting cathodic adsorptive stripping response
3.2.1 Effect of supporting electrolyte and pH
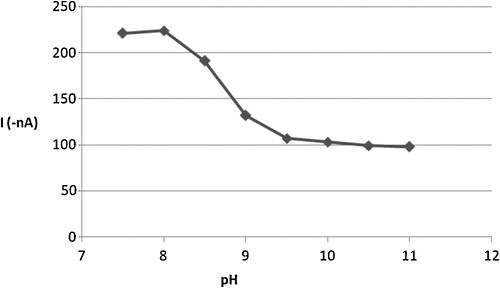
A suitable medium is an important parameter for CSV determination of the Cd–oxine complex. Thus, 2 × 10⁻⁶ mol l−1 of Cd2+ and 4 × 10⁻⁶ mol l−1 of oxine solution were studied by CSV in Britton-Robinson, carbonate, acetate and phosphate buffers at pH 3, 7 and 10 after 30 s preconcentration at 0.0 V accumulation potential. The ideal cathodic adsorptive stripping response in terms of peak shape, current and the smoothness of the baseline was observed with carbonate buffer, which was selected as the optimum for subsequent work. The influence of pH over the range 7.5–11 on the peak height and potential of the complex was investigated further, as shown in , in which the cathodic voltammetric peak height of the Cd–oxine solution is plotted as a function of pH. Variations in pH values over the range 8–11 gradually decreased the peak CSV current. For analytical purposes, the optimum pH for determination of this complex was found to be pH 8.0.
Fig. 4 Effect of pH on the cathodic peak current of 2 × 10⁻⁶ mol l−1 Cd2+, 4 × 10⁻⁶ mol l−1 oxine in carbonate buffer.
3.2.2 Effect of accumulation parameters
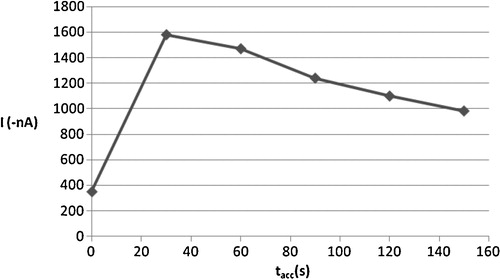
Preconcentration of the analyzed complex on the surface of HMDE is another essential condition for sensitive determination, as the amount of the accumulated complex depends on the time for which accumulation is allowed, in addition to the intensity of stirring and applied accumulation potential. The reduction current for 2 × 10⁻⁶ mol l−1 of Cd2+ and 4 × 10⁻⁶ mol l−1 of oxine was measured as a function of accumulation time, as shown in , over the range 0.0–150 s. In this diluted solution, an almost linearly dependence between CSV peak current and accumulation time was observed between 0.0 s and 30 s. In order to reduce the experimental time, a 30-s collection was adopted as optimal for subsequent voltammetric studies.
Fig. 5 Effect of accumulation time (tacc) on the cathodic peak current of 2 × 10⁻⁶ mol l−1 Cd2+, 4 × 10⁻⁶ mol l−1 oxine in carbonate buffer pH 8.0.
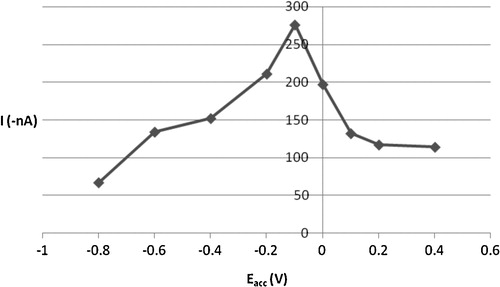
A variation in accumulation potential from −0.8 V to +0.4 V had a sharp effect on the peak current of the cadmium complex (). The maximum cathodic peak current value was obtained with an accumulation potential of −0.1 V, which was selected as the optimum for ensuring adequate sensitivity. Alteration of accumulation time and potential did not cause significance shifts in the CSV peak potential.
Fig. 6 Effect of accumulation potential (Eacc) on the cathodic peak current of 2 × 10⁻⁶ mol l−1 Cd2+, 4 × 10⁻⁶ mol l−1 oxine in carbonate buffer pH 8.0 and 30 s tacc.
3.2.3 Effect of potential sweep conditions
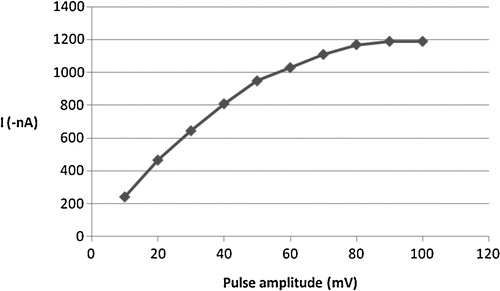
Generally, the cathodic stripping voltammetric response is related to how the applied potential was scanned. For instance, the cathodic peak current of the complex was found to be proportional to the scan rate, particularly over the range 50–200 mV s−1. As can be seen from , alteration in the scan rate between 50 and 400 mV s−1 caused the CSV peak current to increase linearly at the start of scans to 200 mV s−1 and then gradually to decrease with increasing scan rate values. The effect of changing the pulse amplitude on the square-wave voltammetric current was also evaluated over the range 10–100 mV (). The peak current of the complex increased almost linearly with the pulse amplitude over the range 10–80 mV; then, the current continued to increase, but the shape of the cathodic peak deteriorated. Accordingly, an 80 mV pulse amplitude was adopted as the optimum. In order to estimate the influence of square wave frequency on CSV peak current, the value of this parameter was varied over 10–80 Hz. A proportional relation was observed up to 40 Hz; then, the current continued to increase, but the shape of the peak deteriorated. Hence, a 40 Hz frequency was chosen for further studies.
Fig. 7 Effect of scan rate on the cathodic peak current of 2 × 10⁻⁶ mol l−1 Cd2+, 4 × 10⁻⁶ mol l−1 oxine in carbonate buffer pH 8.0, 30 s tacc and −0.1 V Eacc.
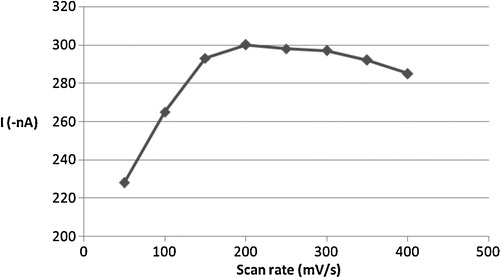
Fig. 8 Effect of pulse amplitude on the cathodic peak current of 2 × 10⁻⁶ mol l−1 Cd2+, 4 × 10⁻⁶ mol l−1 oxine in carbonate buffer pH 8.0, 30 s tacc, −0.1 V Eacc and 200 mV s−1 scan rate.
3.2.4 Effect of other instrumental variables
The influence of other operating parameters, such as the size of the adsorption area (HMDE) and the convection rate, on the efficiency of adsorption accumulation of the cadmium complex was also studied. As expected, a linear enhancement was observed for electrochemical peak intensity when the surface area of the HMDE was increased over the range 0.15–0.6 mm2 drop size. The influence of convection rate on the monitored peak current was evaluated over the range 0–3000 rpm, and a linear enhancement of the analytical signal was observed up to 1000 rpm. Hence, a 1000 rpm stirring speed was chosen as the optimum.
3.3 Quantitative utility
3.3.1 Calibration curve and detection limit
Under the optimum experimental conditions a good linear correlation was obtained between the Cd(ox)2 complex electrochemical response and its concentration in the range 5 × 10⁻⁸ to 4 × 10⁻⁷ mol l−1 of Cd2+ and 8 × 10⁻⁷ mol l−1 of oxine (). The parameters of the complex concentration–current straight line were calculated by the least-squares method, giving the regression equation of the calibration line:where ip is the CSV peak current, C is the complex concentration, and r is the correlation coefficient.
Fig. 9 CSV voltammogram for Cd(ox)2 complex in carbonate buffer, pH = 8.0, tacc = 30 s, Eacc = −0.1 V, scan rate = 200 mV s−1 and 8 × 10⁻⁷ mol l−1 oxine, Cd2+ concentration. A = buffer signal, B = 5 × 10⁻⁸, C = 1 × 10⁻⁷, D = 2 × 10⁻⁷, E = 3 × 10⁻⁷, F = 4 × 10⁻⁷ mol l−1.
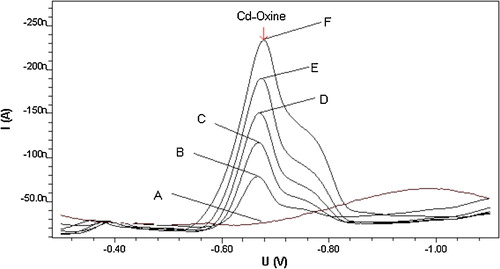
On the other hand, the detection limit, which defined as three times the signal to noise ratio (S/N = 3) reached in the optimum conditions for monitoring this complex was 3.5 × 10⁻⁹ mol l−1.
3.3.2 Reproducibility
The analytical precision of the new method was verified by determining the reproducibility of 10 determinations of 2 × 10⁻⁶ mol l−1 cadmium and 4 × 10⁻⁶ mol l−1 oxine solutions in carbonate buffer at pH 8.0. A relative standard deviation of 0.39% was found, indicating reproducible accumulation and monitoring of the complex.
3.3.3 Recovery
The recovery of the procedure, which reflects the accuracy of the method, was evaluated by analysing a spiked buffer solution containing 2 × 10⁻⁷ mol l−1 cadmium and 6 × 10⁻⁷ mol l−1 oxine by the optimized CSV procedure. The mean recovery of five measurements was 94% ± 1.0.
3.3.4 Stability
The stability of the electroanalytical signal of 2 × 10⁻⁶ mol l−1 Cd2+ was investigated by monitoring the CSV signal under the optimum analytical conditions every 10 min. The measured electrochemical response appeared to be stable over 1.5 h.
3.4 Interference
The effects of possible interfering substances, such as metal ions (Pb2+, Cu2+, Zn2+, Ni2+, Al3+) and ligands (EDTA, citric acid, oxalic acid), on CSV determination of Cd(ox)2 were investigated by adding appropriate amounts of these substance at concentrations of 1-, 5- and 20-fold higher than the concentration of the complex in the test solution (10 ml of carbonate buffer containing 1 × 10⁻⁷ mol l−1 cadmium and 5 × 10⁻⁷ mol l−1 oxine). Although moderate decreases in the voltammetric signals were observed, the presence of high concentrations (5- and 20-fold) of these substances did not increase the monitored CSV response by more than 6.0% and 3.5%, respectively.
3.5 Analytical applications
The proposed CSV method has been used to determine Cd2+ as Cd(ox)2 complex in al-Madinah water samples (Badar natural water, Omlog seawater, Abar Almashi natural water, Al Mahameed natural water, Al Mondassah natural water and Hamra’a Alasad natural water) and human plasma. Cadmium ion was determined as Cd(ox)2 directly by the optimized CSV method without requiring dissolution or filtration steps. Cadmium was determined directly in 200-μl water samples added to the test solution (10 ml carbonate buffer pH 8.0 containing 1 × 10⁻⁶ mol l−1 oxine). Five aliquots of the cadmium sample were diluted to the required concentration and measured by the standard addition approach. The results of these studies () showed mean recoveries of 91%, 97%, 104% and 108% with standard deviations of 1.0%, 1.87%, 1.6% and 1.6%, respectively, for Abar Almashi, Al Mahameed and Hamra’a Alasad natural waters, and human plasma. In Badar natural water, Omlog seawater and Al Mondassah natural water, cadmium was found at 1577.2 ppm, 500 ppm and 2800 ppm, with standard deviations of ±1.9, 2.1 and 4.42%, respectively, were recorded.
Table 1 Determination of Cd2+ as Cd(ox)2 complex in Al-Madinah water samples and human plasma by the proposed CSV method.
Acknowledgements
The author would like to thank Mr A’asim Al-Rohaily and Abdulmajeed Al-Harbi, Taibah University Chemistry Department students, and Majed alMosallmi and staff at Ohod Hospital laboratory for help in collecting samples.
Notes
Peer review under responsibility of Taibah University
References
- H.H.BauerG.D.ChristianJ.E.O’ReillyInstrumental Analysis1978Allyn and Bacon, Inc.Boston, MA
- J.WangAnalytical Electrochemistry3rd ed.2006Wiley-VCHHoboken, NJ
- A.GolcuB.DoganS.A.OzkanTalanta672005703712
- T.WahdanN.A.El-GhanyFarmaco602005830833
- A.RadiJ. Pharm. Biomed. Anal.31200310071012
- L.GaoY.WuJ.LiuYeF B.J. Electroanal. Chem.6102007131136
- N.ErkAnal. Biochem.32320034853
- R.K.SrivastavS.K.GuptaK.D.P.NigamP.VasudevanWater Res.28199416311638
- P.J.ApostoliJ. Chromatogr. B77820026397
- M.G.R.ValeM.M.SilvaB.WelzÉ.C.LimaSpectrochim. Acta B: Atom. Spectrosc.56200118591873
- E.B.BulskaM.WalcerzW.JedralA.HulanickAnal. Chim. Acta3571997133140
- M.W.WensingD.Y.LiuB.W.SmithJ.D.Wine-fordnerAnal. Chim. Acta299199417
- N.CardellicchioS.CavalliJ.M.RivielloJ. Chromatogr. A6401993207216
- B.PaullM.FoulkesP.JonesAnalyst1191994937941
- G.G.BartoletoG.T.MacarovschaS.CadoreJ. Braz. Chem. Soc.152004313317
- B.JankiewiczB.PtaszynskiM.WieczorekPolish J. Environ. Stud.920008386
- S.K.LeeH.S.ChoiBull. Korean Chem. Soc.222001463466
- G.EllenJ.W.Van LoonFood Addit. Contam.71990265273
- C.MunozM.ZunigaV.ArancibiaJ. Braz. Chem. Soc.21201016881691
- M.GrabarczykA.KoperElectroanalysis2420123336
- M.A.ElmhammediM.AchakM.BakasseAm. J. Anal. Chem.12010150158
- A.H.Al-GhamdiA.F.Al-GhamdiM.A.Al-OmarAnal. Lett.41200890103
- V.ArancibiaL.AlarconR.SeguraAnal. Chim. Acta5022004189194