
 ?Mathematical formulae have been encoded as MathML and are displayed in this HTML version using MathJax in order to improve their display. Uncheck the box to turn MathJax off. This feature requires Javascript. Click on a formula to zoom.
Abstract
A simple, sensitive, precise high-performance thin-layer chromatographic (HPTLC) method has been developed for estimating irbesartan and amlodipine besylate in combination. It involves TLC aluminium plates pre-coated with silica gel 60-F254 as the stationary phase and a solvent system of chloroform/toluene/methanol/acetic acid (6/2.5/1.5/0.5, v/v/v/v). The Rf values were 0.57 ± 0.02 for irbesartan and 0.30 ± 0.02 for amlodipine besylate. The separated spots were analysed densitometrically in absorbance mode at 244 nm. The results were linear in the range 50–500 ng per band for irbesartan and 400–900 ng per band for amlodipine besylate, with limits of detection of 14.4 ng per band and 12.7 ng per band, respectively. The limits of quantification were 47.4 ng per band for irbesartan and 42.0 ng per band for amlodipine. After irbesartan and amlodipine stock solutions were subjected to acid and alkaline hydrolysis, chemical oxidation, dry heat degradation and photodegradation, the peaks for degraded product were well resolved from that for pure drug, with significant differences in their Rf values when assayed by the HPTLC method. The method was validated with respect to linearity, accuracy, precision and robustness and was used successfully to estimate irbesartan and amlodipine besylate in a synthetic mixture.
1 Introduction
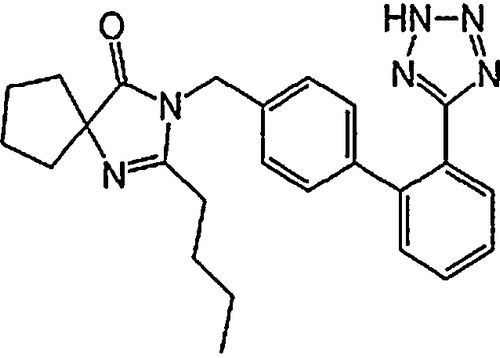
Irbesartan (2-butyl-3-({4-[2-(2H-1,2,3,4-tetrazol-5-yl)phenyl]phenyl}methyl)-1,3-diazaspiro[4,4]non-1-en-4-one) has the empirical formula C25H28N6O and a molecular mass of 428.5 g/mol () [Citation1]. Irbesartan is an angiotensin II antagonist used in the treatment of hypertension, as it selectively blocks the binding of angiotensin II to the AT1 receptor, produces arteriolar and venous dilatation and blocks aldosterone secretion, thus lowering blood pressure and decreasing salt and water retention [Citation2].
Fig. 1 Chemical structure of IRB.
Amlodipine besylate is chemically 3-ethyl,5-methyl(4RS)-2-[(2-aminoethoxy)methyl]-4-(2-chlorophenyl)-6-methyl-1,4-dihydropyridine-3,5-dicarboxylate benzene sulphonate with the empirical formula C26H31ClN2O8S and a molecular mass of 567.1 g/mol () [Citation1]. It is a long-acting (dihydropyridine class) Ca2+ channel antagonist used as an anti-hypertensive and in the treatment of angina. Like other calcium channel blockers, amlodipine besylate protects tissues by inhibiting the entrance of calcium into cardiac and smooth muscle cells of the coronary and systemic arterial beds. It is therefore an arteriolar vasodilator that decreases smooth muscle tone and vascular resistance [Citation3].
Fig. 2 Chemical structure of AML.

A fixed-dose, single-pill combination is available, in which the constituent drugs exert additive effects. The fixed-dose combination has been associated with a greater decrease in mean diastolic blood pressure when seated at home and in mean systolic and diastolic blood pressure when seated at the office than monotherapy [Citation4,Citation5].
The International Conference on Harmonization guideline on stability testing of new drug substances and products requires that stress testing be carried out to determine the stability of the active substance [Citation6]. Susceptibility to oxidation is one of the required tests, and hydrolytic and photolytic stability testing are required. An ideal method for indicating stability is one that allows quantification of the drug and resolution of its degradation products.
A literature survey on studies of the quantitative analysis of these drugs showed analytical methods that have been tested for estimating irbesartan alone and in combination with other drugs by liquid chromatography [Citation6–Citation9], high-performance thin-layer chromatography (HPTLC) [Citation10–Citation12] and spectrophotometry [Citation13–Citation15]; spectrophotometric methods [Citation16,Citation17], HPLC [Citation18,Citation19] and HPTLC [Citation20,Citation21] have been tested for estimating amlodipine besylate alone and in combination with other drugs.
HPTLC has the advantage that many samples can be analysed in a short time, and a new stationary plate can be taken for analysis, which prevents the carry-over found with HPLC. For routine quality control analysis, HPTLC is therefore preferred to HPLC. No HPTLC method has been reported for estimating the stability of irbesartan and amlodipine besylate in combination.
2 Experimental
2.1 Instruments
The HPTLC instrument consisted of a CAMAG (Muttenz, Switzerland) Linomat V sample applicator with a 100-μL applicator syringe (Hamilton, Bonadauz, Switzerland). Chromatography was performed on 10 cm × 10 cm aluminium TLC plates precoated with silica gel 60-F254 (E. Merck, Darmstadt, Germany; supplied by Anchrom Technologists, Mumbai, India). A CAMAG TLC scanner 4 was used for densitometric scanning of the chromatogram. All drugs and chemicals were weighed on a Shimadzu electronic balance (AX 200, Shimadzu Corp., Japan).
2.2 Chemicals and reagents
Analytically pure irbesartan (99.5%) and amlodipine besylate (99.5%) were donated by CTX (Surat, India) and Blue Cross Laboratory Ltd. (Mumbai, India), respectively. Toluene was purchased from Chiti-Chem Corp. (Baroda, India). Chloroform was obtained from Krishna-chem-Industry (Baroda, India). Methanol was obtained from Suvidinath Laboratory (Baroda, India) and acetic acid from Chemdyes Corporation (Baroda, India).
2.3 Chromatographic system
2.3.1 Sample application
Standards and synthetic mixture samples of irbesartan and amlodipine besylate were applied to the HPTLC plates in the form of narrow bands 6 mm in length applied 10 mm from the bottom and 15 mm from the left edge of the plate. Samples were applied under a continuous drying stream of nitrogen gas.
2.3.2 Mobile phase and development
Plates were developed in a mobile phase consisting of chloroform/toluene/methanol/acetic acid (6/2.5/1.5/0.5, v/v/v/v). Linear ascending development was carried out in a twin-trough glass chamber equilibrated with the mobile phase vapours for 15 min. Ten millilitres of the mobile phase (5 mL in the trough containing the plate and 5 mL in the other trough) were used for each development and were allowed to migrate a distance of 80 mm. After development, the HPTLC plates were dried completely.
2.3.3 Densitometric analysis
Densitometric scanning was performed in the absorbance mode under control with CATS planar chromatography software (CAMAG, Muttenz, Switzerland). The source of radiation was a deuterium lamp, and bands were scanned at 244 nm. The slit dimensions were 5 mm in length and 0.45 mm in width, with a scanning rate of 20 mm/s. Concentrations of the compound were determined from the intensity of diffusely reflected light and evaluated as peak areas against concentrations from a linear regression equation.
2.4 Preparation of standard stock solution
Ten-milligram aliquots of standard irbesartan and amlodipine besylate were accurately weighed, transferred to two separate 10-mL volumetric flasks and dissolved in a few millilitres of methanol. The volumes were made up to the mark with methanol to yield a solution containing 1000 μg/mL. Aliquots of the stock solutions were appropriately diluted with methanol to obtain working standards of 100 μg/mL of both drugs.
2.5 Validation
The HPTLC method was validated according to the International Conference on Harmonization guidelines Q2 (R1) [Citation22].
2.5.1 Linearity of calibration curves
The linearity of the method was evaluated by constructing calibration curves at five concentrations over a range of 50–400 ng per band for irbesartan and 400–900 ng per band for amlodipine besylate. The calibration curves were prepared by plotting peak area versus concentration (n = 5).
2.5.2 Accuracy
The accuracy of the method was determined by calculating the recoveries of the two drugs by standard additions. Known amounts of irbesartan (0, 160, 200 and 240 ng per band) and amlodipine besylate (0, 324, 405 and 486 ng per band) were taken from the working standard solutions and were added to pre-quantified samples. The amounts of drug were estimated by measuring the areas and by fitting these values to the straight-line equations of the calibration curves.
2.5.3 Precision
Intra-day precision was determined by analysing sample solutions of irbesartan (50, 300 and 500 ng per band) and amlodipine besylate (400, 700 and 900 ng per band) three times on the same day. Inter-day precision was determined by analysing sample solutions of irbesartan (50, 300 and 500 ng per band) and amlodipine besylate (400, 700 and 900 ng per band) over 3 days. The peak areas obtained were used to calculate mean and relative standard deviation (% RSD).
The repeatability of measures of the peak area was determined by analysing irbesartan (300 ng per spot) and amlodipine besylate (700 ng per spot) seven times without changing the position of the plate. The repeatability of injection was checked by applying seven tracks of irbesartan and amlodipine besylate on the same plate.
2.5.4 Specificity
Specificity was studied in forced degradation studies.
2.5.4.1 Alkaline hydrolysis
Appropriate aliquots of stock solutions of irbesartan and amlodipine besylate were taken in two 10-mL volumetric flasks, and 2 mL of 0.1 N NaOH were added. The mixtures were heated in a water bath at 80 °C for 1 h and allowed to cool to room temperature. Solutions were neutralized with 0.1 N HCl and diluted up to the mark with methanol.
2.5.4.2 Acid hydrolysis
Appropriate aliquots of stock solutions of the two drugs were taken in two 10-mL volumetric flasks, and 2 mL of 0.1 N HCl were added. The mixtures were heated in a water bath at 80 °C for 1 h and allowed to cool to room temperature. Solutions were neutralized with 0.1 N NaOH and diluted up to the mark with methanol.
2.5.4.3 Oxidative stress degradation
Appropriate aliquots of stock solutions of the two drugs were taken in two 10-mL volumetric flasks, and 2 mL of 3% hydrogen peroxide were added. The mixtures were heated in a water bath at 80 °C for 1 h, allowed to cool to room temperature and diluted up to the mark with methanol.
2.5.4.4 Dry heat degradation
Analytically pure samples of irbesartan and amlodipine besylate were exposed in an oven at 80 °C for 2 h. The solids were allowed to cool, and 10 mg of each drug were weighed, transferred to two 10-mL volumetric flasks and dissolved in a few millilitres of methanol. Volumes were made up to the mark with methanol.
2.5.4.5 Photodegradation
Analytically pure samples of irbesartan and amlodipine besylate were exposed to ultraviolet light for 6 h. The solids were allowed to cool, and 10 mg of each drug were weighed, transferred to two 10-mL volumetric flasks and dissolved in a few millilitres of methanol. Volumes were made up to the mark with methanol.
All the reaction solutions were applied to TLC plates, and chromatograms were recorded with the HPTLC method.
2.5.5 Sensitivity
The limit of detection (LOD) is the lowest concentration of an analyte that can reliably be differentiated from background levels. The limit of quantification (LOQ) of an individual analytical procedure is the lowest amount of analyte that can be quantitatively determined with suitable precision and accuracy.
The LOD and LOQ were calculated from the following equations as per the ICH guidelines:where σ is the standard deviation of y intercepts of regression lines, and S is the slope of the calibration curve.
2.5.6 Robustness
The effects of small changes in the chamber saturation time and solvent migration distance were examined. The robustness of the method was determined in triplicate at concentrations of 300 ng per band for irbesartan and 700 ng per band for amlodipine besylate.
2.5.7 Solution stability
Solutions at analytical concentrations (irbesartan, 300 ng per band and amlodipine besylate, 700 ng per band) were prepared and stored at room temperature (25 ± 2 °C) for 24 h and analysed at intervals of 0, 6, 12 and 24 h for the presence of any band other than those of the drugs. The results were compared with freshly prepared standard solutions of the same concentrations and expressed as changes in RSD.
2.6 Analysis of synthetic mixture
As the marketed formulation was under patent, it was difficult to obtain, and a synthetic mixture was prepared to determine the suitability of the method. The synthetic mixture was prepared with the ingredients commonly used in tablet formulation: hypromellose (2%), microcrystalline cellulose (28%), croscarmellose sodium (4.8%), magnesium stearate (1%) and silicon dioxide (1%) [Citation23].
Synthetic powder equivalent to 100 mg irbesartan and 10 mg amlodipine besylate was taken in a 10-mL volumetric flask, methanol was added, and the flask was sonicated for 15 min. The solution was filtered through Whatman filter paper No. 41, and the volume was made up to the mark with methanol.
An appropriate volume of the aliquot was transferred to a 10-mL volumetric flask, and the volume was made up to the mark with methanol. This solution (100 μg/mL amlodipine besylate) was used to estimate amlodipine besylate (700 ng per band). The solution was further diluted with methanol to obtain 100 μg/mL irbesartan and used to estimate irbesartan (300 ng per band).
3 Results and discussion
3.1 Optimization of the mobile phase
To make the HPTLC method suitable for estimating irbesartan and amlodipine besylate in combined dosage form, the mobile phase was selected on the basis of polarity to give a dense, compact band with an appropriate Rf value for the two drugs. Satisfactory resolution of the drugs was not achieved with mixtures of toluene/methanol (7/3, v/v), chloroform/methanol (6/4, v/v), chloroform/toluene (8/2, v/v), chloroform/acetonitrile (8/2, v/v), acetonitrile/ethyl acetate (8/2, v/v) and chloroform/methanol/toluene (6/3/1, v/v). Chloroform/toluene/methanol/acetic acid (6/2.5/1.5/0.5, v/v/v/v) was found to be a satisfactory mobile phase, giving good separation of irbesartan and amlodipine besylate.
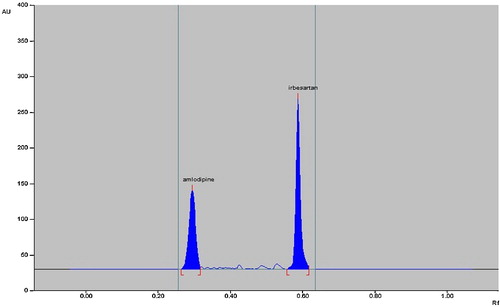
Chamber saturation time and solvent migration distance were crucial to chromatographic separation. A chamber saturation time of less than 15 min and solvent migration distances greater than 80 mm resulted in diffusion of the analyte band. Therefore, chloroform/toluene/methanol/acetic acid as the mobile phase, a chamber saturation time of 15 min under ambient conditions and a solvent migration distance of 80 mm were selected as the optimum conditions. These chromatographic conditions produced well-defined, compact bands of irbesartan and amlodipine besylate with Rf 0.57 ± 0.02 and 0.30 ± 0.02, respectively ().
Fig. 3 Densitograms of AML and IRB.
3.2 Selection of detection wavelength
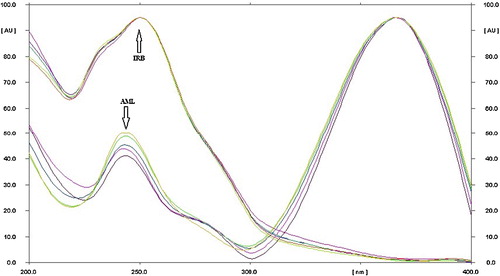
The sensitivity of an HPTLC method with ultraviolet detection depends on an appropriate wavelength. The drug mixture in solution was applied in the form of a band at concentrations of 50–500 ng per band of irbesartan and 400–900 ng per band of amlodipine besylate in methanol. The mixture was placed into the syringe and applied under a nitrogen stream to a single plate, which was developed with chloroform/toluene/methanol/acetic acid (6/2.5/1.5/0.5, v/v/v/v) under ambient conditions and dried in air. The developed plate was subjected to densitometric measurements in scanning mode in the ultraviolet region of 200–400 nm, and the overlaid spectrum was recorded on a CAMAG TLC Scanner 4. Both drugs absorbed appreciably at 244 nm, which was selected as the detection wavelength ().
Fig. 4 Overlaid spectra of IRB and AML.
3.3 Validation
3.3.1 Linearity and calibration curves
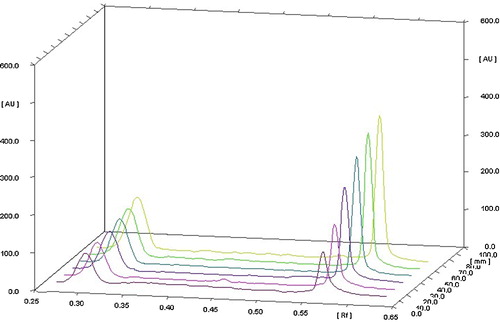
The linearity of an analytical method is its ability, within a given range, to provide results that are directly, or through a mathematical transformation, proportional to the concentration of the analyte. The method was found to be linear in a concentration range of 50–500 ng per band for irbesartan and 400–900 ng per band for amlodipine besylate. Regression data showed a good linear relationship over the concentration range, demonstrating the suitability of the method for analysis (). shows a three-dimensional overlay of the HPTLC densitograms for irbesartan and amlodipine besylate, with calibration bands at 244 nm.
Table 1 Results of regression analysis of calibration curve.
Fig. 5 Three-dimensional overlay of HPTLC densitograms of calibration bands.
3.3.2 Accuracy
The accuracy of an analytical method is the closeness of the results to the true value (100%). In recovery studies in which a known amount of standard was spiked into pre-analysed sample solutions the recovery was 98.9–103.11% for irbesartan and 99.29–102.30% for amlodipine besylate (). The values demonstrate that the method is accurate.
Table 2 Validation parameters of HPTLC.
3.3.3 Precision
Intra-day precision is measured for an analytical procedure used within a laboratory over a short time by the same operator with the same equipment, whereas inter-day precision involves estimation of variations in analysis when the method is used on different days. The RSD values of the response were less than 2% and 3% for intra-day and inter-day precision, respectively. Repeatability of the scanning device and injection was studied by applying and analysing irbesartan and amlodipine besylate samples (300 and 700 ng per band) seven times. The RSD values were less than 2% (), indicating that the method is repeatable and reproducible.
3.3.4 Limit of detection and limit of quantification
Under the experimental conditions used, the smallest amounts of drug that could be detected were 14.4 ng per band for irbesartan and 12.7 ng per band for amlodipine besylate. The LOQs were 47.4 ng per band for irbesartan and 42.0 ng per band for amlodipine besylate (), indicating that nanogram quantities of the drugs can be estimated accurately and precisely.
3.3.5 Forced degradation study
The chromatograms after base hydrolysis at 80 °C for 2 h showed degradation of irbesartan with a product peak at an Rf value of 0.44 and degradation of amlodipine besylate with peaks at Rf 0.03, 0.17 and 0.23 (). The degradation peaks were well resolved from those for pure drug.
Fig. 6 Chromatogram of base (0.1 N NaOH) hydrolysis.

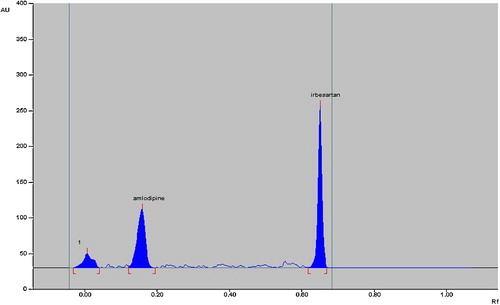
The chromatograms of acid-degraded samples showed degradation products peaks at Rf 0.02, 0.03 and 0.09 for amlodipine besylate, which were well resolved from the drug peak. Irbesartan was found to be stable to acid hydrolysis (). After dry heat degradation, the chromatogram showed peaks at Rf 0.38 for irbesartan and 0.01 and 0.03 for amlodipine besylate (). The chromatogram after photodegradation showed product peaks at Rf 0.01 for amlodipine besylate, while irbesartan was stable (). Both drugs were stable to oxidative hydrolysis.
Fig. 7 Chromatogram of acid (0.1 N HCl) hydrolysis.
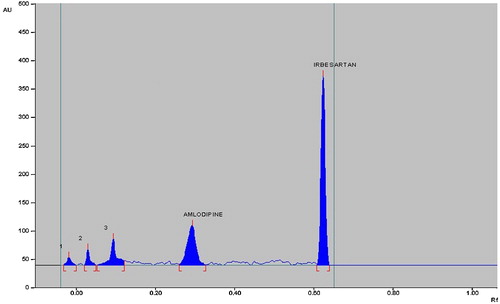
Fig. 8 Chromatogram of dry heat degradation.
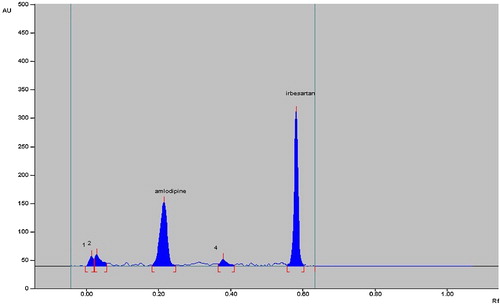
Fig. 9 Chromatogram of photolytic degradation.
The degradation studies therefore indicated that irbesartan is stable to acid hydrolysis and oxidative stress but susceptible to base hydrolysis, dry heat degradation and photodegradation. Amlodipine is susceptible to acid and alkaline hydrolysis, photodegradation and dry heat degradation and stable to oxidative stress degradation (). None of the stress conditions affected determination of irbesartan and amlodipine besylate.
Table 3 Results of analysis of forced degradation.
3.3.6 Robustness
RSD values less than 2% were obtained after introduction of small changes to the parameters of the HPTLC method, confirming its robustness.
3.3.7 Solution stability
The stability of sample solutions was studied at ambient condition for 24 h. Both drugs were stable, with a recovery of more than 97%.
3.4 Analysis of synthetic mixture
As the marketed formulation is under patent, it was difficult to obtain, and a synthetic mixture was prepared to check the suitability of the method. The synthetic mixture was prepared from amlodipine besylate, irbesartan and the excipients hypromellose (2%), microcrystalline cellulose (28%), croscarmellose sodium (4.8%), magnesium stearate (1%) and silicon dioxide (1%) [Citation23]. Analysis of the synthetic mixture by the proposed method gave a recovery of 100.06% (±0.76%) for a labelled amount of 100 mg irbesartan and 98.97% (±0.65%) for a labelled amount of 10 mg amlodipine besylate. Single bands at Rf 0.56 ± 0.02 and 0.29 ± 0.02 were observed in the chromatograms for irbesartan and amlodipine besylate, and no interference from the excipients was observed. As the method can be successfully applied for analysis of the synthetic mixture, it could be used to analyse the marketed tablet formulation.
4 Conclusion
The stability of the irbesartan and amlodipine besylate combination indicates that the HPTLC method can be used to estimate the drugs in mixtures. The method was found to be simple, sensitive, accurate and precise. Statistical analysis showed that the method is repeatable and selective for the analysis of irbesartan and amlodipine besylate in combination, with no interference from excipients. The method was successfully used to determine the drugs in a synthetic mixture. The results also indicate the suitability of the method under conditions of acid, base, dry heat, wet heat and photodegradation. As the method separates the drugs from its degradation products, it can be used to analyse stability samples.
Notes
Peer review under responsibility of Taibah University.
References
- British PharmacopoeiaDepartment of Health, Social Services and Public Safetyvol. 12011British Pharmacopoeia commission secretariatLondon11701172
- J.H.BrownP.TaylorL.J.RobertJ.D.MarrowGoodman and Gilman's The Pharmacological Basis of Therapeutics2001McGraw-HillNew York853860
- A.S.RichardC.C.PamelaLippincott's Illustrated Review, Pharmacology4th ed.2008Lippincott Williams and WilkinsPhiladelphia212213
- K.P.Garnock-JonesIrbesartan/amlodipine: a review of its use in adult patients with essential hypertension not adequately controlled with monotherapyAm. J. Cardiovasc. Drugs132013141150
- G.BobrieI-COMBINE study: assessment of efficacy and safety profile of irbesartan/amlodipine fixed-dose combination therapy compared with amlodipine monotherapy in hypertensive patients uncontrolled with amlodipine 5 mg monotherapy: a multicenter, phase III, prospective, randomized, open-label with blinded-end point evaluation studyClin. Ther.34201217051719
- International Conference on HarmonizationQIA Stability Testing of New Drug Substances and Products1993ICH SecretariatGeneva
- R.R.RajuB.N.BujjiDevelopment and validation of HPLC method for the estimation of irbesartan in pharmaceutical dosage formPharmacophore22011145149
- R.PrashanthiK.RaghaviM.SindhuraB.AnupamaN.N.BuchiDevelopment and validation of a sensitive RP-HPLC-PDA method for assay of irbesartan in pure and pharmaceutical dosage formsInt. J. Pharm. Biol. Sci.32012397406
- K.K.BalamuraliK.MahendraB.S.SundarA validated reverse phase HPLC method for the simultaneous estimation of irbesartan and hydrochlorothiazide in pharmaceutical dosage formsPharm. Chem.32011490496
- V.P.RaneK.R.PatilJ.N.SangshettiR.D.YeoleD.B.ShindeStability indicating LC method for simultaneous determination of irbesartan and hydrochlorothiazide in pharmaceutical preparationsJ. Chromatogr. Sci.482010595600
- N.J.ShahB.N.SuhagiaB.B.ShahN.M.PatelIndian development and validation of a HPTLC method for the simultaneous estimation of irbesartan and hydrochlorothiazide in tablet dosage formJ. Pharm. Anal.692007240243
- S.P.RosangluaiaV.MalarkodiValidated HPTLC method for simultaneous estimation of irbesartan and hydrochlorthiazide in a tablet dosage formPharm. Chem.32011310317
- P.P.DhanawadeR.N.KaneDerivative spectrophotometric method for estimation of irbesartan in bulk drug and dosage formInt. J. Res. Pharm. Biomed. Sci.3201213001305
- K.K.PradhanU.S.MishraS.PattnaikS.MishraG.PanigrahiK.C.SahuMethod development, validation and stability study of irbesartan in bulk and pharmaceutical dosage form by UV-spectrophotometric methodInt. J. Pharm. Biol. Arch.2201111141122
- K.R.PatelS.A.PatelV.C.DarjiR.N.SonpalSimultaneous spectrophotometric estimation of irbesartan and hydrochlorothiazide in tabletsInt. Res. J. Pharm.22011202207
- V.P.PatilS.J.DevdheS.S.AngadiS.D.ShelkeV.R.JadhavR.V.KawdeS.H.KaleNew ecofriendly validated spectrophotometric method for the estimation of amlodipine besylate in bulk drug using ninhydrinAsian J. Biomed. Pharm. Sci.320121419
- M.C.RajB.G.ChaudhariDevelopment and validation of spectrophotometric method for the estimation of amlodipine besylate and indapamide in tablet dosage formInt. J. Pharm.32012377381
- R.ShahS.AroraDevelopment and validation of a HPLC analytical assay method for amlodipine besylate tablets: a potent Ca2+ channel blockerJ. Adv. Pharm. Educ. Res.2201293100
- K.K.ChaitanyaD.G.SankarD.S.IsraelRP-HPLC method development and validation of amlodipine and losartan in binary mixtureJ. Global Treat. Pharm. Sci.4201311441152
- M.DangiD.ChaudhariM.SinkerV.RachaM.C.DamleStability indicating HPTLC method for estimation of nebivolol hydrochloride and amlodipine besylate in combinationEurasian J. Anal. Chem.52010161169
- S.N.MeyyanathanB.SureshHPTLC method for the simultaneous determination of amlodipine and benazepril in their formulationsJ. Chromatogr. Sci.4320057375
- International Conference on HarmonizationHarmonised Tripartite Guideline: Validation of Analytical Procedures: Text and Methodology2005ICH Secretariat, Q2 (R1)Geneva
- P. Khuller, V. Kolhe, A. Kulkani, S. Patel, V. Phadke, D. Saravanan, M. Shingte, Solid pharmaceutical fixed dose compositions comprising irbesartan and amlodipine, their preparation and their therapeutic application, Eur. Patents EP 2448561 B1 (2013).