
 ?Mathematical formulae have been encoded as MathML and are displayed in this HTML version using MathJax in order to improve their display. Uncheck the box to turn MathJax off. This feature requires Javascript. Click on a formula to zoom.
Abstract
To establish a quantitative structure–activity relationship for non-competitive antagonists of the N-methyl-d-aspartate receptor, 48 substituted dibenzo[a,d]cycloalkenimine derivatives were analyzed by principal components, a descendant multiple regression analyses, multiple non-linear regression and an artificial neural network. We propose non-linear and linear quantitative structure–activity models and interpret the activity of the compounds by the multivariate statistical analysis. Density functional theory with Becke's three-parameter hybrid function and Lee–Yang–Parr exchange correlation functional calculations were performed to define the structure, chemical reactivity and properties of the study compounds. The topological and the electronic descriptors were computed with ACD/ChemSketch and Gaussian 03W programs, respectively. The study shows that multiple regression and multiple non-linear regression analyses predict activity; however, predictions made with a 6-2-1 artificial neural network model were more accurate. This model gave statistically significant results and showed good stability to data variation in leave-one-out cross-validation.
1 Introduction
Excitatory amino acids form the mainstay of synaptic transmission in the central nervous system. By the same token, dysfunctional toxic activity of excitatory amino acids can lead to or become instrumental in the progression of a number of neurological and neurodegenerative conditions, such as epilepsy, Huntington disease, Alzheimer disease and schizophrenia. Dementia due to Alzheimer disease is characterized by extracellular plaques containing amyloid (β peptide), which disrupt dendritic morphology and affect glutamate (α-amino-3-hydroxy-5-methyl-4-isoxazolepropionic acid and N-methyl-d-aspartate) receptor function to alter glutamatergic transmission. Huntington disease manifests as atrophy of the corpus striatum and cortex, with neurons containing the mutant Huntington protein, which are perhaps more susceptible to excitotoxicity from corticostriatal inputs, as reflected by loss of the N-methyl-d-aspartate receptor and interactions with facilitatory group I metabotropic glutamate receptor. In schizophrenia, abnormalities in brain (dendritic) development and synaptic plasticity may precipitate dysfunction of mesolimbic and mesocortical dopaminergic pathways. Here again, aberrations in glutamatergic transmission in the form of N-methyl-d-aspartate receptor hypofunction may be involved [Citation1].
Dizocilpine, a compound originally characterized as an anticonvulsant, is a potent N-methyl-d-aspartate receptor antagonist [Citation2]. It binds selectively and with high affinity to the receptors when they are open [Citation3] and is therefore referred to as a use-dependent N-methyl-d-aspartate receptor open channel blocker with a very slow off-rate. These properties can be exploited to ‘pre-block’ a population of receptors, such as synaptic ones, resulting in selective activation of a different population, such as extra-synaptic receptors. The usefulness of this approach depends on the stability of dizocilpine blockade after washout [Citation4].
Early electrophysiological and ligand binding studies revealed that blockade of N-methyl-d-aspartate receptors by dizocilpine persisted long after the drug had been washed out [Citation5]. This unusual property means that the blockade of receptors is highly stable and can be regarded as ‘irreversible’ over many experiments. It is therefore used to ‘permanently’ block a sub-population of N-methyl-d-aspartate receptors in order to study a separate population of non-blocked receptors. An example of such use is in the study of synaptic and extra-synaptic receptors [Citation6]. Differential signaling by the neuroprotective phasic activation of synaptic N-methyl-d-aspartate receptors as compared with the deleterious tonic activation of extra-synaptic receptors is a topic of much current interest [Citation7–Citation19].
Quantitative structure–activity relations are used to investigate the relations between molecular descriptors of the unique physicochemical properties of a set of compounds and their biological activity or chemical property [Citation20,Citation21]. We attempted to establish a quantitative structure–activity relation for non-competitive antagonists of N-methyl-d-aspartate receptors by studying a series of 48 substituted dibenzo[a,d]cycloalkenimine derivatives.
2 Material and methods
2.1 Experimental data
In order to determine quantitative structure–activity relations for non-competitive antagonists of N-methyl-d-aspartate receptors, we used 48 compounds that have been synthesized and evaluated for their ability to displace dibenzo[a,d]cycloalkenimines from their specific binding sites on rat cortical membranes and for their antagonistic activity against the N-methyl-d-aspartate receptor. As proposed by Thompson et al. [Citation22], 38 molecules were selected for the quantitative model (training set), and 10 were selected randomly to test the performance of the proposed model (test set).
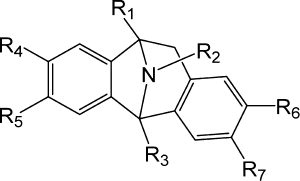
The molecular structures and computational models for the 48 derivatives are shown in and and described by their substituents as R1, R2, R3, R4, R5, R6 and R7. Although Thompson et al. proposed 73 compounds, the structures of the remaining compounds are different from that required for this study.
Table 1 The structure and the observed for the 48 MK801 derivatives (training and test set).
Fig. 1 Schematic diagram of MK801 skeleton.
2.2 Computational methods
The activity of these compounds was correlated with various physicochemical parameters by density functional theory. The three-dimensional structures were generated with Gauss View 3.0, and all calculations were performed with Gaussian 03W programs. Geometrical optimization of 48 compounds was carried out by Lee–Yang–Parr exchange correlation functional with the 6-31G (d) basic set [Citation23–Citation27]. The geometry of the compounds was determined by optimizing all geometrical variables with no symmetry constraints [Citation28]. ChemSketch [Citation29] was used to calculate the other molecular descriptors.
The quantum chemistry descriptors were obtained for the model from the density functional theory calculations as follows: total energy (E), highest occupied molecular orbital (HOMO) energy (EHOMO), lowest unoccupied molecular orbital (LOMO) energy (ELUMO), the difference between LUMO and HOMO energy (Gap), the total dipole moment of the compound (μ, Debye), absolute hardness (η), absolute electronegativity (χ) and the reactivity index (ω) [Citation30].
η, χ and ω were determined from:
The Advanced Chemistry Development ChemSketch program was used to calculate formula weight, molar volume (cm3), molar refractivity (cm3), parachor (cm3), density (g/cm3), refractive index (n), surface tension (γ (dyne/cm)) and polarizability (αe (cm3)) [Citation31].
2.3 Statistical analysis
To explain the structure–activity relations, we used principal component analysis, multiple linear and non-linear regression in XLSTAT software [Citation32]. The artificial neural network and leave-one-out cross-validation were performed with a program written in C language in Matlab 7.
Principal component analysis is a statistical technique used for summarizing information encoded in the structures of compounds and for understanding the distribution. It is essentially a descriptive statistical method for presenting the maximum information contained in Tables and in graphical form.
Multiple linear regression is used to study the relation between one dependent and several independent variables. It minimizes differences between actual and predicted values and was used to select the descriptors to be used as inputs into multiple non-linear regression and the artificial neural network. Multiple linear and non-linear regression were used to predict effects on the activity of dibenzo[a,d]cycloalkenimines (Ki). Equations were justified by the correlation coefficient (r), the mean squared error, Fisher's F statistic and the significance level (F value) [Citation33].
Artificial neural networks are artificial systems that simulate the function of the human brain. A neural network has three components: the processing elements or nodes, the topology of the connections between the nodes, and the rule by which new information is encoded in the network. While there are a number of models, the most frequently used artificial neural network in quantitative structure–activity relation studies is a three-layered feed-forward network [Citation34]. In this type of network, the neurons are arranged in layers, with an input layer, one hidden layer and an output layer. Each neuron in each layer is fully connected to the neurons of a succeeding layer, and there are no connections between neurons in the same layer. According to the supervised learning model, the networks are taught by giving them examples of input patterns and the corresponding target outputs. Through an iterative process, the connection weights are modified until the network gives the desired results for the training set of data. A back-propagation algorithm is used to minimize the error function. This algorithm has been described previously, with a simple example of application [Citation35]. A detailed description of this algorithm is given elsewhere [Citation36].
Cross-validation is used to explore the reliability of statistical models. In this technique, a number of modified data sets are created by deleting one or a small group of molecules, known respectively as “leave-one-out” and “leave-some-out” [Citation37–Citation39]. For each data set, an input–output model is prepared, and its accuracy in predicting the responses of the remaining data (those that were not used in the model) is evaluated. In this study, we used the leave-one-out procedure.
3 Results and discussion
3.1 Data set for analysis
The quantitative structure–activity relation analysis was performed using the Log Ki of the 48 selected molecules that have been synthesized and evaluated for their ability to displace dibenzo[a,d]cycloalkenimines (experimental values) as reported by Thompson et al. [Citation22], The values of the 16 chemical descriptors as shown in .
Table 2 The values of the 16 chemical descriptors.
The principle is to perform in the first time, a main component analysis (PCA), which allows us to eliminate descriptors that are highly correlated (dependent), then perform a decreasing study of multiple linear regression based on the elimination of descriptors aberrant until a valid model (including the critical probability: p-value <0.05 for all descriptors and the model complete).
3.2 Principal component analysis
All 16 descriptors (variables) coding the 48 molecules were submitted to principal components analysis, and 17 components were obtained (). The first three axes, F1, F2 and F3, contributed 41.5%, 21.6% and 11.1%, respectively, to the total variance, and the total information was estimated to be 74.2%. The Pearson correlation coefficients are summarized in ; the matrix provides information on the negative and positive correlations between variables. Correlations among the 16 descriptors are shown in as a correlation matrix; in , these descriptors are represented in a correlation circle.
Table 3 The correlation matrix (Pearson (n)) between different obtained descriptors.
Fig. 2 The principal components and there variances.
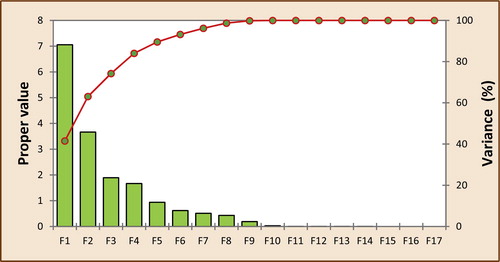
Fig. 3 Correlation circles.
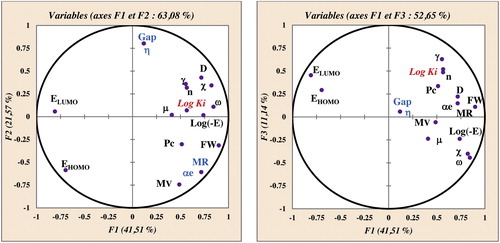
As molar refractivity (αe) and (gap, η) are perfectly correlated (r = 1), both variables are redundant. Molar refractivity, molar volume and polarizability are highly correlated (r (molar volume, molar refractivity) = 0.911, r (molar volume, polarizability) = 0.911. EHOMO and absolute electronegativity are strongly negatively correlated (r = −0.930), and ELUMO, absolute electronegativity and reactivity index are strongly negatively correlated: r (ELUMO, reactivity index)) = −0.976, (absolute electronegativity, reactivity index) = −0.957. The variables polarizability, gap, molar volume and absolute electronegativity were therefore removed.
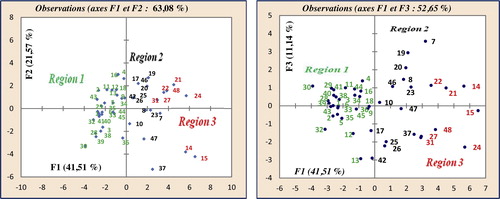
In the projection of the compounds in the plane of the three first axes, F1, F2 and F3 (), they are distributed in three regions. Region 1 contains those with log (−E) values between 4.263 (−18,323.14 eV) and 4.354 (−22,594.36 eV), region 2 contains compounds with values between 4.371 (−23,496.33 eV) and 4.489 (−30,831.88 eV), and region 3 contains compounds with values between 4.531 (−33,962.53 eV) and 4.946 (−88,307.99 eV).
Fig. 4 Cartesian diagram showing the separation between the tree regions and the dispersal of different molecules by groups.
3.3 Multiple linear regression
In order to propose a mathematical model and to evaluate physicochemical effects on the activity of the entire set of 48 compounds quantitatively, we submitted the data matrix constituted from the 12 variables corresponding to the training set to descendent multiple regression analysis. The correlation coefficient, r, the coefficient of determination, r2, mean squared error and F values were used to select the best regression performance.
Multiple linear regression allowed connection of the structural descriptors for the activity of each of the 38 compounds in order to evaluate the effect of the substituent quantitatively. The descriptors selected were molar refractivity, surface tension (γ), density, log (−E), ELUMO and reactivity index (ω).
The quantitative structure–activity relation model built with multiple linear regression is represented by:(1)
(1)
A high correlation coefficient and a low mean squared error indicate that the model is reliable. As the F value is less than 0.05, we would be taking a less than 0.01% risk in assuming that the null hypothesis is wrong. Therefore, we can conclude that the model provides a significant amount of information.
The quantitative structure–activity relation model showed that the N-methyl-d-aspartate antagonist activity can be explained by a number of electronic and topological factors. The negative correlation between surface tension and the total energy and the ability to displace the activity of dibenzo[a,d]cycloalkenimines results in a decrease in log (Ki), while the positive correlation between the topological descriptors density and molar refractivity and electronic descriptors EHOMO and ELUMO indicates the ability to displace dibenzo[a,d]cycloalkenimine activity, with an increase in log (Ki).
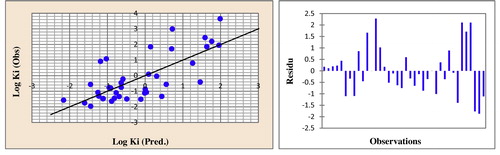
The predicted log (Ki) activities calculated from equation 1 in the optimal multiple linear regression model and the observed values are given in . The correlations between the predicted and observed activities and the residue values are illustrated in . The descriptors proposed in Eq. Equation(1)(1)
(1) were therefore used as the input parameters for multiple non-linear regression and the artificial neural network.
Table 4 The observed, the predicted activities (Log Ki), and residue according to different methods for the 38 MK801 derivatives (training set).
Table 5 The observed, the predicted activities (Log (Ki)), and residue according to MLR and MNLR for the 10 tested compounds (test set).
Fig. 5 Correlations of observed and predicted activities and the residues values calculated using MLR.
3.4 Multiple non-linear regression
We used also a non-linear regression model to improve the structure–activity relation and evaluate the effect of substituents quantitatively. We applied the descriptors proposed by multiple linear regression for the 38 molecules in the training set and used the coefficients r, r2 and F to select the best regression performance. We used a pre-programmed function of XLSTAT as follows:where a, b, c, d,… represent the parameters and X1, X2, X3, X4,… represent the variables.
The resulting equation was:(2)
(2)
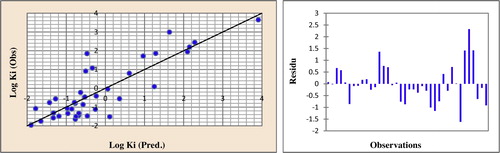
The predicted activities calculated from Eq. Equation(2)(2)
(2) and the observed values are given in . The correlations of the predicted and observed activities and the residues values are illustrated in .
Fig. 6 Correlations of observed and predicted activities and the residues values calculated using MNLR.
The true predictive power of a quantitative structure–activity relation model is its ability to predict accurately the activities of compounds in an external test set (compounds not used in the model development). The activities of the remained 10 compounds are deduced from the training set by multiple linear and non-linear regression. Their structures and the observed and calculated log (Ki) values are given in Tables and .
Comparison of the values of log (Ki-test) and log (Ki-obs.) shows that good predictions for the 10 compounds:
Multiple linear regression:
Multiple non-linear regression:
3.5 Artificial neural networks
In order to increase the probability of characterizing the compounds well, artificial neural networks can be used to generate predictive models of quantitative structure–activity relations between a set of molecular descriptors obtained from multiple linear regression and the observed activities. The model was prepared with the properties of several of the compounds. A parameter, ρ, has been proposed for determination of the number of hidden neurons, which play a major role in determining the best artificial neural network architecture [Citation40,Citation41], defined as follows:
In order to avoid over-fitting or under-fitting, it is recommended that 1.8 < ρ < 2.3 [Citation42]. The output layer represents the calculated activity values (log (Ki)). The architecture of the artificial neural network used in this work was 6-2-1, with ρ = 2.11.
The correlation between the calculated and experimental artificial neural network and the residue values were highly significant, as illustrated in and as indicated by the r and r2 values. The predicted activities calculated with the artificial neural network and the observed values are given in .
Fig. 7 Correlations of observed and predicted activities and residues values calculated using ANN.
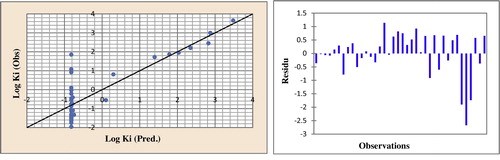
The r2 value confirms that the results of the artificial neural network were the best for building quantitative structure–activity models. ‘Leave-one-out’ is an approach particularly well adapted for estimating the predictive ability of these models. The correlations between the observed activities, the cross-validation, calculated values and the residues are illustrated in and .
Fig. 8 Correlations of observed and predicted activities and residues values calculated using CV.
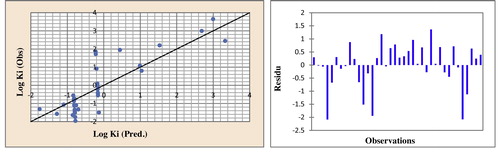
The good results obtained with cross-validation and for the prediction of the activities of the 10-compound test set show that the model proposed in this paper can accurately predict activity and that the selected descriptors are pertinent. The results obtained by multiple linear and non-linear regression are sufficient to conclude that the model performs well. Although the good predictive ability might be due to chance, we consider it a positive result. This model could therefore be used for all the dibenzo[a,d]cycloalkenimine derivatives () and could add to the search for non-competitive antagonists of N-methyl-d-aspartate receptors and their interaction with the receptor.
Our tests with multiple linear and non-linear regression and artificial neural network models showed a substantially better predictive capability of the artificial neural network model. It showed a satisfactory relation between the molecular descriptors and the activity of the compounds and a good correlation with cross-validation (rcv = 0.836).
4 Conclusion
Multiple linear and non-linear regression and an artificial neural network were used to construct a quantitative structure–activity relation model for antagonists of N-methyl-d-aspartate receptors and compared. The artificial neural network had substantially better predictive capability than the other two models, with greater predictive power. We established satisfactory relations between several descriptors and antagonist activity to the N-methyl-d-aspartate receptor, with cross-validation. The results show that the model proposed in this paper can predict activity accurately and that the selected descriptors are pertinent.
The accuracy and predictability of the proposed models were illustrated by comparison of the key statistical terms r or r2 for the different models (). The proposed methods will reduce the time and cost of synthesis and determination of the activity of N-methyl-d-aspartate receptor antagonists based on dibenzo[a,d]cycloalkenimine derivatives. Furthermore, the descriptors are sufficiently rich in chemical, electronic and topological information to encode structural features that could be used with other descriptors in the development of predictive, quantitative structure–activity models.
Acknowledgements
We are grateful to the Association marocaine des Chimistes théoriciens for help with the programs.
Notes
Peer review under responsibility of Taibah University.
References
- G.FloresJ.V.Negrete-DíazM.CarriónY.Andrade-TalaveraS.A.BelloT.S.SihraA.Rodríguez-MorenoJ.P.F.D’MelloExcitatory amino acids in neurological and neurodegenerative disordersJ.P.F.D’MelloAmino Acids in Human Nutrition and Health2012Wallingford, UK427453 (Chapter 25)
- E.H.WongJ.A.KempT.PriestleyA.R.KnightG.N.WoodruffL.L.IversenThe anticonvulsant MK-801 is a potent N-methyl-d-aspartate antagonistProc. Natl. Acad. Sci. U. S. A.83198671047108
- J.E.HuettnerB.P.BeanBlock of NMDA-activated current by the anticonvulsant MK-801: selective binding to open channelsProc. Natl. Acad. Sci. U. S. A.85198813071311
- S.McKayC.P.BengtsonH.BadingD.J.A.WyllieG.E.HardinghamRecovery of NMDA receptor currents from MK-801 blockade is accelerated by Mg2+ and memantine under conditions of agonist exposureNeuropharmacology742013119125
- I.J.ReynoldsR.J.MillerMultiple sites for the regulation of the N-methyl-d-aspartate receptorMol. Pharmacol.331988581584
- G.E.HardinghamY.FukunagaH.BadingExtrasynaptic NMDARs oppose synaptic NMDARs by triggering CREB shut-off and cell death pathwaysNat. Neurosci.52002405414
- K.BordjiJ.Becerril-OrtegaO.NicoleA.BuissonActivation of extrasynaptic, but not synaptic, NMDA receptors modifies amyloid precursor protein expression pattern and increases amyloids productionJ. Neurosci.3020101592715942
- O.DickH.BadingSynaptic activity and nuclear calcium signaling protect hippocampal neurons from death signal-associated nuclear translocation of FoxO3a induced by extrasynaptic NMDA receptorsJ. Biol. Chem.28520101935419361
- G.E.HardinghamH.BadingCoupling of extrasynaptic NMDA receptors to a CREB shut-off pathway is developmentally regulatedBiochim. Biophys. Acta16002002148153
- G.E.HardinghamH.BadingSynaptic versus extrasynaptic NMDA receptor signaling, implications for neurodegenerative disordersNat. Rev. Neurosci.112010682696
- A.IvanovC.PellegrinoS.RamaI.DumalskaY.SalyhaY.Ben-AriI.MedinaOpposing role of synaptic and extrasynaptic NMDA receptors in regulation of the ERK activity in cultured rat hippocampal neuronsJ. Physiol.5722006789798
- F.LeveilleF.El GaamouchE.GouixM.LecocqD.LobnerO.NicoleA.BuissonNeuronal viability is controlled by a functional relation between synaptic and extrasynaptic NMDA receptorsFASEB J.22200842584271
- A.J.MilnerwoodC.M.GladdingM.A.PouladiA.M.KaufmanR.M.HinesJ.D.BoydR.W.Y.KoO.C.VasutaR.K.GrahamM.R.HaydenT.H.MurphyL.A.RaymondEarly increase in extrasynaptic NMDA receptor signalling and expression contributes to phenotype onset in Huntington's disease in miceNeuron652010178190
- S.OkamotoM.A.PouladiM.TalantovaD.Yao1P.XiaD.E.EhrnhoeferR.ZaidiA.ClementeM.KaulR.K.GrahamD.ZhangH-S.V.ChenG.TongM.R.HaydenS.A.LiptonBalance between synaptic versus extrasynaptic NMDA receptor activity influences inclusions and neurotoxicity of mutant huntingtinNat. Med.15200914071413
- S.PapadiaF.X.SorianoF.LéveilléM.-A.MartelK.A.DakinH.H.HansenA.KaindlM.SifringerJ.FowlerV.StefovskaG.MckenzieM.CraigonR.CorriveauP.GhazalK.HorsburghB.A.YanknerD.J.A.WyllieC.IkonomidouG.E.HardinghamSynaptic NMDA receptor activity boosts intrinsic antioxidant defensesNat. Neurosci.112008476487
- R.X.SorianoP.BaxterL.M.MurrayM.B.SpornT.H.GillingwaterG.E.HardinghamTranscriptional regulation of the AP-1 and Nrf2 target gene sulfiredoxinMol. Cells272009279282
- W.TuX.XuL.PengX.ZhongW.ZhangM.M.SoundarapandianC.BelalM.WangN.JiaW.ZhangF.LewS.L.ChanY.ChenY.LuDAPK1 interaction with NMDA receptor NR2B subunits mediates brain damage in strokeCell1402010222234
- A.S.WahlB.BuchthalF.RodeS.F.BomholtH.E.FreitagG.E.HardinghamL.C.B.RonnH.BadingHypoxic/ischemic conditions induce expression of the putative pro-death gene Clca1 via activation of extrasynaptic N-methyl-d-aspartate receptorsJ. Neurosci.1582009344352
- S.J.ZhangM.N.SteijaertD.G.LauC.SchützD.VivierP.DescombesH.BadingDecoding NMDA receptor signaling: identification of genomic programs specifying neuronal survival and deathNeuron532007549562
- C.NantasenamatC.Isarankura-Na-AyudhyaT.NaennaV.PrachayasittikulA practical overview of quantitative structure–activity relationshipEXCLI J.820097488
- C.NantasenamatC.Isarankura-Na-AyudhyaV.PrachayasittikulAdvances in computational methods to predict the biological activity of compoundsExpert Opin. Drug Discov.52010633654
- W.J.ThompsonP.S.AndersonS.F.BritcherT.A.LyleJ.E.ThiesC.A.MagillS.L.VargaJ.E.SchweringP.A.LyleM.E.ChristyB.E.EvansM.D.ColtonM.K.HollowayJ.P.SpringerJ.M.HirshfieldR.G.BallJ.S.AmatoR.D.LarsenE.H.F.WongJ.A.KempM.D.TricklebankL.SinghR.OlesT.PriestlyG.R.MarshallA.R.KnightD.N.MiddlemissG.N.WoodruffL.L.IversenSynthesis and pharmacological evaluation of a series of dibenzo[a,d]cycloalkenimines as N-methyl-d-aspartate antagonistsJ. Med. Chem.331990789808
- C.AdamoV.BaroneChem. Phys. Lett.3302000
- M.ParacS.GrimmeJ. Phys. Chem.10620036844
- Y.YamaguchiS.YokoyamaS.MashikoJ. Chem. Phys.11620026541
- S.ChtitaM.GhamaliM.LarifA.AdadR.HmammouchiM.BouachrineT.LakhlifiPrediction of biological activity of imidazo[1,2-a] pyrazine derivatives by combining DFT and QSAR resultsInt. J. Innov. Res. Sci. Eng. Technol.2201379517962
- L.BeckerK.HinrichsU.FinkeA New Algorithm for Computing Joins with Grid FilesProc. of the 9th International Conference on Data EngineeringVienna, Austria1993190197
- Advanced Chemistry Development Inc., Toronto, 2009, http://www.acdlabs.com/resources/freeware/chemsketch.
- S.J.LeeJ.FinkA.B.BalantekinM.R.A.StrayerS.UmarP.G.ReinhardJ.A.MaruhnW.GreinerReplyPhys. Rev. Lett.601988163
- U.SakarR.ParthasarathiV.SubramanianP.K.ChattarajiToxicity analysis of polychlorinated dibenzofurans through globalJ. Mol. Struct. THEOCHEM2004124
- ACD/ChemSketch Version 4.5 for Microsoft Windows User's Guide.
- XLSTAT 2009 Add-in software (XLSTAT Co.). www.xlstat.com.
- M.LarifA.AdadR.HmammouchiA.I.TaghkiA.SoulaymaniA.ElmidaouiM.BouachrineT.LakhlifiBiological activities of triazine derivatives combining DFT and QSAR resultsArab. J. Chem.201510.1016/j.arabjc.2012.12.033 (in press)
- V.J.ZupanJ.GasteigerNeural Networks for Chemists—An Introduction1993VCH VerlagsgesellschaftWeinheim
- D.CherqaouiD.VilleminUse of neural network to determine the boiling point of alkanesJ. Chem. Soc. Faraday Trans.90199497102
- J.A.FreemanD.M.SkapuraNeural Networks Algorithms, Applications, and Programming Techniques1991Addition Wesley Publishing CompanyReading
- B.EfronEstimating the error rates of a predictive rule: improvement on cross-validationJ. Am. Stat. Assoc.781983316331
- M.A.EfroymsonMultiple regression analysisA.RalstonH.S.WilfIn Mathematical Methods for Digital Computers1960WileyNew York
- D.W.OstenSelection of optimal regression models via cross-validationJ. Chemom.219983948
- S.-S.SoW.G.RichardsApplication of neural networks: quantitative structure-activity relationships of the derivatives of 2,4 diamino (substituted-benzyl) pyrimidines as DHFR inhibitorsJ. Med. Chem.35199232013207
- T.A.AndreaH.KalayehApplications of neural networks in quantitative structure-activity relationships of dihydrofolate reductase inhibitorsJ. Med. Chem.34199128242836
- M.ElhallaouiModélisatrice moléculaire et étude QSAR d’antagonistes non compétitifs du récepteur NMDA par les méthodes statistiques et le réseau de neurones (Doctoral thesis)2002Fez