
 ?Mathematical formulae have been encoded as MathML and are displayed in this HTML version using MathJax in order to improve their display. Uncheck the box to turn MathJax off. This feature requires Javascript. Click on a formula to zoom.
Abstract
In this study, complex optical parameters such as absorption, extinction coefficient, refractive index, optical conductivity and real and imaginary dielectric constants of V2O5–P2O5–B2O3–Dy2O3 glass systems were studied. The conformation of the glassy phase in a sample was accomplished by X-ray diffraction analysis, and the material's optical parameters were analyzed using ultraviolet–visible spectroscopy. The extinction coefficient and real and imaginary dielectric constants were found to linearly increase above 225 nm, and the optical conductivity in V2O5–P2O5–B2O3–Dy2O3 glass systems was found to gradually increase near 225 nm.
1 Introduction
In modern applications, rare-earth co-doped glass systems have many potential applications in various fields, such as solar cells, telecommunication, light emitting devices and Li-free battery materials, which have been improved using the special properties of rare-earth materials. Additionally, rare-earth oxide glasses are currently applied to take advantage of the Faraday rotation effect in an optical attenuator, circulator and magnetic field sensor. All of these applications are primarily based on unidirectional light propagation in optical isolators, which results in large Verdet constants, which are primarily influenced by the concentration of rare-earth materials in a glass system [Citation1].
Reddy et al. prepared (Dy3+)-doped sodium–aluminium–phosphate glasses and studied their optical absorption, excitation, emission spectra and decay time. The authors of Ref. [Citation2] concluded that these properties are related to the nature of the host matrix. Jimenez et al. studied the spectroscopic properties of a 50P2O5:50BaO glass matrix containing CuO, SnO and Dy2O3 prepared by melting followed by heat treatment. The primary accomplishment of this study is the determination of the stoichiometric amounts of CuO and SnO dopants along with the source of Dy3+ ions that results in the effective precipitation of Cu nanoparticles [Citation3]. Marzouk et al. prepared Dy2O3-doped lead phosphate glasses using a melt-quenching technique and characterized them using infrared absorption spectra, photoluminescence and UV–visible optical absorption measurements. It was shown that the density of non-bridging oxygen increases due to the effects of rare-earth dopants on lead phosphate glass, which significantly affects the material's optical parameters [Citation4]. A Dy-doped phospho-vanadate glass system was reported by Barde et al., who studied the material's transport and physical properties. The authors of Ref. [Citation5] showed that ionic conductivity is dominant over the electronic conductivity with values that range between 82% and 96%. Park et al. prepared bismuth-borate glasses systems with various dopants, such as CeO2, Nd2O3, Er2O3, Dy2O3 and Pr2O3, in difference concentrations using the melt-quenching technique. The primary achievement of this work was showing that X-ray luminescence only shows an emission peak at 575 nm in Dy2O3-doped glass systems [Citation6]. Hayakawa et al. studied the effect of the concentration of Tb2O3/Dy2O3 on various properties including the Faraday rotation, optical attenuation, circulator and magnetic field of B2O3–Ga2O3–SiO2–P2O5 glass systems produced by a conventional melt-quenching method [Citation7]. Nahm et al. reported the electrical properties and DC-accelerated ageing characteristics of ZnO-Pr6O11-based varistors doped with various Dy2O3 contents and sintering times. Increases in concentration and sintering time led to a reduction in nonlinearities [Citation8]. Ekhelikar et al. described the binary systems of Bi2O3–Dy2O3 and Bi2O3–Pr2O3 by varying the doping concentration of Dy2O3 and Pr2O3 prepared by the ceramic method [Citation9]. Ramteke et al. synthesized Li2O–B2O3–Dy2O3 glasses using the melt-quenching technique for different concentrations of Dy2O3. In this investigation, it was observed that the conduction mechanism is independent of the temperature because the AC conductivity and electric modulus overlap on the single master curve [Citation10].
Therefore, the goal of this study was to investigate the complex optical properties of V2O5–P2O5–B2O3–Dy2O3 systems. To the best of our knowledge and from a thorough literature survey of material science papers, no unified report on this topic has been published. This work explores the complex optical properties associated with V2O5–P2O5–B2O3–Dy2O3 glass systems analyzed with ultraviolet-visible spectroscopy.
2 Experimental
In this study, AR grade chemicals were used to prepare glass samples. The glass systems with compositions of 60 V2O5–5P2O5–(35 − x)B2O3–xDy2O3 created by varying concentrations at an interval of x = 0.4, 0.6, 0.8, 1 and 1.2 mol% were prepared by the regular melt-quenching method. For convenience, these glass systems described by x = 0.4, 0.6, 0.8, 1 and 1.2 mol% are henceforth referred to as S1, S2, S3, S4 and S5, respectively. With proper stoichiometry, chemicals were weighed and mixed, and each mixture was crushed to make it homogenized and thus melt in an alumina crucible in a muffle furnace at 1073 K for 4 h. Then, the mixture was poured onto a stainless steel plate to quench. To avoid internal strain, the sample underwent a heat treatment at 573 K for 2 h.
Each material was characterized using X-ray diffraction (XRD) (Rigaku Miniflex-II, X-ray diffractometer) to confirm a glassy phase in the as-prepared samples. Similarly, the optical properties of the samples were determined by ultraviolet–visible spectroscopy (Agilent Cary 60 UV-Vis Spectrophotometer). The UV–VIS spectra of the samples were recorded in absorption mode within the wavelength range of 200–600 nm. The optical properties of the glass samples were analyzed in powder form.
3 Results and discussion
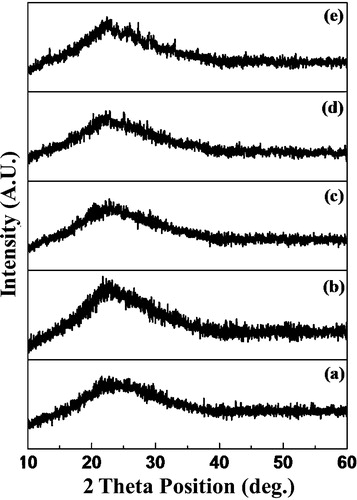
shows the XRD patterns of the 60 V2O5–5P2O5–(35 − x)B2O3–xDy2O3 glass systems. The noisy nature of the pattern clearly indicates the formation of a glassy phase in the as-prepared glass systems. No characteristic peaks were observed in the entire 2θ range, which identified the amorphous nature of the samples and that the quenching process used for the preparation of the glasses was performed correctly. The amorphous halo observed at 2θ = 15–35° indicates that a significant degree of amorphousness is present within the entire volume of glass.
Fig. 1 XRD patterns of 60 V2O5–5P2O5–(35 − x)B2O3–xDy2O3 for: (a) S1, (b) S2, (c) S3, (d) S4 and (e) S5.
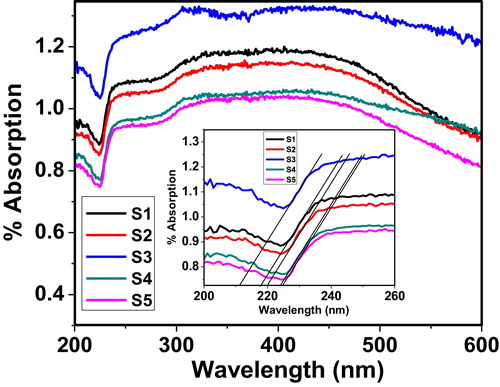
represents the UV–VIS spectrum of the 60 V2O5–5P2O5–(35 − x)B2O3–xDy2O3 glass system as a function of wavelength. The spectrum magnified in the inset of clearly shows that the as-prepared glass samples have an intense absorption tail within 210–230 nm. Additionally, the spectrum shows good dependence on the concentration of Dy in the glass system. The highest blue shift is shown by S3, which indicates that S3 has a large optical band gap in its complete glass system [Citation11]. This may be due to formation of fine complex oxide particles. Therefore, these types of glass systems are useful in UV absorption applications.
Fig. 2 UV–VIS spectrum of the 60 V2O5–5P2O5–(35 − x)B2O3–xDy2O3 glass system.
depicts the variation of the extinction coefficient as a function of wavelength. The relation between the extinction coefficient and wavelength is represented by Eq. Equation(1)(1)
(1) [Citation12]:
(1)
(1) where α is the percent absorption, and λ is the wavelength.
Fig. 3 Variation of the extinction coefficient of the 60 V2O5–5P2O5–(35 − x)B2O3–xDy2O3 glass system as a function of wavelength.
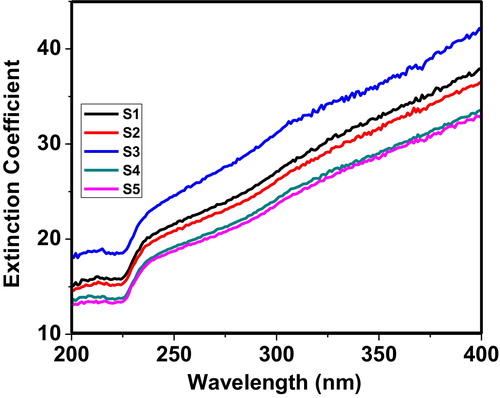
The extinction coefficient curves of the as-prepared glass samples exhibit nearly constant behaviour up to 225 nm. Between 225 and 235 nm, the samples exhibit an increase in the extinction coefficient. Beyond 235 nm, the samples show a smooth increase in the extinction coefficient up to 400 nm. These observations are in good agreement with the absorption behaviour of glass systems. Sample S3 shows a large extinction coefficient, which indicates that the extinction coefficient is a function of the concentration of Dy in the glass matrix.
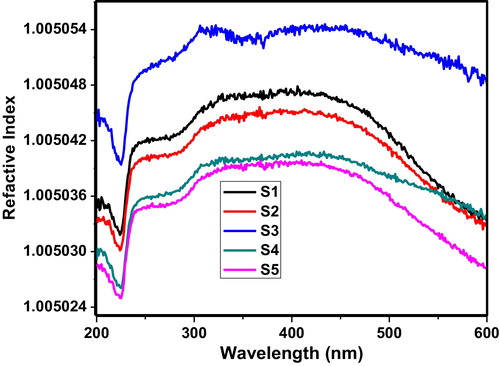
shows the variation of the refractive index as a function of wavelength. The value of the refractive index can be calculated by Eq. Equation(2)(2)
(2) :
(2)
(2) where %T is the transmission through the 60 V2O5–5P2O5–(35 − x)B2O3–xDy2O3 glass system [Citation13]. The plot of this function also shows that the samples exhibit a sharp decrease in the refractive index near 225 nm, which may be due to the intense absorption of glass samples within UV frequencies.
Fig. 4 Variation of refractive index of the 60 V2O5–5P2O5–(35 − x)B2O3–xDy2O3 glass system as a function of wavelength.
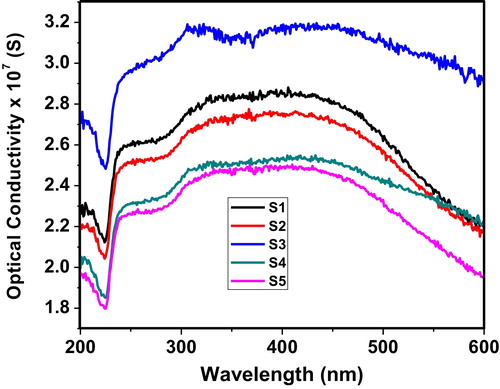
shows the variation of optical conductivity as a function of wavelength. The optical conductivity in terms of energy can be calculated by Eq. Equation(3)(3)
(3) :
(3)
(3) where α is the percent absorption, c is the speed of light and n is the refractive index [Citation14]. The sudden increase in optical conductivity near 225 nm can be attributed to the decrease in the absorption coefficient. Sample S3 exhibits the highest optical conductivity among the glass systems tested, which indicates more charges formed due to absorption. The optical conductivity curves remain nearly constant within the 300–500 nm range of wavelengths in all samples.
Fig. 5 Variation of optical conductivity of the 60 V2O5–5P2O5–(35 − x)B2O3–xDy2O3 glass system as a function of wavelength.
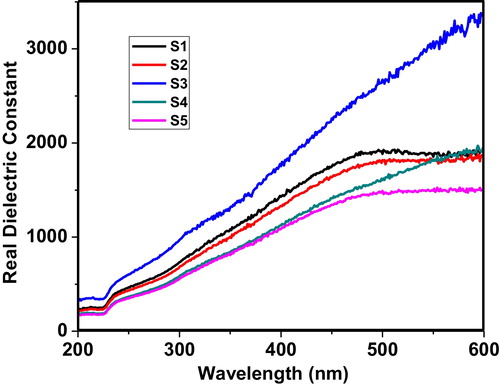
The decrease of the speed of light within the material is determined by the real part of the dielectric constant. The real and imaginary parts of the dielectric constant are computed by the following relations:(4)
(4) where n is the refractive index and K is the extinction coefficient.
shows the behaviour of the real dielectric constant within the wavelength range of 200–600 nm. The plot clearly shows that the real dielectric constant remains nearly constant up to 225 nm; beyond 225 nm, the real dielectric constant increases gradually. The critical analysis of all of the curves shows that only sample S3 is linear beyond 500 nm, which indicates that sample S3 has the capability to slow down light at wavelengths of 200–600 nm.
Fig. 6 Variation of the real dielectric constant of the 60 V2O5–5P2O5–(35 − x)B2O3–xDy2O3 glass system as a function of wavelength.
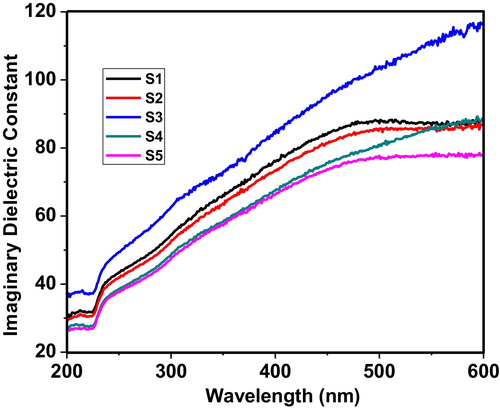
shows the imaginary dielectric constant within the wavelength range of 200–600 nm. The imaginary part of the dielectric constant represents how a dielectric material absorbs energy from an electric field due to dipole motion. The results of the imaginary dielectric constant are in good agreement with the observations of the real dielectric constant: the imaginary dielectric constant of sample S3 also shows a linear behaviour.
Fig. 7 Variation of the imaginary dielectric constant of the 60 V2O5–5P2O5–(35 − x)B2O3–xDy2O3 glass system as a function of wavelength.
4 Conclusions
We have successfully analyzed the complex optical parameters of V2O5–P2O5–B2O3–Dy2O3 glass systems. The complex optical parameters of the glass samples tested were studied using the simple approach of recording UV–VIS spectra. The highest blue shift was shown by sample S3, which indicates that S3 has a large optical band gap. The highest value of the extinction coefficient and optical conductivity was also exhibited by S3. Similarly, the real and dielectric constants show good agreement with each other.
Acknowledgements
The authors would like to thank the Head of the Department of Physics Sant Gadge Baba Amravati University, Amravati for providing facilities required to complete this study. R.V. Barde would like to thank Dr. A. B. Marathe, Principal, HVPM College of Engineering and Technology, Amravati for his significant support during this study. One of the authors, K.R. Nemade would like to thank Prof. P.B. Maheshwari, Prof. S.M. Bang and Prof. N.H. Patil, Directors of J D College of Engineering and Management, Nagpur for also providing the facilities required to complete this study.
Notes
Peer review under responsibility of Taibah University.
References
- J.BallatoE.SnitzerFabrication of fibers with high rare-earth concentrations for Faraday isolator applicationsAppl. Opt.34199568486854
- A.A.ReddyM.C.SekharK.PradeeshS.S.BabuG.V.PrakashOptical properties of Dy3+-doped sodium–aluminum–phosphate glassesJ. Mater. Sci.46201120182023
- J.A.JimenezJ.B.HockenburySpectroscopic properties of CuO, SnO, and Dy2O3 co-doped phosphate glass: from luminescent material to plasmonic nanocompositeJ. Mater. Sci.48201369216928
- M.A.MarzoukM.A.OuisY.M.HamdySpectroscopic studies and luminescence spectra of Dy2O3 doped lead phosphate glassesSilicon42012221227
- R.V.BardeS.A.WaghuleyTransport and physical properties of V2O5–P2O5–B2O3 glasses doped with Dy2O3J. Adv. Ceramics22013246251
- J.ParkH.J.KimS.KimJ.CheonJ.KaewkhaoP.LimsuwanS.InsiripongX-ray and proton luminescences of bismuth-borate glassesJ. Korean Phys. Soc.592011657660
- T.HayakawaM.NogamiN.NishiN.SawanoboriFaraday rotation effect of highly Tb2O3/Dy2O3-concentrated B2O3–Ga2O3–SiO2–P2O5 glassesChem. Mater.14200232233225
- C.NahmElectrical properties and stability of Dy2O3-doped ZnO–Pr6O11-based varistorsJ. Mater. Sci.41200668226827
- S.EkhelikarG.K.BichileSynthesis and structural characteristics of Bi2O3–M2O3 (M = Dy and Pr) binary systemIndian J. Pure Appl. Phys.422004912915
- D.D.RamtekeR.S.GedamStudy of Li2O–B2O3–Dy2O3 glasses by impedance spectroscopySolid State Ionics25820148287
- K.R.NemadeS.A.WaghuleyStrontium oxide quantum dot decorated graphene composites for liquid petroleum gas sensingJ. Chin. Adv. Mater. Soc.12013219228
- K.R.NemadeS.A.WaghuleySynthesis of MgO nanoparticles by solvent mixed spray pyrolysis technique for optical investigationInt. J. Met.2014201416
- Y.B.SaddeekK.A.AlyStructural and optical properties of high refractive indices lead vanadate thin filmsMater. Chem. Phys.1442014433439
- R.VettumperumalS.KalyanaramanR.ThangavelEnhancement of optical conductivity in the ultra-violet region of Cs doped ZnO sol gel thin filmsJ. Sol-Gel Sci. Technol.662013206211