
 ?Mathematical formulae have been encoded as MathML and are displayed in this HTML version using MathJax in order to improve their display. Uncheck the box to turn MathJax off. This feature requires Javascript. Click on a formula to zoom.
Abstract
In this work, a five level central composite design (Box–Wilson design) was employed to optimize the operating conditions for the generation of electricity in a microbial fuel cell. The following three variables were studied: temperature, initial anodic compartment pH and salt bridge component concentrations (agar and KCl). The optimal voltage yield was 17.34% greater than that observed under basal conditions and was achieved with a temperature of 32 °C, constant pH of 7.0 and salt bridge component concentrations of agar: 8.0 g/100 ml and KCL: 2.9 g/100 ml. The maximum recorded voltage at an external resistance of 30 Ω was 861.27 mV. The current density was 2.16 mA/m2, the power density was 1887.49 mW/m2, and the columbic efficiency was 24.12%.
1 Introduction
Microbial fuel cells (MFCs) are a new technology for energy production, and the factors that affect the power output of MFCs are just beginning to be understood [Citation1]. Operating conditions are factors that influence the microbial community on the anode [Citation2]. The application of statistical experimental design techniques for optimization of operating conditions in microbial fuel cells can result in improved product yields, reduced process variability, closer confirmation of the output response to nominal and target requirements and reduced development time and overall costs. The conventional practice of single factor optimization, which maintains all but one factor at an unspecified constant level, does not depict the combined effect of all factors involved. This method is also time consuming and requires a number of experiments to determine optimum levels, which are unreliable. These limitations of the single factor optimization process can be eliminated by optimizing all of the affecting parameters collectively using a statistical experimental design, the five level central composite design [Citation3–Citation5]. Statistical experimental designs have been used for several decades and can be adopted at various phases of an optimization strategy, such as screening experiments and determining the optimal conditions for targeted response(s) [Citation6]. The central composite design is a response surface methodology supported by software, and it is an empirical modelization technique for the evaluation of the relationship of a set of controlled experimental factors and observed results [Citation6]. Prior knowledge of a process is necessary to generate a statistical model using this technique. Basically, this optimization process involves three major steps: estimating the coefficients in a mathematical model, predicting the response and checking the adequacy of the model [Citation7].
In the present work, we report for the first time an optimization strategy for the generation of electricity in a MFC using statistically designed experiments, and we show that this strategy is effective for optimizing MFC technology. A central composite design was employed to determine the optimal operating conditions in a microbial fuel cell as independent variables, including temperature, initial anodic compartment pH and salt bridge component concentrations (agar and KCl).
2 Materials and methods
2.1 Microbial fuel cell configuration
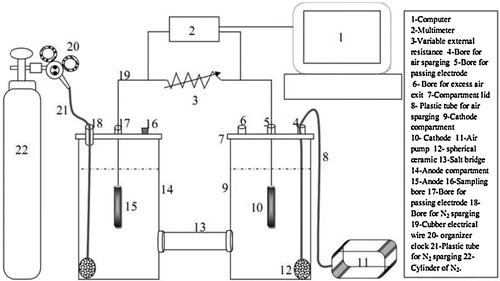
A double-chamber MFC () was constructed as previously described by Al-Shehri et al. [Citation8]. Briefly, the MFC had two compartments of resistance polyethylene, and each had a working volume of 2 L. The electrodes were made of carbon, and each electrode had a total surface area of 13.1 cm2. The compartments were connected to each other via a salt bridge, which was a resistant polyethylene tube with an inner diameter of 1.5 cm and a length of 15 cm. It was placed between the anode and cathode compartments and sealed with rubber sheets inserted between each frame. The electrodes joined each other through variable external resistance (30–1000 Ω).
Fig. 1 Schematic structure of a two-compartment microbial fuel cell.
2.2 Medium, inoculum and operation
The anolyte consisted of a mineral glucose medium (MGM) that had been statistically optimized in a previous work and contained the following components: 8.5 g/l glucose, 0.2 g/l NaHCO3, 0.1 g/l NH4Cl, 0.064 g/l MgSO4·7H2O, 0.8 g/l KCl, 1.5 g/l yeast extract and 20 ml/l of a mixture of vitamins and minerals [Citation9]. The catholyte was composed of 50 mM potassium phosphate buffer solution (PPBS), pH 7.0 at 25 °C, and 100 mM NaCl (1:1, v:v). The components of the salt bridge were (g/100 ml): 2.5 KCl and 5.0 agar. Sewage sediments were standardly collected from Makkah city, Saudi Arabia and then directly sparged with N2 for 10 minutes to remove O2. The sediments were characterized by a dark colour and high viscosity, and they were located under a 40 cm of water body. The sewage sediments were transferred to the laboratory where homogenization under a stream of N2 was performed. Thereafter, 300 g of sewage sediment was transferred to 1 L of MGM and 10 mM KCl (1:1, v:v), which had also been sparged for 10 min with N2, and then the container was closed tightly and kept at 4 °C. Ten millilitres of the treated sewage sediment was used as the inoculum (mixed culture). The electrodes were treated before using 1 M HCl, 1 M NaOH, and distilled water, respectively. All parts of the MFC were assembled under sterile conditions. The anolyte was sparged with N2. The inoculum was 10 ml. The anode compartment was been closed tightly by parafilm, and the entire anode compartment was enveloped with adhesive nylon. The anolyte was stirred continuously by a magnetic bar stirrer. The catholyte was sparged continuously by 1 L/min air.
2.3 Measurements and calculations
The voltage output was measured after the MFC had reached steady state by a digital multimetre (Sanwa CD800a – Japan) connected to a personal computer, and the data were automatically recorded every second using Picolog software (Pico. Technology Limited). The corresponding current was based on the equation I = E/Rext, where I is current (mA), E is voltage (mV) and Rext is external resistance. Power (P) was obtained using the equation P = IE. The current and power densities were normalized based on the projected surface area of the anode using the following equations: IAn = I/AAn, where IAn is current density and AAn is the surface area of the anode; and PAn = E2/AAnRext, where PAn is power density. The polarization curve was obtained at different external resistances (30–1000 Ω). The internal resistance was derived from the polarization curve as the slope.
The efficiency of a MFC performance is often expressed as the coulombic efficiency. To determine coulombic efficiency (CE), which is expressed as the ratio of coulombs transferred from the substrate to the anode to the theoretical maximum coulombs that would be transferred if all of the substrate was oxidized, a group of equations were applied:where Cp is the coulombs of produced energy, I is the current (mA) and t is the time of stable voltage output, which was 30 h on average throughout the experiments.
where Cmax is the theoretical maximum coulombs, F is Faraday's constant (96.485 C/mol of electrons), b is mol of electrons available for removal per mol of substrate, S is substrate concentration (g/l), VAn is the anode chamber volume and MW is the molecular weight of the substrate.
Finally, the coulombic efficiency (CE) is calculated by dividing Cp by Cmax.
Triplicates of all experiments were performed, and mean data values are reported. The standard deviations of the studied parameters ranged from 0.3% to 4.8%.
2.4 The central composite design
The operating conditions for the generation of electricity in a microbial fuel cell were optimized using the central composite design [Citation6,Citation10]. Three variables, temperature (Y1), initial anodic compartment pH (Y2), and salt bridge component concentrations (agar and KCl) (Y3), were included in the model. Each factor was examined at five different levels, relatively low, low, basal, high, and relatively high, and coded as −−, −, 0, + and ++, as shown in . According to the applied design, 16 combinations were executed (), and their observations were fitted to the following second order polynomial model:where Z is the dependent variable (voltage yield); Y1, Y2 and Y3 are the independent variables as mentioned above; b0 is the regression coefficient at the centre point; b1, b2 and b3 are linear coefficients; b12, b13 and b23 are second order coefficients; and b11, b22 and b33 are quadratic coefficients. The values of the coefficients and the optimum levels were calculated using Statistica software. The quality of the fit of the polynomial model equation was expressed as the coefficient of determination, R2. All trials were performed in triplicate, and the average voltage yield observations were considered the responses.
Table 1 Levels of the investigated factors in the central composite design.
Table 2 The central composite design for three independent variables: temperature (Y1), initial anodic compartment pH (Y2), and salt bridge component concentrations (agar and KCl) (Y3).
3 Results and discussion
The design matrix of the coded variables is presented in and shows the results of these experiments. – show the response surface plots for voltage yield (mV) as a function of temperature, initial anodic compartment pH, and salt bridge component concentrations (agar and KCl). Moving along the X and Y axes demonstrates that increasing the temperature, initial anodic compartment pH, and salt bridge component concentrations (agar and KCl) has a conspicuous effect on overall linkage. As a result, the stationary ridge shape was observed on the surface plots for the three operating conditions. As shown in , maximum voltage was clearly obtained under the following optimal conditions: temperature of 32 °C, initial anodic compartment pH of 7.0, and salt bridge component concentrations of 2.8 g/100 ml KCl and 7.0 g/100 ml agar. A second order polynomial function was fitted to the experimental voltage yield results using Statistica software, and the following equation was obtained:where Z is the voltage yield (mV), Y1 is the temperature, Y2 is the initial anodic compartment pH, and Y3 is the salt bridge component concentrations (agar and KCl) (g/100 ml). Solving the model using to the data presented in revealed an optimum response at the following conditions: temperature 32 °C, initial anodic compartment pH 7.0, and salt bridge component concentrations (g/100 ml) of 2.8 KCl and 7.0 agar, with a predicted voltage yield of 832.09 mV. This voltage yield was a 10.21% improvement over the control conditions. To verify the optimization results, an experiment was performed under the predicted optimal conditions with voltage yield as the main response.
Fig. 2 The response of voltage yield (mV) as a function of initial pH and temperature (°C) based on the central composite design results.
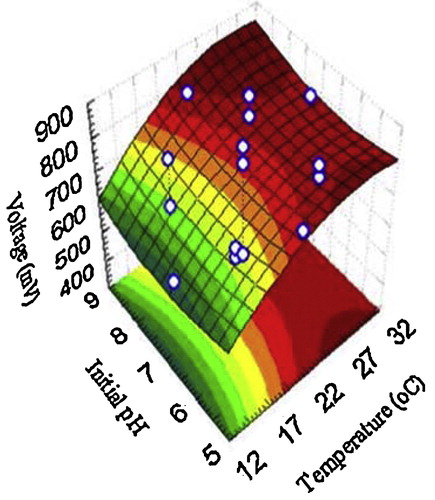
Fig. 3 The response of voltage yield (mV) as a function of salt bridge component concentrations (g/100 ml) and temperature (°C) based on the central composite design results.
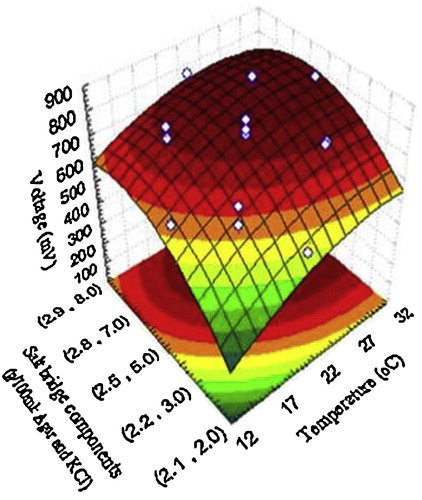
Fig. 4 The response of voltage yield (mV) as a function of salt bridge component concentrations (g/100 ml) and initial pH based on the central composite design results.
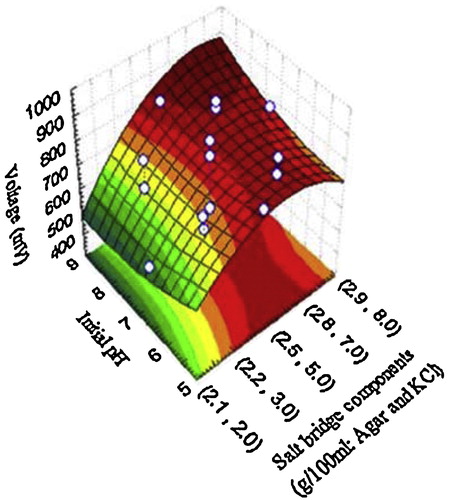
Fig. 5 The relationship between the response (voltage yield) and the different independent variables, showing the predicted optimal values based on the central composite design results.
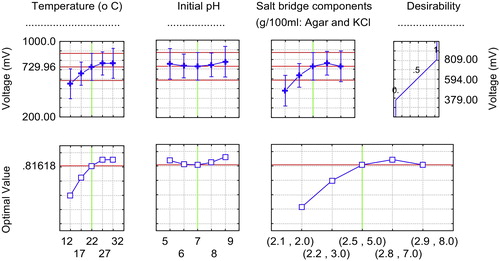
Table 3 Observed responses of three independent variables: temperature, initial anodic compartment pH, and salt bridge component concentrations (agar and KCl).
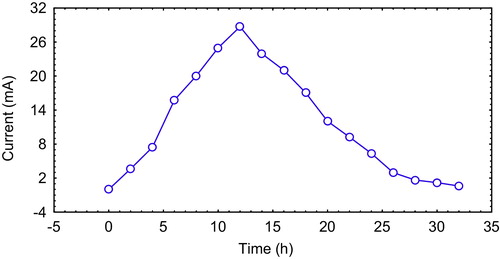
The basal operating conditions, before applying the optimization process of the central composite, were used as the control conditions (temperature 22 ± 2 °C, initial anodic compartment pH 7.0, and salt bridge component concentrations (g/100 ml): 2.5 KCl and 5.0 agar). The optimized operating conditions recorded a voltage yield of 861.27 mV, (28.71 mA), which exceeded both the theoretically predicted yield and the control yield by 3.50% and 17.34%, respectively. The coulombic efficiency was 24.12%, and the internal resistance was 17.45 Ω. The current vs. time curve of the typical batch operation is illustrated in . This result reflects the accuracy and applicability of the central composite model as an extremely powerful method for optimization processes, because using this model, interactions between factors, as well as quadratic effects (curvature), are taken into account and quantified in addition to the examination of each factor at five different levels [Citation11]. The correlation measures for the estimation of the regression equation are the multiple correlation coefficient R and the determination coefficient R2. As the R approaches 1, the correlation between the measured and predicted values increases. In this experiment, the R and R2 values were 0.95 and 0.98, respectively, for voltage yield. These values indicate a high degree of correlation between the experimental and the predicted values.
Fig. 6 Current vs. time curve of a typical batch operation.
Increasing the temperature to 32 °C positively affected voltage yield, possibly because the increased temperature reduced internal resistance by increasing the movement of the molecules, thus, speeding up reaction combining of oxygen molecules with protons in the catholyte, which has a positive effect on proton exchange via the salt bridge [Citation12].pH is critical for all microbial-based processes. In MFCs, pH not only affects bacterial metabolism and growth but also affects the proton transfer and cathode reaction and thus MFC performance [Citation12]. Most MFCs are operated at near-neutral pH to maintain optimal growth conditions for microbial communities involved in electricity generation [Citation1]. Gil et al. [Citation13] reported maximum power generation at pH 7.0 in a two-chamber MFC using a mixed culture enriched from activated sludge.
The positive effect of the new salt bridge component concentrations may be the result of closing of agar molecules and an increase in ionic strength caused by an increase in proton exchange through the salt bridge. This reduces oxygen permeability from the cathode chamber to the anode chamber. All these factors lead to the reduction of internal resistance and increase the potential difference between the chambers.
The statistical optimization process achieved a 17.34% increase in voltage yield compared to control, with a maximum voltage yield of 861.27 mV, current density of 2.16 mA/m2 and power density of 1887.49 mW/m2 at an external resistance of 30 Ω. As these results exceeded those of a number of previous studies [Citation14–Citation18]. The columbic efficiency was 24.12%, which is better than the yield obtained by other investigators [Citation19–Citation22].
Statistical optimization has been successfully applied in many recent biotechnological applications [Citation3–Citation5,Citation23–Citation29]. However, to the best of our knowledge, no single report has described voltage statistical optimization processes using central composite design. The present study proved that MFC is a valuable technology for generating renewable and clean energy from organic substrates. The results indicate that the central composite design was applied successfully to optimize MFC performance in terms of electricity generation.
4 Conclusion
The present study succeeded in using MFC technology to generate clean and renewable bioelectricity from organic substances. MFC technology can be a green and sustainable solution for the global energy crisis, and it can help decrease carbon dioxide emissions, and environmental pollution to help slow climate change. In this work, for the first time, the microbial role of a MFC reactor was improved by optimization of operating conditions using a statistical design (five level central composite), Voltage yield was successfully increased in an economical manner, and this method was found to be reliable and accurate. However, more research is required to optimize MFC performance, especially in terms of power generation, to make MFC technology more attractive in terms of energy recovery.
Notes
Peer review under responsibility of Taibah University.
References
- B.E.LoganMicrobial Fuel Cells2008John Wiley and Sons, Inc.Hoboken, NJ
- Y.AhnB.E.LoganEffectiveness of domestic wastewater treatment using microbial fuel cells at ambient and mesophilic temperaturesBioresour. Technol.1012010469475
- K.M.GhanemS.M.Al-GarniA.N.Al-ShehriStatistical optimization of cultural conditions by surface methodology for phenol degradation by a novel Aspergillus flavus isolateAfr. J. Biotechnol.815200935763583
- K.M.GhanemF.A.Al-fassiR.M.FarsiStatistical optimization of cultural conditions for chitinase production from shrimp shell fish waste by Alternaria alternataAfr. J. Microbiol. Res.513201116491659
- K.M.GhanemS.M.Al-garniA.K.BiagStatistical optimization of cultural conditions for decolorization of methylene blue by mono and mixed bacterial consortiumAfr. J. Microbiol. Res.515201121872197
- G.E.P.BoxK.B.WilsonOn the experimental attainment of optimum conditionsJ. R. Stat. Soc. Ser. B1311951138
- G.AnnaduraiL.Y.LingJ.F.LeeStatistical optimization of medium components and growth conditions by response surface methodology to enhance phenol degradation by Pseudomonas putidaJ. Hazard. Mater.1512008171178
- A.N.Z.Al-ShehriK.M.GhanemS.M.Al-GarniElectricity generation using a two-compartment mediator and mediator-less microbial fuel cell reactorSci. Res. Essays629201161976202
- A.N.Z.Al-ShehriK.M.GhanemS.M.Al-GarniStatistical optimization of medium components to enhance bioelectricity generation in microbial fuel cellArab. J. Sci. Eng.3820132127
- R.L.MasonR.F.GunstJ.L.HessStatistical Design and Analysis of Experiments with Applications to Engineering and Science1989John Wiley and SonsNew York
- S.ParekhV.A.VinciR.J.StrobelImprovement of microbial strains and fermentation processesAppl. Microbiol. Biotechnol.542000287301
- S.K.KhanalAnaerobic Biotechnology for Bioenergy Production: Principles and Application2008John Wiley and Sons, Inc.
- G.C.GilI.S.ChangB.H.KimM.KimJ.K.JangH.S.ParkH.J.KimOperational parameters affecting the performance of a mediator-less microbial fuel cellBiosens. Bioelectron.182003327334
- X.ZhuJ.NiSimultaneous processes of electricity generation and p-nitrophenol degradation in a microbial fuel cellElectrochem. Commun.112009274277
- J.NiessenU.SchroderF.ScholzExploiting complex carbohydrates for microbial electricity generation a bacterial fuel cell operating on starchElectrochem. Commun.62004955958
- E.ZhangW.XuG.DiaoC.ShuangElectricity generation from acetate and glucose by sedimentary bacterium attached to electrode in microbial anode fuel cellsJ. Power Sources1612006820825
- G.AntonopoulouK.StamatelatouS.BebelisG.LyberatosElectricity generation from synthetic substrates and cheese whey using a two chamber microbial fuel cellBiochem. Eng. J.5020101015
- Y.LuoR.ZhangG.LiuJ.LiM.LiC.ZhangElectricity generation from indole and microbial community analysis in the microbial fuel cellJ. Hazard. Mater.1762010759764
- J.R.KimS.H.JungJ.M.ReganB.E.LoganElectricity generation and microbial community analysis of alcohol powered microbial fuel cellsBioresour. Technol.98200725682577
- L.HuangR.J.ZengI.AngelidakiElectricity production from xylose using a mediator-less microbial fuel cellBioresour. Technol.99200841784184
- K.J.ChaeM.J.ChoiJ.W.LeeK.Y.KimI.S.KimEffect of different substrate on the performance, bacterial diversity, and bacterial viability in microbial fuel cellsBioresour. Technol.100200935183525
- N.LuS.G.ZhouL.ZhuangJ.T.ZhangJ.R.NiElectricity generation from starch processing wastewater using microbial fuel cell technologyBiochem. Eng. J.432009246251
- K.J.Al-AhmadiM.T.YazdiM.F.NajafiA.R.ShahverdiOptimization of medium and cultivation conditions for chitinase production by the newly isolated Aeromonas spBiotechnology722008266272
- M.A.LopesD.S.GomesM.G.Bello-KoblitzC.P.PirovaniJ.CascardoA.Goes-NetoF.MichellUse of response surface methodology to examine chitinase regulation in the basidiomycete Moniliophthora perniciosaMycol. Res.1122008399406
- S.M.AkhirS.Abd-AzizM.M.SallehR.A.RahmanR.M.IlliaM.A.HassanMedium optimization of chitinase enzyme production from shrimp waste using Bacillus licheniformis TH-1 by response surface methodsBiotechnology812009120125
- W.M.AlalayahM.S.KalilA.A.H.KadhumJ.JahimA.ZaharimN.M.AlaujA.El ShafieApplications of the Box–Wilson design model for bio-hydrogen production using Clostridium saccharoperbutylacetonicum N1-4(ATCC13564)Pavlov. J. Biol. Sci.13142010674682
- A.N.Z.Al-ShehriEmploying a central composite rotatable design to define and determine significant toxic levels of heavy metals on Shewanella putrefaciens in microbial fuel cellArab. J. Sci. Eng.201410.1007/s13369-014-1477-9
- A.N.Z.Al-ShehriStatistical optimization of pentachlorophenol biodegradation and electricity generation simultaneously in mediator-less air cathode microbial fuel cellJ. Environ. Appli. Biores.312015615
- A.N.Z.Al-ShehriEmployment of microbial fuel cell technology to biodegrade naphthalene and benzidine for bioelectricity generationInt. J. Curr. Micobiol. Appl. Sci.2015 (In press)