
 ?Mathematical formulae have been encoded as MathML and are displayed in this HTML version using MathJax in order to improve their display. Uncheck the box to turn MathJax off. This feature requires Javascript. Click on a formula to zoom.
Abstract
A simple low cost method has been developed and validated for the determination of trace amounts of palladium (II) ions in water and fertilizer samples. The method is based on the reaction of palladium (II) ions with the reagent neothorin (2-(2-arsonophenylazo) chromotropic acid disodium salt). The complex formed exhibits an absorption maximum at 567 nm (λmax) in Britton–Robinson (BR) buffer (pH = 2). The corrected absorbance of the formed complex at λmax was obtained by employing a β-correction spectrophotometric method. The Beer–Lambert law and Ringbom’s plots of the coloured palladium reagent complex were obeyed in the concentration ranges of 0.05–2.7 and 0.1–2 μg mL−1 palladium (II) ions, respectively, with relative standard deviations in the range of ±1.3–2.1%. The limits of detection (LOD) and quantitation (LOQ) of the procedure were 0.011 and 0.04 μg mL−1 palladium, respectively. The proposed method was applied for the analysis of palladium (II) ions in spiked tap, mineral and underground water samples. The results of the developed method were satisfactorily compared with the data obtained by the inductively coupled plasma-mass spectrometric (ICP-MS) method. Statistical comparison of the results of the proposed method with those obtained by the standard method revealed no significant differences in accuracy and precision. The developed method offers a simple system coupled with good reproducibility, accuracy, ruggedness and cost effectiveness.
1 Introduction
Palladium is one of the precious metals. Owing to its corrosion resistant nature and ability to form alloys, palladium is an important element in metallurgy [Citation1]. Palladium is an element belonging to the platinum element group (Pt, Rh, Ir, Os and Au). This element is found at low concentrations in several matrices [Citation2,Citation3]. The significance of palladium as a transition metal lies in its wide spectrum of applications, especially in electrical and electronic industries, catalysts, dentistry and medical devices, jewellery, surgical instruments, electrical contacts and nano-particles for the development of new active catalysts [Citation4–Citation7]. Its alloys are used in manufacturing. Moreover, palladium is used in automobile catalysts together with Pt and Rh [Citation1].
Some Pd compounds have been reported as potential health risks to humans, causing asthma, allergies, rhino conjunctivitis and other serious health problems [Citation8,Citation9]. Thus its determinations are very difficult. As such, the development of an analytical technique for Pd determination has been a challenge for researchers. Pd determination is of special interest because this element is a new contaminant to the environmental due the introduction of automobile catalysts containing elements of the platinum element group. Pd is also being studied by the medical field for use in a possible new antitumor drug [Citation2,Citation3]. Moreover, palladium metal has been used as a catalyst. It is ubiquitous in the development and manufacture of active pharmaceutical ingredients. Palladium is an expensive metal, and its potential for negative biological effects is unknown. Therefore, the need to recover spent palladium is driven both by cost and by government regulations requiring residual palladium to be very low in product and waste streams [Citation10–Citation12]. It was thus considered worthwhile to explore the possibility of developing a simple, sensitive and selective method for the determination of trace amounts of palladium in various samples [Citation13].
The development of analytical methods for the determination of Pd is important for the effective monitoring of pollution levels of this metal in the environment. Although the concentration of Pd in different compartments of the environment continuously increases, it is still at the level of ng g−1 (or ng mL−1). Numerous interactions between the analyte and the matrix constituents can significantly influence both the limit of detection and the accuracy of the analytical method. Many methods have already been developed for the determination of palladium in real samples. These are based on atomic absorption spectrometry (AAS) [Citation7,Citation14], including both flame (FAAS) [Citation7] and electrothermal spectrometry (GFAAS) [Citation15–Citation19], inductively coupled plasma atomic emission spectrometry (ICPAES) or inductively coupled plasma mass spectrometry (ICP-MS) [Citation20–Citation22]. These determination techniques are usually difficult, and an initial sample pretreatment, such as the preconcentration of the analyte and matrix separation, is often necessary [Citation23]. Several techniques have been developed to determine Pd in different matrices, such as neutron activation analysis (NAA) [Citation24–Citation26], optical emission spectrometry (OES) [Citation27], X-ray fluorescence (XRF) [Citation28] and sensor membranes [Citation13]. Although these methods have good sensitivities, they require expensive instruments, well-controlled experimental conditions and profound sample preparation.
The β-correction method [Citation29–Citation33] is an analytical method, which is different from other dual-wavelength spectrophotometric methods. This technique eliminates the interference of excess chromogenic reagent, thus enhancing the sensitivity of the method and minimizing the analytical error. Therefore, the overall goals of this work are as follows: (i) developing a precise and low cost procedure for the determination of Pd using the chromogenic reagent neothorin and (ii) applying the proposed method for the analysis of Pd in complex matrices, e.g., water. The factors influencing Pd determination were systematically studied. The method was successfully applied to determine trace amounts of Pd in water and soil samples.
2 Experimental
2.1 Apparatus
The absorbance measurements of the reagent and its palladium (II) complex were measured with a Shimadzu (MultiSpec-1501) double beam spectrophotometer (190–800 nm) with a 1 cm (path width) quartz cell. A digital micro-pipette (BRAND) and a digital pH meter (model MP 220, Metter Toledo) were employed for the preparation of the standard solutions and pH measurements. A Perkin Elmer inductively coupled plasma-optical emission spectrometer (ICP-OES, Optima 4100 DC, Shelton, CT, USA) was used and operated at the optimum operational parameters for Pd determination ().
Table 1 ICP-OES operational conditions and the wavelength (nm) for palladium (II) determination.
2.2 Reagents and materials
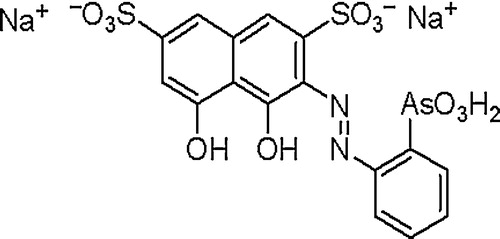
Analytical reagent grade chemicals and solvents were used without further purification. A stock solution of palladium (1000 μg mL−1) was prepared from palladium (II) chloride (Fluka, AG Buchs, Switzerland). More dilute standard solutions were then prepared by the dilution of the stock solution and were finally stored in low density polyethylene (LDPE) bottles. An accurate weight of the BDH (BDH Chemicals, Poole, England) reagent neothorin (2-(2-arsonophenylazo) chromotropic acid disodium salt) () was dissolved in water (100 mL). A series of Britton-Robinson (BR) buffers (pH = 2–11.7) was prepared as reported earlier [Citation34].
Fig. 1 Chemical structure of the neothorin reagent (2-(2-arsonophenylazo) chromotropic acid disodium salt).
2.3 Recommended procedure
In a series of volumetric flasks (10 mL), an appropriate concentration (0.05–2.0 μg mL−1) of palladium solution was added to the reagent solution (0.25 mL, 1 × 10⁻³ M) and BR buffer at a pH of 2. The test solution was diluted to the mark with distilled water. The solution mixtures were allowed to stand at room temperature for 3 min before measuring the absorbances at 500 nm (λ1) and 567 nm (λmax).
2.4 Analytical applications
2.4.1 Determination of the palladium in tap, mineral and ground water
Tap water collected from the laboratories of the Chemistry Department, Taibah University, Al-Madinah Al-Minawara city, KSA, and mineral water, commercially available in the Saudi market, were filtered through a 0.45 μm cellulose membrane filter prior to analysis and stored in LDPE sample bottles (250 mL). The recommended general spectrophotometric procedure used to prepare the standard curve was followed, and the concentration of palladium (II) ions was then determined from the standard curve using the following equation:(1)
(1) where Cstd is the standard concentration and Asamp and Astd are the corrected absorbances of the sample and the standard, respectively. Alternatively, the standard addition method was employed as follows: a known volume (5.0 mL) of the unknown water sample was transferred to a volumetric flask (10.0 mL). An accurate volume (0.25 mL) of the reagent was then added to the test solution, and the reaction mixture was then diluted to the mark with distilled water. The same procedures were repeated after adding various concentrations (0.1–2 μg mL−1) of palladium (II) ions. The true absorbances displayed by the test solutions were measured before and after the addition of the standard (0.1–2 μg mL−1) palladium (II) solution by employing the β-correction spectrophotometry method. The concentration of palladium (II) was then determined via the calibration curve of the standard addition procedure.
2.4.2 Determination of palladium in the certified reference material (IAEA-Soil-7)
An accurate weight (0.1002 ± 0.0001 g) of the CRM (IAEA-Soil-7) sample was transferred into a Teflon beaker (50.0 mL) containing HF (7.0 mL), concentrated HCl (2.0 mL), and concentrated HNO3 (5.0 mL) at room temperature to digest the sample gradually and slowly. The reaction mixture was then heated slowly for 1 h at 100–150 °C on a hot plate. After the evolution of NO2 fumes had ceased, the reaction mixture was evaporated to near dryness and mixed again with concentrated HNO3 (5.0 mL). The process was repeated thrice, and the mixture was again evaporated to dryness. After evaporation, the solid residue was then redissolved in dilute nitric acid (10.0 mL, 1.0 mol L−1). The resulting mixture was filtered through Whatman 41 filter paper, transferred to a volumetric flask (100.0 mL), and diluted to the mark with deionized water [Citation35]. An accurate volume of the test solution (0.1 mL) was then transferred into the measurement flask (10.0 mL) in the presence of the reagent (0.25 mL, 1 × 10⁻³ M), and various concentrations (0.1–2 μg mL−1) of palladium were added separately. The solutions were then diluted to the mark with doubly deionized water, and the absorbances of the test solutions were measured by dual-wavelength β-correction spectrophotometry. The concentration of palladium was finally determined via the standard addition curve. The measurements are the average of five independent measurements, and the precision in most cases was ±2%.
3 Results and discussion
3.1 Electronic spectra of the reagent and its palladium chelate
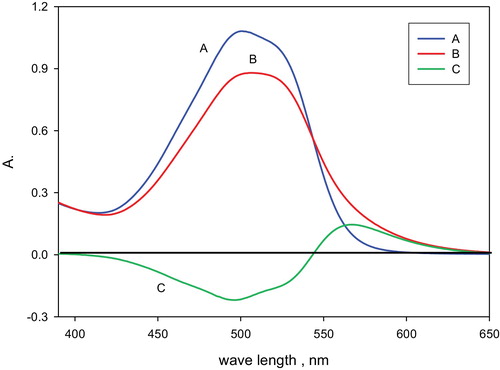
A preliminary screening investigation on the interaction of the neothorin reagent with palladium (II) ions in aqueous media with shaking revealed the formation of a coloured complex. The electronic absorption spectra of the reagent and its palladium (II) complex are shown in . The spectrum of the reagent compared to water showed one well-defined peak at 500 nm (λ1), while in the spectrum of the palladium complex against the reagent blank a well-defined absorption peak (λ2) at 567 nm with a molar absorptivity (ɛ) of 2.5 × 10⁴ L mol−1 cm−1 was observed (). These results suggest the possible application of the β-correction spectrophotometric technique to improve the sensitivity of the proposed reaction for the determination of palladium (II) in the subsequent work. Moreover, the interference caused by excess chromogenic reagent in the reaction mixture will be eliminated. Therefore, the real absorbance (Ac) of the produced palladium (II) complex in solution was calculated using the following equation:(2)
(2) where ΔA and ΔA′ are the absorbances of the palladium (II) chelate at λ2 and λ1, respectively, versus the reagent blank as a reference. The spectrophotometric parameters α and β were calculated employing the following equations:
(3)
(3)
(4)
(4) where
and A0 are the absorbances of the blank solution at λ1 and λ2, respectively, against water as a blank, and Aα and Aα are the absorbances of the complex formed in the solution at λ2 and λ1 versus water, respectively. Moreover, it should be noted that the sensitivity of the developed β-correction method was improved over that of the single wavelength method by selecting the wavelengths λ1 and λ2 at the valley and peak of the electronic spectrum of the chelate versus the blank solution [Citation36], respectively. Curve C in demonstrates the minimum and maximum absorption of the palladium–neothorin complex at 500 nm (λ1) and 567 nm (λ2), respectively. Thus, the absorbance of the palladium (II) complex formed at λ2 when the blank was used as a reference (single wavelength method) was found to be less than the corrected absorbance by the β-correction spectrophotometric technique. From (curve A), the calculated parameter β was found to be equal to 0.14, while the correction coefficient α567 calculated from (curve B) was 3.7, thus confirming the accuracy of the method.
Fig. 2 Electronic spectra of the reagent neothorin and its palladium complex. Curve A is the spectrum of the reagent blank (reference, water); B is palladium (II) complex (reference, water); and C is the palladium complex (reference, reagent blank).
3.2 Influence of different parameters on the determination of palladium
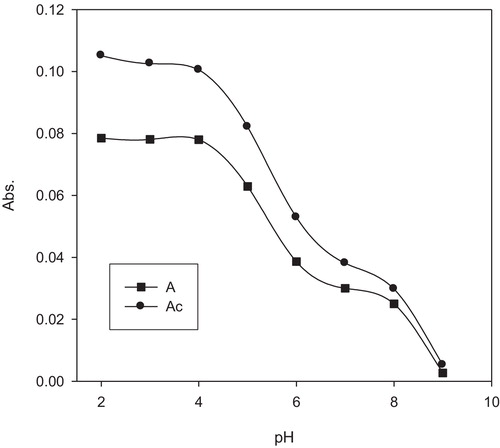
The influence of the pH of the aqueous solution employing BR buffer (pH = 2–11) on the developed coloured complex was studied by measuring the real absorbance of the solution containing palladium ions at a suitable concentration (0.05–2.0 μg Pd/mL) in the presence of the reagent neothorin. The results are shown in , where it is clearly observed that the maximum absorbance of the produced coloured complex was obtained at a pH of 2.
Fig. 3 Influence of the pH of the aqueous test solution on the real absorbance of the palladium–neothorin complex with (Ac) and without (A) spectral correction. Conditions are as follows: reagent concentration = (1 × 10⁻³ M) and palladium = 1 μg mL−1.
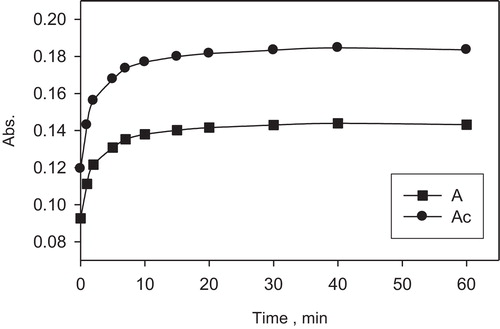
The influence of the concentration of neothorin on the formation of the palladium ion complex (1 μg mL−1) was studied. Various volumes of the reagent (1 × 10⁻³ M) solution were added to the test solutions. A 0.25 mL amount of the reagent (1 × 10⁻³ M) was found to be sufficient to quantitatively determine the palladium up to 1.0 μg mL−1 in the aqueous solution. A large excess of the reagent decreased the absorbance possibly due to the increased acidity of the aqueous phase, which minimizes the formation of the complex. (The stability of the formed complex with the time was critically investigated and the results are demonstrated in ())
Fig. 4 Plot of the absorbance (stability) of the formed palladium–neothorin complex versus time with (Ac) and without (A) spectral correction. Reagent concentration = (1 × 10⁻³ M); palladium = 1 μg mL−1in the aqueous solution.
3.3 Interference study
The determination of palladium ions at a concentration 1.0 μg mL−1 in the presence of relatively high excesses (0.05–1.0 mg) of some diverse ions relevant to water, e.g., alkali and alkaline earth metals, Cu2+, Pb, Ni2+, Na+, Ru+, K+, Ca2+, Al3+, Ni2+, Cr3+, Cd2+, Fe3+, I−, SO42−, NO3− and PO43− ions, was critically investigated by the developed procedure. The tolerance limit (w/w) was defined as the concentration of the other ion added that caused a relative error within ±2% in the true absorbance of the palladium–neothorin complex. The results revealed that the presence of large amounts of the following foreign ions: Ca2+, NH4+, Li+, Mg2+, PO43−, CH3COO− and NO3− did not cause any significant change in the corrected absorbance of the Pd complex and were tolerable even at 1:1000 concentrations of Pd to the foreign ion. The ions Co2+, Ni2+, Cd2+, F− and Cl− at a 100-fold excess to the palladium ions also did not interfere. The ions Pb2+ and Fe3+ at concentrations 50 times higher than those of the analyte caused serious interference. The addition of a few drops of NaCl (0.1%, w/v) and NaF (1.0%, w/v) to the aqueous solution eliminates the positive interferences caused by Pb2+ and Fe3+ ions, respectively.
3.4 Stoichiometry of the palladium complex
The chemical structure of the produced palladium complex was determined by the method of continuous variation at various concentrations of the palladium ions and the reagent. A plot of the true absorbance of the produced coloured solution at 567 nm versus the mole fraction of the reagent revealed a graph that indicated the formation of a complex having a palladium to reagent molar ratio of 1:2. These data confirmed that the coloured species most likely fit with the molecular formula of the palladium-reagent complex.
3.5 Analytical performance
At the optimum experimental conditions for the reaction of the reagent neothorin with palladium in an aqueous solution, the effective molar absorptivities (ɛ) calculated from a Beer–Lambert plot and Sandell’s sensitivity index [Citation37] of the palladium-complex with and without the use of β-correction spectrophotometry were found to be equal to 2.5 × 10⁴ L mol−1 cm−1, 9.0 × 10³ L mol−1 cm−1, 0.004 μg cm−2 and 0.01 μg cm−2, respectively. The sensitivity of the β-correction spectrophotometric method was found to be much better than that obtained by the single wavelength method as indicated from the molar absorptivity. The plot of the absorbance of the palladium (II) complex at 567 nm versus palladium (II) concentrations employing β-correction spectrophotometry obeyed the Beer–Lambert law in the concentration range 0.05–2.7 μg mL−1. The regressions of the linear plots without and with the use of β-correction spectrophotometry were given by the following equations:(5)
(5)
(6)
(6) where C is the concentration of the palladium ions in μg mL−1. The effective concentration range of palladium (II) ions as evaluated by Ringbom’s plot [Citation38] was obeyed in the range of 0.1–2 μg mL−1. The precision and accuracy of the developed procedure were evaluated by the recovery studies of four replicate measurements of palladium in distilled water at a concentration level of 1.0 μg mL−1 using the β-correction spectrophotometry method. The relative standard deviation and the relative error of the developed β-correction method were 2% and 1.8%, respectively. The level of precision was found to be suitable for the routine analysis of palladium in various water samples. Under the conditions established for palladium ions, the lower limits of detection (LOD) and quantification (LOQ) of palladium were determined employing the following equations [Citation39]:
(7)
(7) and
(8)
(8) where δ is the standard deviation (n = 5) of the blank, and b is the slope of the calibration plot. The values of the LOD and LOQ of the developed procedure without using the β-correction absorbance values were found to be 0.033 and 0.11 μg mL−1 palladium, respectively. Such limits were improved to lower the detection and quantification limits of 0.011 and 0.04 μg mL−1 palladium, respectively, by employing the developed β-correction method using the optimum experimental conditions. A comparison of the main analytical features of the proposed method was made with many of the previously published spectrophotometric [Citation40–Citation47] methods and is summarized in . A statistical comparison of the results of the proposed method with those of the standard method was performed, and no significant differences in the accuracy and precision were found, as indicated from the value of the Student’s t test at 95% confidence, where the values did not exceed the theoretical value of 2.31. Thus, the method provides a simple approach with good reproducibility and precision for the determination of palladium.
Table 2 Analytical features of the developed and some of the reported spectrophotometric methods for the Palladium determination.
3.6 Analytical applications
The validity of the proposed method was tested by the analysis of the palladium in tap, mineral and underground water samples. For this purpose, different concentrations of palladium ions in the concentration range of 0.1–2.0 μg mL−1 were spiked into the tested water samples. The palladium content in each sample was then determined via the developed method, and the results are summarized in . The results obtained are in good agreement with the data obtained from the ICP-MS method. The statistical evaluations involving the F test revealed no significant differences between the two variances of the developed and the ICP-MS methods. The calculated value of F (2.233) is less than the tabulated F value (6.39) for five replicate measurements. Therefore, there is no significant difference in the precision of the two methods at the 95% confidence level. At the 95% confidence level, the calculated value of t for the results obtained analysing the ground water sample was found to be 0.705 (n = 5) at a 2 μg mL−1 concentration of palladium ions, while the theoretical one value is t = 2.306; therefore, there is no difference between the two means.
Table 3 Analysis of palladium ions in tap-, mineral- and ground-water samples by the developed (A) and the ICP-MS (B) methods.Table Footnotea
Moreover, the validity of the proposed method was also tested by the analysis of the palladium in the CRM IAEA-Soil-7 under the conditions described in experimental Section 2.4.2. The true absorbance of the test solutions calculated via the proposed dual wavelength β-correction spectrometry was plotted versus the concentration of palladium added. The spiked palladium concentration was determined via the standard addition curve. The agreement was acceptable between the results obtained by the developed β-correction spectrometric method (0.0 ± 0.01 μg g−1), ICP-MS (0.0 ± 0.04 μg g−1) and the certified value (0.0–0.0 μg g−1) for the CRM sample.
4 Conclusions
The proposed method provides a simple and reliable means for the determination of palladium at trace levels in complex matrices, such as water. The method also has the advantage of virtual freedom from interference from extraneous ions and can therefore serve as an alternative to the widely used flameless AAS for the rapid and precise determination of trace amounts of palladium in natural water and effluent samples. A calibration matrix constructed with the β-correction spectrophotometric method has been successfully applied for the analysis of palladium (II) ions in real samples. Most of the reported methods suffer from many drawbacks, e.g., high cost, multiple steps, time consuming, and costly solvents (HPLC), while the proposed method offers a stable system with a short analytical time coupled with good reproducibility and cost effectiveness.
Notes
Peer review under responsibility of Taibah University.
References
- A.TunceliA.R.TurkerAnal. Sci.1620008185
- E.WongC.M.GiandomenicoChem. Rev.99199924512466
- A.F.CairesE.T.AlmeidaA.E.MauroJ.P.HemerlyS.R.ValentiniQuím. Nova221999329354
- T.N.LokhanndeM.A.AnuseM.B.ChavanTalanta461998163169
- R.SahuS.M.SondhiB.GuptaTalanta421995401405
- R.W.Hesse“Palladium”. Jewelrymaking Through History: an Encyclopedia2007Greenwood Publishing Group146
- R.R.BarefootJ.C.Van LoonTalanta491999114
- R.MergetG.RosnerSci. Total Environ.2702001165173
- K.RavindraL.BencsR.V.GriekenSci. Total Environ.3182004143 Review
- N.T.S.PhanM.Van Der SluysC.W.JonesAdv. Synth. Catal.3482006609679
- K.KohlerS.S.ProcklW.KleistCurr. Org. Chem.10200615851601
- J.G.de VriesDalton Trans.2006421429
- H.TavallaliM.JahromiJ. Serb. Chem. Soc.7432009311315
- H.ZhengH.LiY.ZengL.MaYankuang Ceshi242005299302
- M.A.TaherZ.DaliriH.FazeliradChin. Chem. Lett.2542014649654
- PeiLiangEhongZhaoFengLiTalanta77200918541857
- B.Goldlewska-ZylkiewiczM.ZaleskaAnal. Chim. Acta4622002305312
- M.IglesiasE.AnticóV.SalvadóTalanta592003651657
- P.LiangE.ZhaoF.LiTalanta775200918541857
- B.A.LesniewskaB.Godlewska-ZylkiewiczA.HulanickiChem. Anal. (Warsaw, Pol.)502005945950
- Y.C.SunC.H.HsiehJ. Anal. At. Spectrom.1720029498
- C.P.R.MorcelliA.M.G.FigueiredoJ.E.S.SarkisJ.EnzweilerM.KakazuJ.B.SigoloSci. Total Environ.34520058191
- B.Godlewska-ZylkiewiczMicrochim. Acta1472004189210
- M.SchwarzerM.SchusterR.Von HentigFresenius J. Anal. Chem.3682000240243
- S.PostaF.KukulaRadioisotope171976559576
- A.R.ByrneMikrochim. Acta (Wien)I1981323329
- M.Geldmacher-von MallinckrodtM.PoothArch. Toxicol.251969518
- A.W.GertlerIsr. J. Chem.341994425433
- A.AbbaspourL.BaramakehTalanta572002807812
- A.HamzaA.S.BashammakhA.A.Al-SibaaiH.M.Al-SaidiM.S.El-ShahawiJ. Hazard. Mater.1782010287292
- A.HamzaA.S.BashammakhA.A.Al-SibaaiH.M.Al-SaidiM.S.El-ShahawiAnal. Chim. Acta65720106974
- R.MirzajaniA.R.KiasatE-J. Chem.822011711720
- O.E.SherifY.M.IssaA.S.Abo-DenaIJRPC412014181191
- A.I.VogelQuantitative Inorganic Analysis3rd ed.1966Longmans Group Ltd.England
- M.KadiJ. Hazard. Mater.1682–3200912801283
- H.CaoP.F.ZhangAnalyst119199421092111
- E.B.SandellColorimetric Method of Analysis1959Wiley InterscienceNew York445
- A.RingbomFresenius Z. Anal. Chem.1151938332343
- J.C.MillerJ.N.MillerStatistics for Analytical Chemistry4th ed.1994Ellis-HowoodNew York115
- A.A.EnsafiH.EskandariMicrochem. J.631999266275
- I.SrivaniA.Praveen KumarP.Raveendra ReddyK.P.P.R.Mohan ReddyV.Krishna ReddyAnn. Chim.9711–12200712371245
- B.K.ReddyK.J.ReddyJ.R.KumarA.K.KumarA.V.ReddyAnal. Sci.2062004925930
- G.S.KalwaniaM.RajivR.Shyam1M.PriyaJ. Nat. Consci.212011306311
- S.Lakshmi NarayanaK.Janardhan ReddyS.Adinarayana ReddyJ.Rajesh KumarA.Varada ReddyJ. Chin. Chem. Soc.54200712331241
- L.S.SarmaJ.R.KumarK.J.ReddyA.K.KumarA.V.ReddyAnal. Sci.18200212571261
- J.H.GaoB.PengH.Y.FanJ.W.KangX.D.WangTalanta441997837842
- S.Lakshmi NarayanaC.RamachandraiahA.varada ReddyDongyeunLeeJaesoolShimE-J. Chem.812011217225