
 ?Mathematical formulae have been encoded as MathML and are displayed in this HTML version using MathJax in order to improve their display. Uncheck the box to turn MathJax off. This feature requires Javascript. Click on a formula to zoom.
Abstract
Simple, rapid, cost-effective, sensitive and extractive spectrophotometric methods were developed for the determination of two antifungal drugs (i.e., sertaconazole nitrate (SER) and miconazole nitrate (MCO)) in pure and dosage forms. The methods are based on the formation of ion-pair complexes between the drugs and acid dyes (i.e., bromocresol purple (BCP), bromophenol blue (BPB) and methyl orange (MO)) in acidic buffer solutions. The formed complexes were extracted with chloroform and measured at 410, 416 and 427 nm for SER and at 408, 415 and 426 nm for MCO using BCP, BPB and MO, respectively. The analytical parameters and their effects on the reported systems were investigated. Beer’s law was obeyed in the 1.0–20 and 1.0–24 μg mL−1 ranges for SER and MCO, respectively. The composition of the ion pairs was determined to be 1:1. The molar absorptivity, Sandell sensitivity, limits of detection and limits of quantification were calculated. Other method validation parameters, such as precision, accuracy, robustness, ruggedness and selectivity, were satisfactory. The proposed methods have been successfully applied for the analysis of the studied drugs in their pure and dosage forms. Statistical comparison of the results with the reference methods indicated excellent agreement and no significant difference in accuracy and precision.
1 Introduction
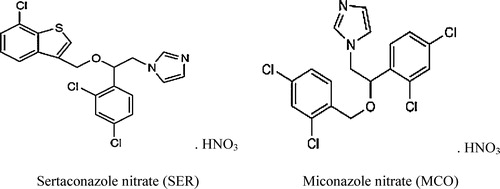
Imidazole drugs are a group of antifungal drugs that have broad-spectrum antifungal activities against a wide range of fungi that cause various mycotic infections [Citation1]. The members of this group are structurally related and have similar physicochemical properties and mechanisms of action. The members of the imidazole group are miconazole (base or nitrate salt) and sertaconazole (base or nitrate salt) [Citation1]. Although there are a number of imidazole drugs currently available, their efficacy may not be completely achieved for the treatment of human mycoses due to their poor water solubility and limited dissolution properties that are associated with slow drug absorption, leading to inadequate and variable bioavailability [Citation1,Citation2]. The chemical structures of the studied imidazoles antifungal drugs (i.e., sertaconazole (SER); (±)-1-{2,4-dichloro-β-[(7-chlorobenzo[b] thien-3-yl)methoxy] phenethyl}imidazole nitrate and miconazole (MCO), 1-[2,4-dichloro-β-(2,4-dichlorobenzyloxy) phenethyl] imidazole nitrate) are shown in .
Fig. 1 Chemical structure of the studied antifungal drugs.
A survey of the literature revealed that several analytical methods have been reported for the determination of the studied drugs in the pure drug form, pharmaceutical dosage forms and biological samples using liquid chromatography, either in single or combined form [Citation3–Citation18], capillary zone electrophoresis methods [Citation19], electrochemical methods [Citation20], non-aqueous titration [Citation2], spectrofluorimetric methods [Citation16,Citation21] and spectrophotometric methods [Citation21–Citation32].
Visible spectrophotometry has remained competitive in the area of chromatographic techniques for pharmaceutical analysis due to its simplicity and cost effectiveness, sensitivity and selectivity, fair accuracy, precision and available in most quality control laboratories. In addition, this method does not require the costly instrumentation that is required for the published HPLC methods.
Extractive spectrophotometric procedures are popular due to their sensitivity in the assay of drugs, and therefore, ion-pair extractive spectrophotometry has received considerable attention for the quantitative determination of many pharmaceutical compounds [Citation33–Citation40].
In the current study, the development of accurate, reproducible, simple, precise, sensitive and economical extractive spectrophotometric method for the determination of both antifungal drugs (SER and MCO) in their pure and dosage forms was investigated based on the formation of chloroform soluble ion–associate complexes between the studied drugs and acid dyes (BCP, BPB or MO).
2 Experimental
2.1 Apparatus
All of the absorption spectra were recorded on a Kontron Unikon 930 (UV–vis) spectrophotometer (Germany) equipped with 10 mm matched quartz cells at a scanning speed of 200 nm/min and a band width of 2.0 nm. The pH values of the various buffer solutions were confirmed using a Hanna pH-metre instrument (pH 211) (Romania) equipped with a combined glass calomel electrode.
2.2 Materials and reagents
All of the chemicals and reagents were of analytical grade and used without further purification. In addition, all of the solutions were prepared fresh daily, and the water was doubly distilled.
2.2.1 Materials
Pure grade sertaconazole nitrate (SER) was provided by October Pharma Drug Company, Egypt, and the miconazol nitrate (MCO) working standard was supplied by Amriya Pharmaceutical Industries Co., Egypt.
2.2.2 Pharmaceutical formulations
All of the pharmaceutical preparations were obtained from commercial sources in the local markets (i.e., Dermofix cream labelled to contain 2.0 mg SER/g (October Pharma. Co., Egypt, Ferrer International, SA, Spain), Miconaz cream labelled to contain 2.0% MCO/15 g (Medical Union Pharmaceuticals, Abu-Sultan, Ismailia, Egypt), Micoban cream labelled to contain 2.0% MCO/15 g (Amriya Pharmaceutical Industries Co., Egypt)).
2.2.3 Preparation of stock standard solutions
Stock standard solutions with concentrations of 100 μg mL−1 and 1.0 × 10⁻³ mol L−1 of SER or MCO, were prepared by dissolving an exact mass of pure drug in bidistilled water containing a few drops of 0.1 mol L−1 hydrochloric acid and completed to 100 mL with bidistilled water. The standard solutions were stable for at least one week without alteration when maintained in amber collared bottles and stored in a refrigerator when not in use.
2.2.4 Reagents
Bromocresol purple (BCP), bromophenol blue (BPB) and methyl orange (MO) (BDH Chemicals Ltd., Poole, England) were used without further purification.
The stock solutions (1.0 × 10⁻³ mol L−1) of the reagents were prepared by dissolving the appropriate weight of each reagent in 10 mL of 96% ethanol followed by dilution to 100 mL with bidistilled water. These solutions were stable for at least 1 week when maintained in the refrigerator.
A series of buffer solutions consisting of KCl–HCl (pH = 1.5–4.2), NaOAc–HCl (pH = 1.99–4.92), NaOAc–AcOH (pH = 3.0–5.6) and potassium hydrogen phthalate–HCl (pH = 2.0–7.0) were prepared according to previously published standard methods [Citation41].
2.3 General procedures
2.3.1 For SER
Aliquots (0.1–2.4 mL) of the standard SER solution (100 μg mL−1) were transferred to 10-mL measuring flasks, and 2.0 mL of acetate buffer at a pH of 3.0 and 4.0 containing BCP, BPB or MO, respectively, were added. Then, 2.0 mL of the reagent solution (1.0 × 10⁻³ mol L−1) was added. The total volume of each solution was brought up to 10 mL with bidistilled water. The formed ion–associate complexes were extracted twice with 10 mL of chloroform by shaking for 2.0 min. Then, the solution was allowed to stand for clear separation of the two phases, and the chloroform layer was passed through anhydrous sodium sulphate. The absorbance of the yellow collared complexes was measured at 410, 416 and 427 nm using BCP, BPB and MO, respectively, against a corresponding reagent blank that was similarly prepared. All of the measurements were performed at room temperature (25 ± 2 °C). The procedures were repeated for other analyte aliquots, and calibration plots were drawn to calculate the amount of SER in the unknown analyte samples.
2.3.2 For MCO
Aliquots (0.1–2.0 mL) of the standard MCO solution (100 μg mL−1) were transferred to 10 mL measuring flasks and 2.0 mL of acetate buffer at a pH of 3.0 containing BCP, BPB or MO, respectively, were added. Then, 2.0 mL of the reagent solution (1.0 × 10⁻³ mol L−1) was added. The total volume of each solution was completed to 10 mL with bidistilled water. The formed ion–associate complexes were extracted twice with 10 mL of chloroform by shaking for 2.0 min. Then, the solution was allowed to stand for clear separation of the two phases, and the chloroform layer was passed through anhydrous sodium sulphate. The absorbance of the yellow collared complexes was measured at 408, 415 and 426 nm using BCP, BPB and MO, respectively, against a corresponding reagent blank that was similarly prepared. All of the measurements were performed at room temperature (25 ± 2 °C). The procedures were repeated for the other analyte aliquots, and calibration plots were drawn to calculate the amount of MCO in the unknown analyte samples.
2.4 Applications to pharmaceutical formulations
An accurately weighed portion of the cream or topical solution samples equivalent to 20 mg of the drug was shaken and gently heated in ethanol until the sample was completely dissolved and then filtered. The resulting clear solution was diluted to 50 mL with ethanol. Then, an appropriate dilution of the solution was prepared with water, and the recommended procedure was followed. The standard addition method was also employed for the accurate determination of the content of SER and MCO.
2.5 Stoichiometric relationship
The stoichiometric ratios of the ion–associate complexes formed between the studied drugs and the reagents were determined by applying the continuous variation [Citation42] and molar ratio [Citation43] methods at the wavelengths of maximum absorbance. In the continuous variation method, equimolar solutions were employed (i.e., 5.0 × 10⁻⁴ mol L−1 standard solutions of drug and 5.0 × 10⁻⁴ mol L−1 solutions of dye). A series of solutions were prepared in which the total volume of the studied drugs and the dye was maintained at 2.0 mL. The drug and reagent were mixed in various complementary proportions (0:2, 0.2:1.8, 0.4:1.6, …, 2:0, inclusive) and completed to volume in a 10 mL calibrated flask with the appropriate solvent for extraction according to the previously mentioned procedure. In the molar ratio method, the concentrations of SER and MCO (5.0 × 10⁻⁴ mol L−1) are held constant by using 1.0 mL, and the concentrations of the dyes (5.0 × 10⁻⁴ mol L−1) are regularly varied (0.2–2.4 mL). The absorbance of the prepared solutions was measured at the optimum wavelength for each complex.
3 Results and discussion
3.1 Absorption spectra
The nitrogenous drugs are present in their positively charged protonated forms, and the anionic dyes with a sulphonephthalein group primarily exist in their anionic form at pH ≥ 2.5. Therefore, when treated with an acid dye with acidic buffer solutions in a pH range of 2.5–5.0, a yellow ion-pair complex, which is extracted with chloroform, is formed. The absorption spectra of the ion-pair complexes, which were formed between SER or MCO and the reagents, were measured in the 350–550 nm range against the blank solution. The maximum absorbances of the ion-pair complexes were located at 410, 416 and 427 nm for SER and 408, 415 and 426 nm for MCO using BCP, BPB and MO, respectively (–).
Fig. 2 Absorption spectra of the ion-pair complexes of 10 and 16 μg mL−1 SER and MCO with 1.0 × 10⁻³ mol L−1 BCP reagent against a reagent blank.
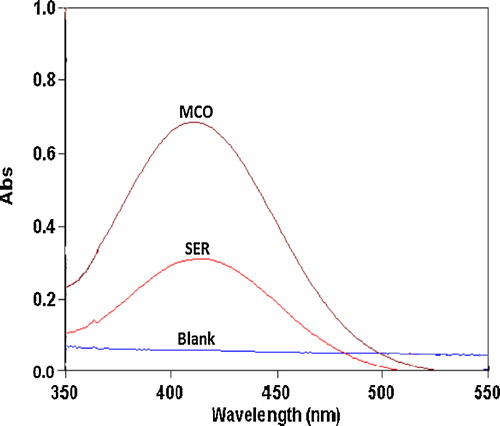
Fig. 3 Absorption spectra of the ion-pair complexes of 14 and 18 μg mL−1 SER and MCO with 1.0 × 10⁻³ mol L−1 BPB reagent against the reagent blank.
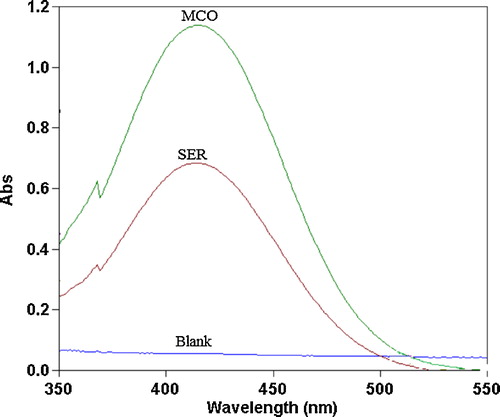
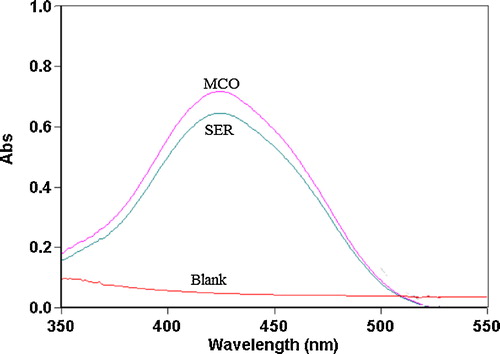
Fig. 4 Absorption spectra of ion-pair complexes of 20 and 24 μg mL−1 SER and MCO with 1.0 × 10⁻³ mol L−1 MO reagent against reagent blank.
3.2 Optimum reaction conditions for complex formation
The methods were optimized to achieve complete reaction formation, the highest sensitivity and maximum absorbance. The reaction conditions of the ion-pair complex were determined by studying the results from preliminary experiments with varying conditions, such as the pH of buffer, type of organic solvent, volume of the dye, reaction time and temperature, for the extraction of the ion-pair complexes.
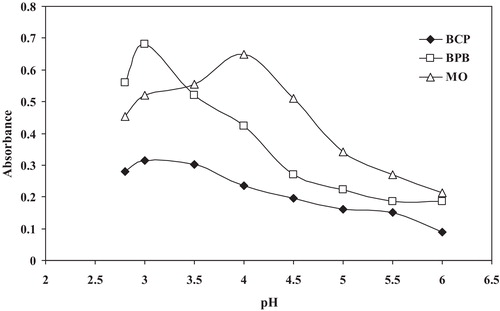
3.2.1 Effects of pH on ion-pair formation
The effect of pH on the formation of the drug–reagent complex was studied by extracting the collared complexes in the presence of various buffers. For SER, the maximum colour intensity and highest absorbance value were observed using the NaOAc–AcOH buffer at a pH of 3.0 and 4.0 using (BCP or BPB) and MO, respectively. For MCO, the highest absorbance values were observed at a pH of 3.0 using BCP, BPB or MO (). In addition, 2.0 mL of the optimum buffer solutions afforded the maximum absorbance with reproducible results.
Fig. 5 Effect of the pH of the acetate buffer solution on ion-pair complex formation between 14 μg mL−1 SER and BCP, BPB and MO reagents (1.0 × 10⁻³ mol L−1).
3.2.2 Effect of the extracting solvents
The effect of several organic solvents (i.e., chloroform, carbon tetrachloride, methanol, ethanol, acetonitrile, n-butanol, benzene, acetone, ethyl acetate, diethyl ether, toluene, dichloromethane and chlorobenzene) was studied to achieve effective extraction of the collared species from the aqueous phase. Among the studied reagents, chloroform was determined to be the most suitable solvent for quantitative extraction of the collared ion-pair complexes. The experimental results indicated that a double extraction with a total volume of 10 mL of chloroform yielded the maximum absorbance intensity, stable absorbance for the studied drugs and considerably lower extraction ability for the reagent blank with the shortest time to reach equilibrium between both phases.
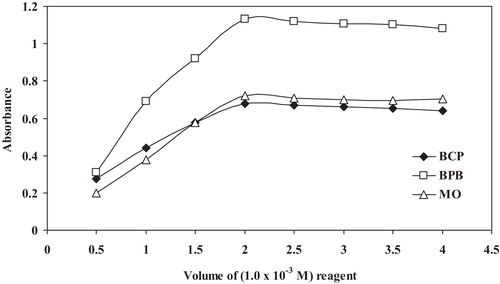
3.2.3 Effects of reagents concentration
The effect of the reagents was studied by measuring the absorbance of the solutions containing a fixed concentration of the studied drugs and varied amounts of the respective reagents. The maximum colour intensity of the complex was achieved with 2.0 mL of each of the reagent solutions (1.0 × 10⁻³ mol L−1). However, a larger volume of the reagent had no pronounced effect on the absorbance of the formed ion-pair complexes ().
Fig. 6 Effect of the volume of the BCP, BPB and MO reagents (1.0 × 10⁻³ mol L−1) on ion-pair complex formation with 14 μg mL−1 MCO.
3.2.4 Effect of time and temperature
The optimum reaction time was investigated from 0.5 to 5.0 min by following the colour development at ambient temperature (25 ± 2 °C). Complete colour intensity was achieved after 2.0 min of mixing for each of the complexes. The effect of temperature on the collared complexes was investigated by measuring the absorbance values at different temperatures. The collared complexes were stable up to 35 °C. At higher temperatures, the drug concentration increased due to the volatile nature of chloroform. For all of the reagents, the absorbance remains stable for at least 12 h at room temperature.
3.3 Stoichiometric relationship
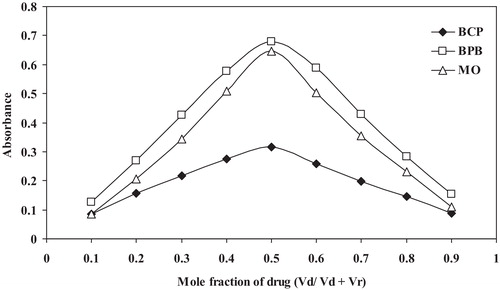
Job’s method of continuous variation [Citation42] of equimolar solutions was employed, and a 5.0 × 10⁻⁴ mol L−1 standard solution of the drugs and a 5.0 × 10⁻⁴ mol L−1 solution of BCP, BPB or MO were used. A series of solutions was prepared in which the total volume of the drug and reagent was maintained at 2.0 mL. The absorbance was measured at the optimum wavelength.
The molar ratio of the reagents (drug: dye) in the ion-pair complexes was determined by the continuous variations method (Job’s method) (). The results indicated that 1:1 (drug: dye) ion-pair complexes were formed due to electrostatic attraction between the positively charged protonated SER+ or MCO+ and negatively charged BCP−, BPB or MO−. The extraction equilibrium can be represented as follows:where SER+ and D− represent the protonated SER and the anion of the dye, respectively, and the subscript (aq) and (org) refer to the aqueous and organic phases, respectively ().
Fig. 7 Job’s method of continuous variation plot for the reaction of SER with dyes: BCP, BPB and MO, [drug] = [dye] = 5.0 × 10⁻⁴ mol L−1.
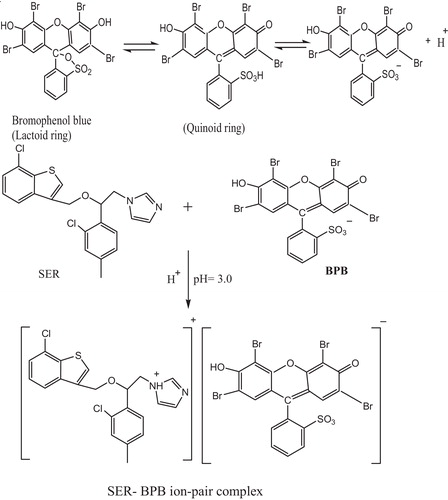
Scheme 1 Proposed reaction mechanism for the ion-pair complex formation between SER and BPB.
3.4 Method of validation
3.4.1 Linearity
Under the studied experimental conditions for SER and MCO determination, standard calibration curves with reagents were constructed by plotting the absorbance as a function of the concentration. The statistical parameters are provided in the regression equation calculated from the calibration graphs. The linearity of the calibration graphs was confirmed by the high correlation coefficients (r) and the small y-intercept values of the regression equations. The apparent molar absorptivities of the resulting collared ion-pair complexes and relative standard deviation of the response factors for each proposed spectrophotometric method were also calculated and are listed in . The molar absorptivity was BCP > BPB > MO ion-pair complexes for both drugs (SER and MCO).
Table 1 Statistical analysis of the calibration graphs and analytical data in the determination of SER and MCO using the proposed methods.
3.4.2 Sensitivity
The limits of detection (LOD) and quantitation (LOQ) for the proposed methods were calculated using the following equation [Citation44,Citation45]:where s is the standard deviation of the response of the blank or the standard deviation of the intercepts of the regression lines and k is the sensitivity (i.e., the slope of the calibration plot). According to the formula, the limits of detection for SER were determined to be 0.21, 0.29 and 0.55 μg mL−1 using BCP, BPB and MO methods, respectively, and for MCO, the LODs were determined to be 0.25, 0.28, and 0.57 μg mL−1 using BCP, BPB and MO methods, respectively. The limit of quantitations for SER were determined to be 0.70, 0.97 and 1.83 μg mL−1 using BCP, BPB and MO methods, respectively, and for MCO, the LOQs were determined to be 0.83, 0.93 and 1.90 μg mL−1 using BCP, BPB and MO methods, respectively (). Therefore, according to the lower values of the detection limits, the sensitivity of the proposed methods is higher than that of the previously reported spectrophotometric methods.
3.4.3 Accuracy and precision
To evaluate the accuracy and precision of the proposed methods, solutions containing three different concentrations of each of the studied drugs were prepared. The assay procedure was analysed in six replicates, and the relative standard deviation given as a percentage (RSD%) was obtained within the same day to evaluate the repeatability (intra-day precision) and over five different days to evaluate the intermediate precision (inter-day precision). The analytical results of the intra-day and inter-day precision and accuracy are summarized in and . Low values for the relative standard deviation of the precision and relative error (RE%) of the accuracy of the proposed methods were calculated. The relative error was calculated using the following equation:
Table 2 Intra-day and inter-day precision and accuracy data for SER obtained using the proposed methods.
Table 3 Intra-day and inter-day precision and accuracy data for MCO obtained using the proposed methods.
These results for the accuracy and precision indicate that the proposed methods exhibit good repeatability and reproducibility.
3.4.4 Robustness and ruggedness
The robustness of the method were evaluated by making small incremental changes in the volumes of the dye (2.0 ± 0.2 mL), the volumes of the buffer (2.0 ± 0.2 mL) and the reaction times (2 ± 0.5 min), and the effect of these changes on the absorbance of the collared systems was studied. These changes had a negligible influence on the results, which was revealed by the small intermediate precision values expressed as RSD (≤3.0%). The ruggedness of the method was demonstrated by performing the analysis with three analysts as well as by performing the analysis with a single analyst on three different instruments in the same laboratory. The intermediate precision values (RSD) of this study were ≤3.0%, indicating acceptable ruggedness.
3.4.5 Effects of interference
To assess the usefulness of the method, the effect of diluents, excipients and additives that often accompany SER and MCO in its dosage forms (i.e., starch, lactose, glucose, saccharose, talc, sodium chloride, titanium dioxide, and magnesium stearate) was studied. The results indicated that there was no interference from the excipients and additives, indicating a high selectivity for the determination of the studied SER and MCO in its dosage forms.
3.5 Analysis of pharmaceutical formulations
The proposed methods have been successfully applied to the determination of SER and MCO in pharmaceutical dosage forms. Six replicate determinations were performed. In addition, to confirm the validity of the proposed methods, the dosage forms were tested for possible interference using the standard addition method (). There was no significant difference between the slopes of the calibration curves and the standard addition methods. Therefore, the excipients in the pharmaceutical dosage forms of SER and MCO did interfere in the analysis of SER and MCO. The results were compared to those obtained using the previously reported methods for the determination of SER and MCO [Citation2]. Based on Student’s t-value and variance ratio F-value at the 95% confidence level, statistical analysis indicated no significant difference between the accuracy and precision of the proposed methods and the previously reported methods for pharmaceutical formulations [Citation45]. The results indicated that Student’s t- and F-values at the 95% confidence level did not exceed the theoretical values, which confirmed the good agreement between the results obtained from the proposed methods and the reference methods with respect to the accuracy and precision ().
Table 4 Application of the standard addition technique for the determination of SER and MCO in dosage forms using the proposed methods.
4 Conclusion
This paper describes the application of an extractive ion-pair complexation reaction with acid dyes for the quantification of two antifungal drugs (SER and MCO) in pure and dosage forms. In comparison to the existing spectrophotometric methods, the proposed methods are relatively simple, rapid, cost-effective, free from auxiliary reagents and more sensitive for the determination of the studied drugs in pure and dosage forms. In addition, the proposed methods are free from the tedious experimental steps, such as heating, that are employed in the previously reported methods. The most attractive feature of these methods is their relative freedom from interference by the usual diluents and excipients in amounts far in excess of their normal occurrence in pharmaceutical formulations. The statistical parameters and the recovery data indicate good accuracy and precision of the methods. Therefore, the validated methods could be useful for routine quality control assays of the studied drugs in the raw pharmaceutical materials and dosage forms.
Conflict of interest
The authors declare that they have no conflict of interests with the company name used in the paper.
Notes
Peer review under responsibility of Taibah University.
References
- S.SweetmanMartindale (the Complete Drug Reference)36th ed.2009The Pharmaceutical PressLondon
- British Pharmacopoeia, Vol. I &II, Monographs: Medicinal and Pharmaceutical Substances2012The Stationary OfficeLondon, UK (electronic version)
- S.AsgharS.SheikhS.AhmadSimultaneous determination and validation of miconazole nitrate with the antimicrobial preservatives using RP-HPLC method: for benzoic acid, sodium propyl hydroxyl benzoate and sodium methyl hydroxy benzoate in pharmaceutical creamInt. J. Pharm. Res. Sch.32014106113
- M.BirsanI.C.CojocaruM.M.ScutariuI.PopoviciValidation of achromatographic method for miconazole assay from oral sustained release mucoadhesive tabletsFarmacia622014555563
- W.A.DayyihN.Al SaadiM.HamadDevelopment and validation of HPLC method for some azoles in pharmaceutical preparationInt. J. Pharm. Sci. Res.3201236863692
- H.B.PagarS.D.BarhateM.M.BariDevelopment and evaluation of mucoadhesive buccal patches of miconazole nitrate by using tamarind gum and HPMCPharm. Sin.2201193101
- I.SalamaM.S.GomaaComparative determination of miconazole, nystatin, hydrocortisone and neomycin by HPTLC/HPLC-DADEur. J. Chem.420132934
- M.M.De ZanM.S.CámaraJ.C.RoblesDevelopment and validation of a simple stability indicating high performance liquid chromatographic method for the determination of miconazole nitrate in bulk and cream formulationsTalanta792009762767
- P.K.PagareC.S.SatputeV.M.JadhavV.KadamForced degradation studies and validated stability-indicating HPTLC method for determination of miconazole nitrate in soft lozengesPharm. Lett.4201217931804
- S.AshourN.KattanSimultaneous determination of miconazole nitrate and metronidazole in different pharmaceutical dosage forms by gas chromatography and flame ionization detectorInt. J. Biomed. Sci.620101318
- D.B.MeshramS.B.BagadeM.R.Tajnesimultaneous determination of metronidazole and miconazole nitrate in gel by HPTLCPak. J. Pharm. Sci.222009323328
- M.M.De ZanM.S.CámaraJ.C.RoblesS.V.KergaravatH.C.GoicoecheaDevelopment and validation of a simple stability-indicating high performance liquid chromatographic method for the determination of miconazole nitrate in bulk and cream formulationsTalanta792009762767
- Y.-C.YuZ.-D.LiB.WangY.WangM.-K.ZhongDetermination of content of miconazole nitrate in urea and miconazole cream by HPLC methodPharm. Care Res.82008367369
- B.A.MousaN.M.El-KousyR.I.El-BagaryN.G.MohamedStability indicating methods for the determination of some anti-fungal agents using densitometric and RP-HPLC methodsChem. Pharm. Bull.562008143149
- Y.L.SongSimultaneous determination of two main components in compound miconazole nitrate cream by RP-HPLCChin. J. Antibiot.302005597600
- N.SalamaA.MohamedStability-indicating methods for the determination of sertaconazole nitrate by micelle-enhanced spectrofluorimetry and TLC-densitometryBull. Chem. Soc. Ethiop.232009167174
- W.YuanyuanP.LuluW.ManyingO.NingValidated LC–MS/MS method for determination of sertaconazole nitrate in human plasmaJ. Chromatogr. B877200940474050
- C.AlbetJ.FernandezE.RozmanJ.PerezA.SacristanJ.OrtizDetermination of sertaconazole nitrate, a new imidazole antifungal, by high-performance liquid chromatographyJ. Pharm. Biomed. Anal.101992205211
- E.NemutluC.YardimciN.OzaltinDetermination of sertaconazole in pharmaceutical preparations by capillary zone electrophoresisAnal. Chim. Acta54720058388
- F.C.PereiraN.R.StradiottoM.V.B.ZanoniVoltammetric characteristics of miconazole and its cathodic stripping voltammetric determinationAn. Acad. Bras. Ciênc.742002425432
- P.Y.KhashabaS.R.El-ShabouriK.M.EmaraA.M.MohamedAnalysis of some antifungal drugs by spectrophotometric and spectrofluorimetric methods in different pharmaceutical dosage formsJ. Pharm. Biomed. Anal.222000363376
- M.D.ArunM.P.SunilL.G.KailashA.J.GeyDevelopment and validation of spectrophotometric methods for the simultaneous estimation of miconazole nitrate and mitronidazole in bulk powder formInt. Res. J. Pharm.52014597603
- N.AlizadehR.AnsariN.K.RezaeeExtractive spectrophotometric determination of miconazole nitrate in pure and pharmaceutical preparationJ. Pharm. Health Sci.120124552
- S.R.KadamM.V.JanjaleS.B.AkoleS.S.BhosaleApplication of mixed hydrotropic solubilization technique for simultaneous spectrophotometric estimation of metronidazole and miconazole nitrate from different pharmaceutical dosage formsInt. J. Pharm. Biol. Arch.32012383390
- V.CavriniA.M.Di PietraM.A.RaggiColorimetric determination of miconazole nitrate in pharmaceutical preparationsPharm. Acta Helv.561981163165
- R.J.EkiertJ.KrzekDetermination of azole antifungal medicines using zero-order and derivative UV spectrophotometryActa Pol. Pharm. Drug. Res.6620091924
- N.ErkSimultaneous determination of metronidazole and miconazole nitrate in ovules by spectrophotometric methodsS.T.P. Pharma Sci.61996312315
- S.R.El-ShabouriK.M.EmaraP.Y.KhashabaA.M.MohamedCharge-transfer complexation for spectrophotometric assay of certain imidazole antifungal drugsAnal. Lett.31199813671385
- N.G.GöğerL.GökçenQuantitative determination of miconazole in creams by second order derivative spectrophotometryAnal. Lett.32199925952602
- K.WróbelK.WróbelI.M.De La Garza RodríguezP.L.López-De-AlbaL.M.López-MartínezDetermination of miconazole in pharmaceutical creams using internal standard and second derivative spectrophotometryJ. Pharm. Biomed. Anal.20199999105
- N.ErkM.L.AltunSpectrophotometric resolution of metronidazole and miconazole nitrate in ovules using ratio spectra derivative spectrophotometry and reverse-phase (RP)-LCJ. Pharm. Biomed. Anal.252001115122
- M.H.G.DehghanM.ShahedA.A.SatapathyW.AhamadSpectrophotometric methods for the determination of sertaconazole nitrate in bulk and pharmaceutical dosage formsPharm. Anal. Qual. Assur.20112011
- R.El-SheikhM.ZakyF.Z.MohamedA.S.AminA.A.GoudaSpectrophotometric determination of dextromethorphan hydrobromide and ketamine hydrochloride in pure and dosage formsJ. Chin. Chem. Soc.532006831838
- A.S.AminA.A.GoudaR.El-ShiekhF.ZahranSpectrophotometric determination of gatifloxacin in pure form and in pharmaceutical formulationSpectrochim. Acta A67200713061312
- A.Al KafA.A.GoudaSpectophotometric determination of tadalafil in pure and dosage formsChem. Ind. Chem. Eng. Q.172011125132
- R.El SheikhN.S.EsmailA.A.GoudaW.Abdel BassetExtractive spectrophotometric determination of some α-adrenergic-antagonists in pure forms and in pharmaceutical formulationsChem. Ind. Chem. Eng. Q.182012179191
- A.A.GoudaZ.El ShafeyN.HossnyR.El-AzzazySpectrophotometric determination of hyoscine butylbromide and famciclovir in pure form and in pharmaceutical formulationsSpectrochim. Acta A702008785792
- W.S.HassanM.M.El- HenaweeA.A.GoudaSpectrophotometric determination of some histamine H1-antagonist drugs in their pharmaceutical preparationsSpectrochim. Acta A692008245255
- A.A.GoudaA.S.AminR.El-SheikhA.G.YousefSpectrophotometric determination of gemifloxacin mesylate, moxifloxacin hydrochloride, and enrofloxacin in pharmaceutical formulations using acid dyesJ. Anal. Methods Chem.20142014116http://dx.doi.org/10.1155/2014/286379
- R.El-SheikhM.ZakyA.A.GoudaS.A.Aboal EzzExtractive spectrophotometric determination of vardenafil HCl and yohimbine HCl in pure and pharmaceutical dosage formsJ. Chil. Chem. Soc.59201422482255
- R.ScorpioFundamentals of Acids, Bases, Buffers & Their Application to Biochemical Systems2000
- P.JobSpectrochemical Methods of Analysis1971Wiley IntersienceNew York346
- D.A.SkoogD.M.WestF.J.HollerFundamentals of Analytical Chemistryseventh ed.1996Saunders College PublishingPhiladelphia
- ICH harmonized tripartite guideline, Validation of analytical procedures: text and methodology, Q2(R 1), complementary guideline on methodology dated 06 November 1996International Conference on Harmonization of Technical Requirements for Registration of Pharmaceuticals for Human Use2005ICHLondon
- J.N.MillerJ.C.MillerStatistics and Chemometrics for Analytical Chemistryfifth ed.2005Prentice HallEngland