
 ?Mathematical formulae have been encoded as MathML and are displayed in this HTML version using MathJax in order to improve their display. Uncheck the box to turn MathJax off. This feature requires Javascript. Click on a formula to zoom.
Abstract
Poultry litter (a mixture of rice hulls, sawdust and chicken excreta of broilers) mixed with the co-substrate cow dung and poultry droppings was evaluated under anaerobic conditions for the production of biogas (methane). Four laboratory scale reactors, R1, R2, R3 and R4, were set up with different proportions of waste poultry litter, cow dung and poultry droppings and had a 6% total solid concentration. Digestion was carried out for 50 days at room temperature, 32 ± 3 °C. Volatile solid degradation and specific gas production in the four reactors was 46%, 51.99%, 51.96%, 43% and 0.263, 0.469, 0.419, 0.221 l/g, respectively, based on the volatile solid (VS) feed. The methane yields were 71%, 72.5%, 72.6% and 70%, respectively. The COD reductions were 46.1%, 50.76%, 48.23% and 45.12%, respectively. A kinetic analysis showed that the anaerobic digestion of poultry litter with a co-substrate followed first order kinetics. Among the experimental reactors, R2 (25% cow dung, 75% poultry litter) gave the optimum results: a VS reduction of 51.99%, a specific gas yield of 0.469 l/g and a methane yield of 72.5%.
1 Introduction
Biogas is an environmental friendly and one of the most efficient and effective options for renewable energy among various other alternative sources [Citation1]. Biogas is produced by the biomethanation process, and the effluent from the process is rich in essential nutrients that can be utilized as a very good fertilizer. Biomethanation is the degradation of organic materials by microorganisms in the absence of oxygen. It is a multi-step biological process in which organic carbon is converted mostly to carbon dioxide and methane [Citation2]. Biogas can be produced from variety of substrates, such as animal manure, energy crops, industrial waste and so on. The typical reactions that occur in the anaerobic digestion process [Citation1,Citation3] are:
Acetogenic bacteria:
Methanogenic bacteria:
Bangladesh is home to approximately 160 million people. Recently, poultry farms in Bangladesh have been rapidly expanding to meet the growing demand for meat and eggs. There are 123 million chickens [Citation4] and approximately 50,000.00 poultry farms [Citation5] in Bangladesh. It is estimated that approximately 1,560,000.00 metric tonnes of poultry manure is produced in Bangladesh each year. Including bedding material, wasted feed and feathers, the total poultry waste (litter) is much higher. Most of the waste materials are dumped into nearby sites, although a small portion of poultry waste is used for fish and crop production by farmers. Crude dumping of this waste is not only unattractive but also environmentally unsafe. Biogas production can be a sustainable solution to treat waste materials, and the cost of waste treatment using this process is low. Poultry waste, cow dung and other waste have been used for biogas production [Citation1,Citation6], but the efficiency of the gas production is low.
In this study, biomethanation of poultry litter was studied with the co-substrates cow dung and poultry droppings. A comparative analysis using different materials was performed on biogas production.
2 Materials and methods
2.1 Sample collection
The poultry litter and poultry droppings were collected from Joypara, Dohar, Dhaka. Cow dung was also used in various proportions as a co-substrate to maintain the C/N ratio.
2.2 Preparation of reactors
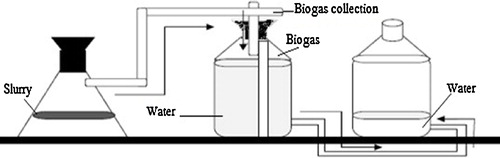
The anaerobic digestion process was studied in batch reactors to develop an appropriate technology for the production of biogas from the solid waste from poultry farms. A known amount of substrate containing a mixture of waste was transferred into a 2-litre, wide mouth glass bottle. All of the bottles were sealed with air tight rubber stoppers, and another bottle was filled with water to collect gas and was equipped with glass tubes for gas removal. Biogas produced by anaerobic digestion was collected by the water displacement method [Citation7]. Four reactors were prepared using various proportions of poultry litter and other materials. Reactor R1 was set up using poultry litter alone. R2 was prepared using 75% poultry litter and 25% cow dung, R3 was 50% poultry litter and 50% cow dung and R4 was 70% poultry litter and 30% poultry droppings. A reactor is pictured in .
Fig. 1 Outline of the experimental setup for biogas generation.
2.3 Sample analysis
The sample pH was measured with a digital pH metre (HANNA, HI 98204). The carbon and nitrogen content of the poultry litter, poultry droppings and cow dung were determined with a C–H–N elemental analyser. Total solids (TS) were determined by incubating a sample at 104 °C until no further weight change was evident, and volatile solids (VS) were measured by the loss on ignition of the dried sample at 550 °C. The composition of the gas was measured using an Orsat gas analyser. COD was determined by a chemical method, and the calorific value was determined in a bomb calorimeter. The total gas production was measured via the water displacement method at an interval of 24 h. The pH, VS reduction and COD reduction were measured every 10 days throughout the experiment. Each experiment was conducted at a temperature of 32 ± 3° C for 50 days.
3 Results and discussion
Various parameters of the raw materials are shown in . shows that the C/N ratio of poultry litter is 7.5, which is quite low for optimum biogas generation [Citation8], and it can be increased by mixing with cow dung because cow dung has a high C/N ratio. When a substrate with a low C/N ratio is mixed with a substrate that has a high C/N ratio, better performance is achieved [Citation7]. The pH of the poultry litter is 8.5. The buffering capacity of cow dung is very good, and it also acts as the source of various microorganisms required for anaerobic digestion [Citation9].
Table 1 Characterization of raw materials used in the biogas digester.
3.1 Biomethanation potential of digesters
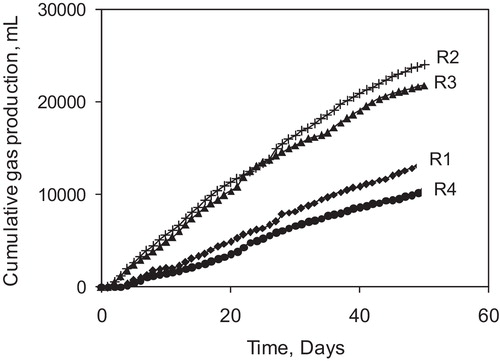
Cumulative gas generation in different reactors is plotted in . The gas generation rate was higher in reactor R2 than in the others, even though reactor R2 contained less cow dung than R3. It can be concluded that the potential gas generation from poultry litter via anaerobic digestion with a certain proportion of added cow dung is high.
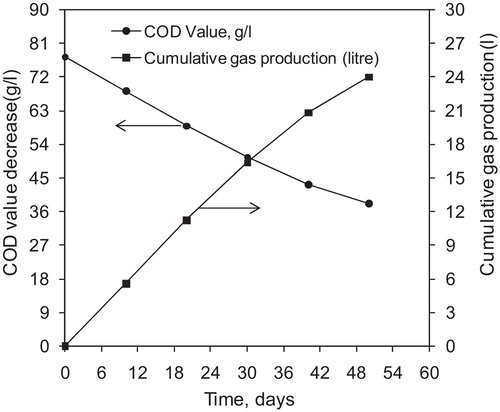
Fig. 2 Cumulative gas production with time at different reactors.
3.2 Effect of volatile solids on gas production
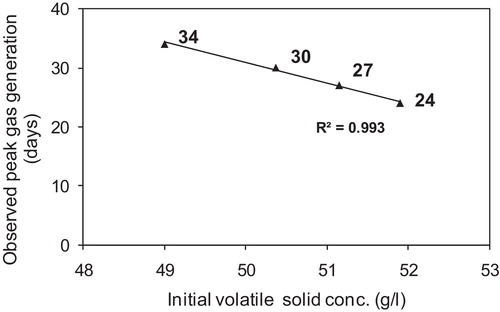
Gas accumulation was observed daily in reactors containing different amounts of poultry litter. The daily gas accumulation in the different reactors was used to determine the peak gas production as related to the initial volatile solid concentration. The relationship between periods of peak gas production and the initial volatile solid concentration in the different reactors is shown in , which shows that peak gas generation occurred earlier when the volatile solids concentration was higher. The lower the initial VS concentration, the more time required for peak gas production in the reactor.
Fig. 3 Observed peak gas generation time with initial volatile solid conc. (g/l).
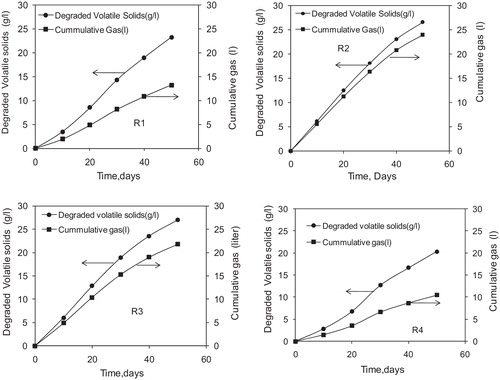
Cumulative degradation of VS and cumulative gas production with time are shown in denoted by (a), (b), (c) and (d) for reactors R1, R2, R3 and R4, respectively. Gas generation from the degradation of the VS was 0.57, 0.902, 0.808 and 0.52 l/g, respectively. The biogas yields were comparable with the trends reported by Thangamani and co-workers [Citation9]. The gas generation from the degraded volatile solids was higher in R2 than in the other three reactors.
Fig. 4 Cumulative destruction of volatile solid (VS) and cumulative gas production with time for reactors R1, R2, R3 and R4.
The relationship between the percent of volatile solids (VS) reduction and the gas yield is shown in . The values for VS destruction indicate that the gas yield in R1 (which contained 100% poultry litter) was lower than R2 and R3 and was higher than R4. Because there was no cow dung in R1 and R4 to stimulate the process with bacteria, poultry litter alone was the major source of biogas in the slurry. Therefore, VS reduction was lower in both reactors. On the other hand, in R2, which contained 25% cow dung and 75% poultry litter, the volatile solids reduction was 51.99%. Although gas production in R3 was lower than in R2, it was comparable, which indicates that VS reduction not only depends on the initial concentration but also on the type of volatile matter in the slurry. The yield of gas generation was higher in R2 than in the other three reactors. These results imply that poultry litter alone is not a suitable option for optimum gas generation.
Table 4 Yield of gas generation with % of VS destruction among four reactors.
3.3 Effect of COD reduction on cumulative gas production
The chemical oxygen demand (COD) of the slurry was considerably reduced by the anaerobic digestion process. The reduction of the COD implies the reduction of the pollutant load from any substrate during the treatment process. The COD reduction and cumulative gas production for R2 is shown in . For reactors R1, R2, R3 and R4, the COD reduction was 46.1, 50.76, 48.23 and 45.12%, respectively. The maximum COD reduction was achieved in the R2 reactor in which the maximum amount of gas was produced. The COD reduction was comparable with the reference value given by Rahman and Muyeed [Citation3].
Fig. 5 COD reduction and cumulative gas production with time in R2 reactor.
3.4 Effect of cow dung
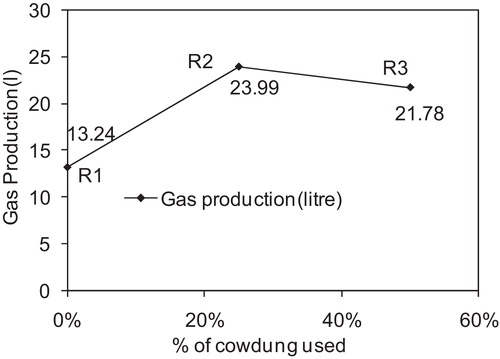
The volume of gas production with different percentages of cow dung in the slurry in different reactors is shown in . Because the initial pH of the poultry litter was high, cow dung also acted as a buffer and a seeding material. No cow dung was present in reactor R1; therefore, the onset of minimum gas generation in this reactor was at 4 days because more time was required to digest the poultry litter in the absence of cow dung. The data from the four reactors implies that optimum gas generation was obtained when 25% of the total solids in the slurry was cow dung. The percentages of C and N were 31.6 and 4.21, respectively. The value of the C/N ratio was 7.5 for broiler poultry litter and 24 for cow dung. Cow dung contains much less nitrogen than poultry litter. Therefore, the C/N ratio increases when poultry litter is mixed with cow dung. The value of C/N ratio should be more than 10 or ammonia toxicity may develop because of the high concentration of N. A C/N near 20 is considered to be optimum [Citation7]. It is assumed that an increase in cow dung increases the C/N ratio and consequently decreases the protein content. Anaerobic digestion might not be favoured under such conditions. For this reason our experiment indicated that 25% cow dung and 75% poultry litter is the optimum composition.
Fig. 6 Effect of cow dung on gas production.
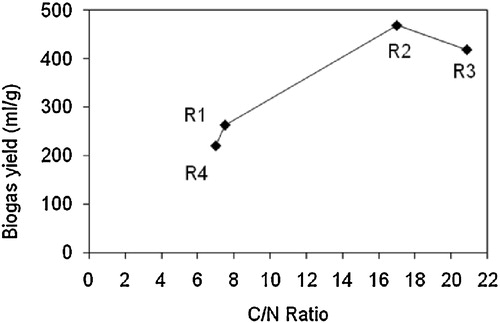
The biogas yield at various C/N ratios in the four reactors is shown in . The C/N ratio of the poultry litter was very low, only 7.5. Generally, a low C/N ratio indicates that a substrate has a high protein content. In an anaerobic process, the excess protein is degraded to NH3, and an elevated concentration of NH3 may be toxic to anaerobic bacteria. For this reason, cow dung was used as a co-substrate to maintain the C/N ratio. The reactors were operated at C/N ratios of 7.5, 17, 20.88 and 6.99, which were slightly lower than the reference value of 20–30 [Citation7]. The highest amount of biogas was obtained at a C/N ratio of 17 in the R2 reactor. The reactors operated without any setback; even at the lowest C/N value in R1, a considerable amount of gas was obtained. This could be because poultry litter is nutrient-rich and contains adequate amounts of carbon, oxygen, hydrogen, nitrogen, phosphorous, potassium, calcium, and magnesium as well as a number of trace elements that are essential for the growth of anaerobic bacteria.
Fig. 7 Effect of C/N ratio against the yield of biogas.
3.5 Monitoring of pH
The pH is another important parameter that must be monitored in an anaerobic digestion process. According to Rahman and Muyeed [Citation3], the desirable pH range for an anaerobic digestion process is 6.5–8.0, and the highest gas yield was observed by the Chengdu Research Institute at a pH of 7.5–8.0. The pH ranges in R1, R2, R3 and R4 were 8.5–7.3, 7.6–7.2, 6.9–7.15 and 8.6–7.8, respectively.
3.6 Biodegradability of the feed mixture
The refractory fraction in the feed mixture is the portion of the initial VS that remains in the digester as the solid retention time (SRT) approaches infinity [Citation8,Citation10] and is an indicator of the extent of the biodegradability of the substrate. It is essential to monitor the biodegradable fraction of volatile solids in the feed to maintain better operational control of the process. The refractory fraction can be determined graphically from the intercept of a plot of (S/S0) and (S0*t)−1 [Citation9], where S = substrate concentration (g/l), S0 = initial VS concentration (g/l) and t = retention time (d). The biodegradability of the feed mixture was determined from the intercept and was in the range of 47–56% of the influent volatile solids concentration shown in . The graphs used to determine the refractory fraction in the reactors are shown in . The biodegradability factor obtained from the graph indicates that the presence of resistant volatile matter is the major portion of volatile solids in the digester. This reasonably conforms to the experimentally determined VS destruction efficiency of 43–52%. The biodegradable fraction of volatile solids obtained from the graphical model and the experimental values are presented in .
Fig. 8 Refractory fraction in four different reactors R1, R2, R3 and R4.
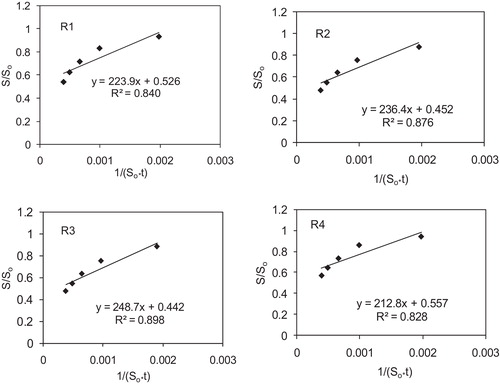
Table 2 Refractory fraction, biodegradable fraction and total VS destruction observed in different reactors.
4 Kinetic analysis
An anaerobic digestion process is generally described by a first order kinetic model, which is based on two factors: the rate of substrate conversion to biogas is directly proportional to the substrate concentration, and the volume of gas generated is proportional to the mass of the substrate degraded [Citation11].
The corresponding kinetic equations are:(1)
(1)
(2)
(2) where S is the final substrate concentration (g/l), S0 is the initial substrate concentration (g/l), k is the rate constant, t is the time (days), G is the cumulative gas production (l), V is the volume of the reactor (l) and C is the yield constant (l/g).
For a batch reactor, the substrate remaining in the digester is given by integrating Eq. Equation(1)(1)
(1) ,
(3)
(3) where t0 is the lag time (d). This model [Citation12,Citation13] describes the behaviour of an average reactor with a longer retention time. From Eqs. Equation(2)
(2)
(2) and Equation(3)
(3)
(3) , the cumulative gas production can be predicted by,
(4)
(4)
Rearranging by taking natural logarithm gives,(5)
(5)
A graphical analysis of the kinetic model for the data from R1, R2, R3 and R4 are shown in in which ln(1 − G/CVS0) versus time has been plotted for the four reactors. The rate constant and lag time were determined by using Eq. Equation(5)(5)
(5) .
Fig. 9 Logarithmic plot of gas production with time for different reactors experimented.
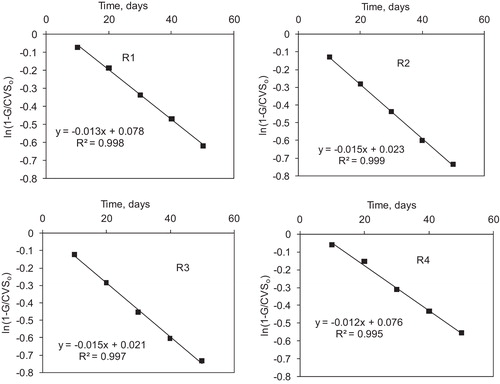
The rate constant and lag time can be calculated from the kinetic analysis for four different reactors from the yield constant (C), the slope of −kt and the intercept of kt0. The yield constant, rate constant and lag time for various initial VS concentrations are shown in , which indicates that the observed lag time is more or less in the same range as predicted by using Eq. Equation(5)(5)
(5) . For all of the reactors, a logarithmic plot of gas production and time was linear with a negative slope. The results fitted a first order kinetic model well. The maximum yield constant was found in reactor R2 in which 75% poultry litter with 25% cow dung was used.
Table 3 Yield constant, rate constant, correlation coefficient, predicted and observed lag time for various reactors.
5 Conclusions
Poultry litter from broilers mixed with an optimum proportion of cow dung was found to be a substrate with a high potential for biogas generation by anaerobic digestion. Batch reactors R1, R2, R3 and R4 were operated with an initial volatile solid concentration of 50.37, 51.15, 51.9 and 47.24 g/l, respectively, and the corresponding specific gas production obtained in terms of the volatile solids feed were 0.263, 0.469, 0.419 and 0.221 l/g, respectively. The VS degradation efficiencies were 46, 51.99, 51.96 and 43%, respectively. The methane content in the biogas generated from different reactors varied from 70 to 72.6%. Kinetic analyses of the data for the reactors indicated that a first order kinetic model was adequate to describe the anaerobic digestion of broiler poultry litter in the presence of co-substrates. Based on the volatile solids degradation efficiencies and specific gas production in terms of the quantity of volatile solid feed, it was confirmed that poultry litter (broiler) is desirable for anaerobic digestion when mixed with a specific proportion of cow dung to obtain a benchmark quantity of biogas (methane). Cow dung at 25% and poultry litter at 75% (in the R2 reactor) was the optimum composition for biogas production.
Acknowledgments
This work was supported by the Ministry of Science and Technology, Bangladesh, under the project “Direct catalytic conversion of biogas to methanol” (No. 39.009.006.01.00.049/2013-2014/EAS-15/292; Date: 06/11/2013). We would like to acknowledge the help from Department of Chemistry, Jagannath University and BCSIR.
Notes
Peer review under responsibility of Taibah University.
Related Research Data
References
- A.N.PulakA.K.M.L.RahmanM.A.RoufM.S.IslamT.RabeyaA.SamadM.A.MamunStudy on bio-methanation using poultry dropping with cowdungJNU JSci.2201319
- I.AngelidakiL.EllegaardB.K.AhringApplications of the Anaerobic Digestion Process2nd ed.2003SpringerBerlin
- M.H.RahmanA.MuyeedSolid and Hazardous Waste Management1st ed.2010ITN-BUETDhaka, Bangladesh
- FAO (Food Agricultural Organization)Production Yearbook of Food and Agricultural Organization, Statistics Seriesvol. 572002
- FFYP, The Fifth Five Year PlanPlanning Commission, Ministry of Planning, Government of the Peoples of Bangladesh2003
- W.VerstraeteF.Morgan SagastumeS.AiyukM.WaweruK.RabaeyG.LissensAnaerobic digestion as a core technology in sustainable management of organic matterWater Sci. Technol.5220055966
- M.A.RoufP.K.BajpaiC.K.JotshiCharacterization of press mud from sugar industry and its potential for biogas generationProc. CHEMCON-99 (Indian Chemical Engineering Congress)Chandigarh, December 20–232009
- R.BorjaC.J.BanksResponse of anaerobic fluidized bed reactor treating ice-cream wastewater to organic, hydraulic, temperature and pH shocksJ. Biotechnol.391995251259
- A.ThangamaniS.RajakumarR.A.RamanujamAnaerobic co-digestion of hazardous tannery solid waste and primary sludge: biodegradation kinetics and metabolite analysisClean Technol. Environ. Policy122010517524
- R.BorjaC.J.BanksComparison of anaerobic filter and an anaerobic fluidized bed reactor treating palm oil mill effluentProcess Biochem.301995511521
- W.J.ParkerApplication of the ADM1 model to advanced anaerobic digestionBioresour. Technol.96200518321842
- D.FulfordRunning a Biogas Programme: A Handbook1988Intermediate Technology PublicationsLondon, UK
- P.L.McCartyF.E.MoseyModeling of Anaerobic Digestion Processes (A Discussion of Concepts)Water Sci. Technol.2419911733