
Abstract
The present study reports the characterization of four degradation products from ezetemibe (EZB) through liquid chromatography–tandem mass spectrometry (LC–MS/MS) and the development of a validated and stability-indicating reversed-phase ultra-performance liquid chromatographic method for the determination of EZB in the presence of its process-related impurities in bulk drugs. The forced decomposition of EZB was carried out and studied under acidic, basic, oxidative, photolytic and thermal conditions. The degradation of EZB was observed under basic and acidic conditions, and four degradation products (DPs) were formed. Successful chromatographic separation of EZB and its degradation products were successfully separated through chromatography with a Waters Acquity HSST3 C18 stationary phase (50 × 2.1 mm, 1.7 μm). The analytes were detected with a PDA detector set at 230 nm. The figures of merit for this method were adequate. The assay remained linear from concentrations of 0.09 μg mL−1 to 600 μg mL−1 for EZB and its four DPs (r2 = 0.99914, 0.99945, 0.99917, 0.99923 and 0.99936 for EZB, Imp-A, Imp-B, Imp-C, and Imp-D, respectively). The method precision, which was expressed as the %RSD, ranged from 0.2 to 1.0 for the four impurities. The DPs from EZB were characterized by LC–MS/MS, and the most likely degradation and fragmentation pathways for EZB and its DPs were proposed.
1 Introduction
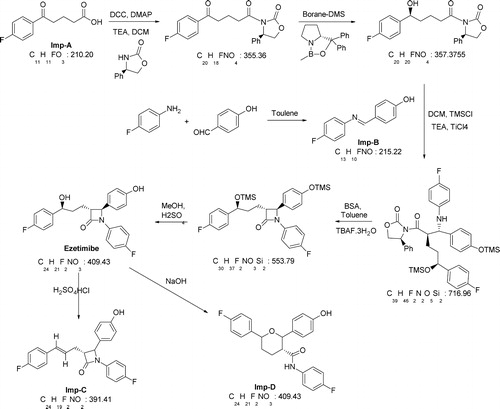
Ezetimibe (1-(4-flurophenyl)-(3R)-[3-(4-fluorophenyl)-(3S)-hydroxypropyl]-4S-(4-ydroxyphenyl)-2-azetidinone) is a known lipid-lowering agent that selectively inhibits the intestinal absorption of cholesterol [Citation1,Citation2]. Previous studies of ezetimibe (EZB) include the RP-HPLC quantitation of EZB in pharmaceutical dosage forms [Citation3,Citation4] and stability-indicating assays utilizing different techniques including the HPLC, HPTLC and micellar electro kinetic chromatography of EZB in single doses or in combination with other drugs applying different techniques [Citation5–Citation10]. These reported stability-indicating assays have major drawbacks, such as long run times (45–60 min) and low selectivity. Therefore, the development of analytical methods that monitor the levels of every possible impurity in EZB formulations and consequently ensure the safety of these formulations has great research potential. These methods should be fast and reliable. We developed a sensitive, robust and fast UPLC method (run times below 5 min). The factors affecting the efficiency of the method were optimized, and the resultant method exhibited high sensitivity and selectivity. However, a literature survey revealed that the structural elucidation of the degradation products (DPs) of EZB has received little attention; a few attempts were made for the major impurities [Citation11,Citation12]. In addition, these papers have not reported the characterization of stress-related DPs while using LC–MS/MS with one exception [Citation13]. During our study, EZB was subjected to stress degradation, producing four stress-induced DPs (referred to as Imp-A, Imp-B, Imp-C and Imp-D). These DPs were studied by LC–MS/MS, and the most probable degradation and fragmentation pathways for EZB and the DPs were proposed. EZB and Imp-D were prepared in our laboratory starting from Imp-A for method validation and characterization. The studied impurities are 4-(4-fluorobenzoyl)butyric acid (Imp-A), 4-[[(4-fluorophenyl) imino]methyl]-phenol (Imp-B), 1-(4-fluoro-phenyl)-3-[3-(4-fluoro-phenyl)-allyl]-4-(4-hydroxy-phenyl)-azetidin-2-one (Imp-C), 6-(4-fluoro-phenyl)-2-(4-hydroxy-phenyl)-tetrahydropyran-3-carboxylic acid (4-fluoro-phenyl)-amide (Imp-D).
2 Materials and methods
2.1 Chemicals and reagents
Analytical-grade reagents were used throughout the method unless stated otherwise. LC-grade acetonitrile and perchloric acid were procured from Merck, Mumbai, India. High purity water was prepared with Milli-Q water purification system, Millipore Pvt. Ltd., Bangalore, India. Analytical-grade HCl and NaOH were purchased from SD Fine Chemicals Pvt. Ltd, Mumbai, India. H2O2 (27% w/w) was purchased from Acros Organics, India. LR grade H2SO4, EtoAc and methanol were procured from RANKEM India Pvt. Limited, Mumbai, India. The EZB standard (potency 99.8%) was donated by Green Evolution Laboratories, Hyderabad, India. The relevant impurities in the EZB were synthesized and characterized in our laboratory (). The 1H NMR (BRUKER AVANCE 400), mass and IR (KBr) spectra of the synthesized Imp-C and Imp-D are given below.
Scheme 1 Synthetic scheme for the degradation products of ezetimibe.
Imp-C: 1H NMR (400 MHz, CDCl3): δ 7.25 (m, 4H), 7.20 (m, 2H), 6.95 (m, 4H), 6.85 (m, 2H), 6.45 (d, 1H), 6.15 (m, 1H), 5.70 (s, 1H), 4.60 (d, 1H), 3.25 (m, 1H), 2.90–2.60 (m, 2H). Mass (m/e): 392.0 (M+1). IR (KBr): υmax 3414.95, 3141.08, 3042.70, 2963.40, 2924.56, 1708.86, 1229.21 cm−1.
Imp-D: 1H NMR (400 MHz, DMSO-d6): δ 9.80 (s, 1H), 9.30 (s, 1H), 7.45 (m, 4H), 7.20 (m, 4H), 7.10 (m, 2H), 6.70 (m, 2H), 4.60 (m, 2H), 2.70 (m, 1H), 2.10 (m, 2H), 2.00 (m, 1H), 1.5 (m, 1H).
Mass (m/e): 410.20 (M+1).
IR (KBr): υmax 3317.65, 3293.84, 3076.17, 3062.31, 2931.50, 2849.18, 1655.07, 1213.07, 1048.40 cm−1.
2.2 Preparation of the standard and sample solutions
The stock solutions of EZB (300-μg mL−1) and all of the impurities (300-μg mL−1) were prepared in methanol. The spiked solutions were prepared by taking 0.03%, 0.10%, 0.15%, 0.20%, 0.25%, and 0.30% relative to the stock concentration of EZB and its impurities in mobile phase for the evaluation of LOD, LOQ and linearity in accordance with ICH guidelines [Citation14].
2.3 Instrumentation
The analyses were performed on a Quattro Premier XE Mass Spectrometer with an ACQUITY UPLC, which was equipped with an auto injector, PDA detector and a binary pump (Waters Corporation, Milford, MA-01757, USA). The analytes were separated on a Waters Acquity HSS T3 1.8 μM stationary phase (50 × 2.1 mm, 1.7 μm). The output signal was monitored and processed using the Empower-2 software (Waters). The acquisition and processing of the mass data were controlled by the mass lynx software. A splitter was placed before the ESI/APCI source to limit the entry of the chromatographic eluent to 40%. The typical operating source conditions for the MS scans in both the positive and negative modes of the ESI/APCI were optimized to the following: the fragment voltage was 30 V; the capillary voltage was 3 kV; the source temperature was 150 °C, the gas flow was 1800 L h−1.
2.4 Degradation studies
Stress degradation studies were performed with EZB to examine the proposed method regarding its specificity and ability to indicate the stability of EZB. The forced degradation process was performed under acidic (1.0 M HCl at 60 °C, 24 h), basic (0.1 M NaOH at 60 °C, 18 h), oxidative (hydrogen peroxide (3%) at room temperature, 4 h), and thermal conditions (dry conditions at 105 °C, 48 h). The light-induced degradation process was performed using UV light (λ = 254 nm, 48 h). The sample solutions prepared under each set of conditions were stirred continuously at 60 °C before being extracted and injected into the UPLC-PDA after dilution. The peak purity was assessed for each degradation solution.
3 Analytical method validation
3.1 Specificity
The specificity of the developed method was established by analysing sample solutions containing mixtures of EZB for both the standard and real solutions. A peak purity test was carried out for EZB and its DPs.
3.2 Precision
The precision of the assay method was evaluated by carrying out six independent assays with mixtures of EZB and its DPs against a mixture of appropriate reference standards. The concentration of the EZB was 0.3 mg mL−1, and this solution was spiked with 0.15% of each DP relative to that concentration. The above tests were carried out over three consecutive days. The precision was evaluated as the intraday and interday %RSD (relative SD).
3.3 Accuracy
The accuracy of the method was evaluated by carrying out recovery studies at three concentrations, which were 80%, 100% and 120% of the target level; the target was the concentration that equals the midpoint of linearity range. The tests were analyzed in triplicate.
3.4 Linearity and range
Linearity of the method was evaluated by constructing calibration curves for EZB and the DPs at eight non-zero concentrations using standard samples ranging from 0.09-μg mL−1 to 600-μg mL−1. The calibration curves were developed by plotting the peak areas versus the concentrations. Curves were fitted using the least square linear regression model.
3.5 Sensitivity
Sensitivity of the method was expressed as the limit of detection (LOD) and the limit of quantification (LOQ). The LOD and LOQ were established as the signal to noise ratio of three and ten times the background noise, respectively. The background noise was determined by scanning blank samples.
3.6 Robustness
The robustness of an analytical procedure is its capacity to remain unaffected by small variations in the analytical parameters. Robustness indicates the reliability of a method during normal usage.
The effects of small variations in the mobile phase composition, column temperature and flow rate were determined using standard solutions.
4 Results and discussion
4.1 Development and optimization of the UPLC method
Various factors affecting method efficiency were optimized to develop a chromatographic method capable of eluting and resolving EZB and its stress DPs. These factors include the mobile phase, the stationary phase, the column temperature and the flow rate, among others. The chromatographic parameters such as the asymmetric factor, the resolution and the column efficiency were also calculated. When separating a mixture of polar and non-polar compounds, such as EZB and its stress DPs, the first column tested should have moderate polarity and compatibility with a 100% aqueous mobile phase. C18 and C8 stationary phases were tested for separating the targeted analytes while using several combinations of the proposed mobile phase with acetonitrile or methanol as a diluent. Good results were achieved with the C18 stationary phase. The optimized mobile phase was composed of a mixture of 0.2% perchloric acid and acetonitrile and was utilized as a gradient. Mobile phase-A was prepared by transferring 2.0 mL of perchloric acid into a 1000 mL flask and diluting with Milli-Q water; the solution was mixed well and degassed using a 0.45 μm filter. Mobile phase-B was prepared by degassing 1000 mL acetonitrile using a 0.45 μm filter.
The DPs formed in our study had different polarities. During isocratic elution, the non-polar DPs eluted after a long delay. A gradient program was utilized to improve the runtime. The optimized gradient elution program was set as follows: time (min)/: B (v/v); 0.01/30, 0.5/30, 4/80, 8/80 9.1/30, 10/30. The PDA detector was set at 230 nm. The injection volume was 0.5 μL and all of the analytes were completely eluted within 5 min. Column oven temperature was maintained at 40 °C.
The resolution between the peaks of Imp-C and EZB was critical; consequently, the method was optimized to reach a resolution factor (Rs) above 2.4. The tailing factor was approximately 1.6.
The method specificity was tested by analysing a mixture of EZB (0.3 mg mL−1) and DPs (0.00045 mg mL−1 each). The results showed no interference between EZB and its DPs, proving that this method is sufficiently specific and that each component could be quantified reliably. A peak purity test was carried out for EZB and its DPs.
The method precision was assessed by analysing samples of EZB (0.3 mg mL−1) spiked with 0.15% of each DP relative to the concentration of EZB. The above tests were carried out over three consecutive days within the same concentration range. The intra-day precision was expressed as the %RSD for the four DPs: Imp-A (0.4), Imp-B (0.5), Imp-C (1.0), and Imp-D (0.4). The inter-day precision was expressed as the %RSD: Imp-A (0.2), Imp-B (0.3), Imp-C (0.7), and Imp-D (0.5).
The accuracy of the developed method was calculated by analysing mixtures of the DPs at three concentration levels, i.e., 80%, 100% and 120% with respect to the target level. The tests were analyzed in triplicate. The method showed high recovery percentages (R%), averaging 98.3–101.6%, .
Table 1 The recoveries and mean RSD% of the analytes.
The linearity of the assay was tested from 0.09-μg mL−1 to 600-μg mL−1 for EZB and its four DPs. The method demonstrated good linearity over the tested range, and the correlation coefficients (r2) were 0.99914, 0.99945, 0.99917, 0.99923 and 0.99936 for EZB, Imp-A, Imp-B, Imp-C, and Imp-D, respectively.
Under the optimized experimental conditions, the LOD of EZB was 0.10 μg mL−1, while the LOQ was 0.30 μg mL−1. For the DPs, the LOD values were 0.12, 0.15, 0.15, and 0.10 μg mL−1, and the LOQ values were 0.36, 0.45, 0.45, and 0.30 μg mL−1 for Imp-A, Imp-B, Imp-C, and Imp-D, respectively.
To assess the robustness of the method, small changes were introduced to the mobile phase composition, column temperature and flow rate. The trials were carried out in triplicate, and the results are listed in and . All of the obtained values for this system remain within the acceptable range.
Table 2 Values of resolution (Rs) factors between Ezetimibe and Imp-C.
Table 3 System suitability, LOD, LOQ, linearity, precision and accuracy data.
4.2 Forced degradation studies
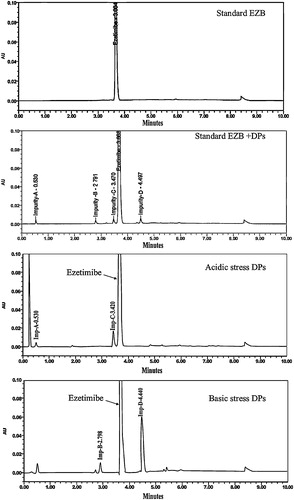
Degradation was not observed in EZB samples subjected to oxidative, photolytic and thermal conditions, indicating that the concentrations of any DPs formed were below the LOD. Therefore, EZB remains quite stable under these conditions. Under basic hydrolysis, however, the EZB degraded, and three DPs, which were designated Imp-A, Imp-B and Imp-D, were formed. Under acidic conditions, two DPs, which were Imp-A and Imp-C, were detected, as shown in . A peak purity test confirmed that the chromatographic peak assigned to EZB was homogenous and pure in all of the analyzed stress samples, remaining unaffected by the presence of DPs. A summary of forced degradation results is shown in .
Table 4 Summary of forced degradation results.
Fig. 1 Chromatograms showing the separation of the different degradation products of ezetimibe in a mixture of the reaction solutions.
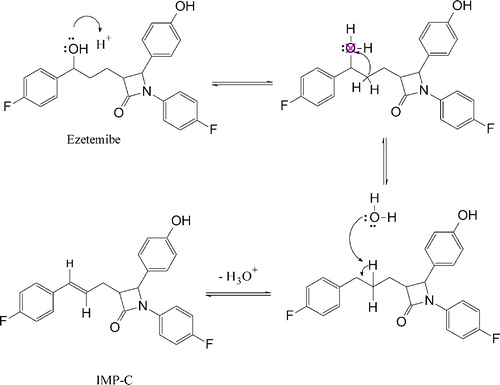
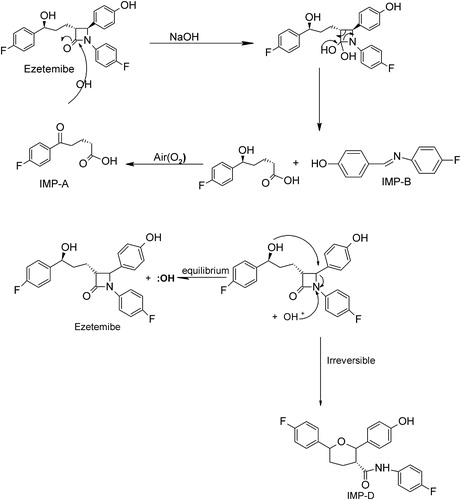
In addition, the mechanisms of formation of the four DPs (Imp-A to Imp-D) under both acidic and basic stress conditions have been proposed to understand how EZB degrades, as shown in Schemes and .
Scheme 2 Mechanism of the degradation of ezetemibe under acidic stress conditions.
Scheme 3 Mechanism of the degradation of ezetemibe under basic stress conditions.
5 Characterization of EZB and its DPs by LC–MS/MS
Using MS detectors to confirm the presence of degradation products is very helpful because of its high sensitivity and selectivity. LC–MS/MS is particularly useful during the analysis of complex mixtures, such as degradation products, because it can separate and identify components with similar structures and close retention times. However, LC methods must be capable of separating the targeted products. During our study, EZB and its four DPs (Imp-A to Imp-D) were well separated by the LC method. The mass spectra showed that EZB, Imp-B, Imp-C and Imp-D produced abundant deprotonated molecular ions ([M−H]−) in negative ionization mode, while Imp-A produced abundant protonated molecular ions in positive ionization mode ([M+H]+). These DPs were characterized using ESI-MS/MS to study their fragmentation patterns. The ESI-MS/MS spectra of EZB and the four Imps are shown in .
Fig. 2 ESI-MS/MS spectra of EZB and four Imps (Imp-A to Imp-D).
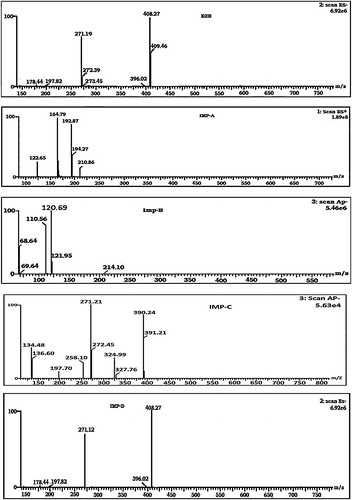
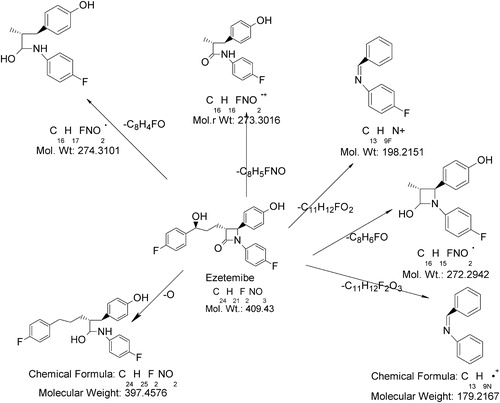
5.1 MS/MS of EZB (m/z 409)
To elucidate the degradation patterns of EZB, an ESI-MS spectrum of its deprotonated molecular ion ([M−H]−) at m/z 408 was examined. The ESI-MS/MS spectrum of this ([M−H]−) ion showed a high-abundance of a product ion at m/z 271; this signal might be attributed to the formation of 1-(4-fluoro-phenyl)-4-(4-hydroxy-phenyl)-3-methyl-azetidin-2-ol (loss of 1-(4-fluoro-phenyl)-propan-1-ol) from EZB, which agrees with the presence of the fluoro-phenyl-propan-1-ol. The spectrum also showed two low-abundance peaks at m/z 396 and m/z 273. The ion at m/z 396 corresponds to the 4-{5-(4-fluoro-phenyl)-2-[(4-fluoro-phenyl amino)-hydroxy-methyl]-pentyl}-phenol formed when the C-N bond in the azetidine ring is cleaved, agreeing with the presence of the azetidine ring in the EZB molecule. The ion at m/z 273 might be due to the formation of a radical cation of 4-[3-(4-fluoro-phenylamino)-3-hydroxy-2-methyl-propyl]-phenol formed through the cleavage of C–N bond followed by the cleavage of the aliphatic ring and the reduction of the keto group in azetedine ring. Additionally, the spectrum showed two low-abundance peaks at m/z 197 and m/z 178. The ion at m/z 197 corresponds to the formation of protonated benzylidene-(4-fluoro-phenyl)-amine groups (loss of 4-fluorobenzoyl butyric acid), which agrees with the presence of 4-fluorobenzoyl butyric acid. The ion at m/z 178 corresponds to the formation of benzylidene-phenyl-amine. shows the proposed fragmentation mechanisms for the ([M−H]−) ion from EZB.
Scheme 4 Proposed fragmentation mechanisms of ([M−H]−) from ezetemibe.
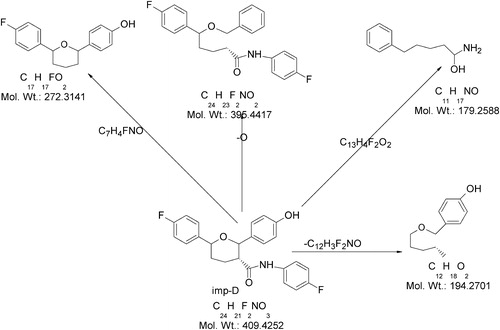
5.2 MS/MS of Imp-D (m/z 409)
The ESI-MS spectrum of its abundant deprotonated molecular ion ([M−H]−) at m/z 408 was examined to elucidate the degradation behavior of Imp-D. The ESI-MS/MS spectrum of ([M−H]−) ion of Imp-D showed an abundant product ion at m/z 271, which might be due to the formation of 4-[6-(4-fluoro-phenyl)-tetrahydro-pyran-2-yl]-phenol (loss of N-(4-fluoro-phenyl)-acetamide) from the molecular ion. In addition, the spectrum showed three low-abundance peaks at m/z 396, m/z 193 and m/z 178. The ion at m/z 396 may be due to the formation of benzyloxy-5-(4-fluoro-phenyl)-pentanoic acid (4-fluoro-phenyl)-amide. The ion at m/z 193 corresponds to a 4-pentyloxymethyl-phenol fragment. The ion at m/z 178 may be attributed to the formation of 1-amino-5-phenyl-pentan-1-ol. shows proposed fragmentation mechanisms for the ([M−H]−) ion from Imp-D.
Scheme 5 Proposed fragmentation mechanisms of ([M−H]−) from Imp-D.
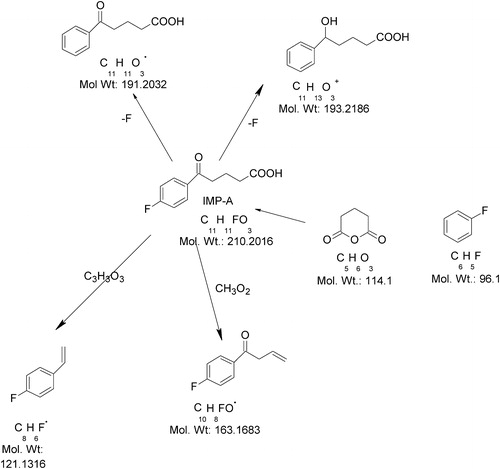
5.3 MS/MS of Imp-A (m/z 210)
The ion of m/z 210 might have formed due to the addition of OH− to EZB under the basic stress conditions. The ESI-MS/MS spectrum of m/z 210 showed abundant product ions at m/z 164 (base peak) and m/z 192. The ion at m/z 164 (M+163) might be due to the formation of 1-(4-fluoro-phenyl)-but-3-en-1-one (decarboxylation followed by the unsaturation of 4-fluoro benzyl butyric acid), which is a reduced fragment of benzyl butyric acid. The ion at 192 (M+191) might be due to the formation of 5-oxo-5-phenyl-pentanoic acid. In addition, the spectrum showed low-abundance peaks at m/z 194 and m/z 122. The ion at m/z 194 might be due to the reduction of keto group present in the 5-oxo-5-phenyl-pentanoic acid (i.e., addition of H2 to the previous M+191 ion). The ion at m/z 122 (M+121) is due to the formation of 1-fluoro-4-vinyl benzene (the stable conjugated unsaturated form of vinyl fluorobenzene). shows the proposed fragmentation mechanisms for the ([M−H]−) ion from Imp-A.
Scheme 6 Proposed fragmentation mechanisms of ([M−H]+) from Imp-A.
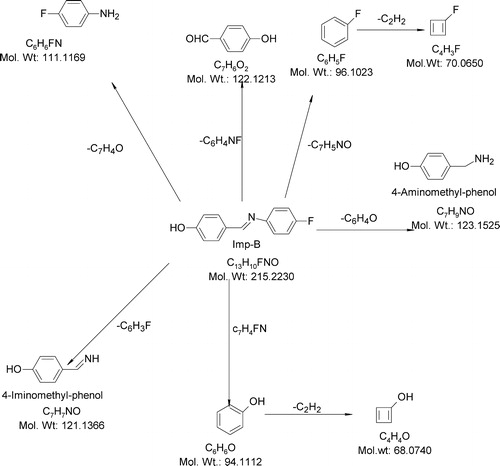
5.4 MS/MS of Imp-B (m/z-215)
The ESI-MS spectrum of Imp-B showed that an abundant molecular ion at m/z 214 ([M−H]−) formed in negative ionization mode. The ESI-MS/MS spectrum of m/z 214 showed an abundant product ion at m/z 120 (base peak), which may be due to the formation of 4-iminomethyl-phenol (the loss of fluorobenzene). The abundant peak at m/z 110 may represent 4-fluoro aniline (the loss of 4-hydroxy benzaldehyde). Also, this spectrum showed low-abundance peaks at m/z 122 (121.95), m/z 69 and m/z 68. The ion at m/z 122 may be due to the formation of 4-amino methyl phenol (the loss of fluorobenzene). The ion at m/z 69 may be due to the loss of an acetylene molecule from fluorobenzene. The ion at m/z 68 may be due to the loss of an acetylene molecule from phenol. shows the proposed fragmentation mechanisms for the ([M−H]−) ion from Imp-B.
Scheme 7 Proposed fragmentation mechanisms of ([M−H]−) from Imp-B.
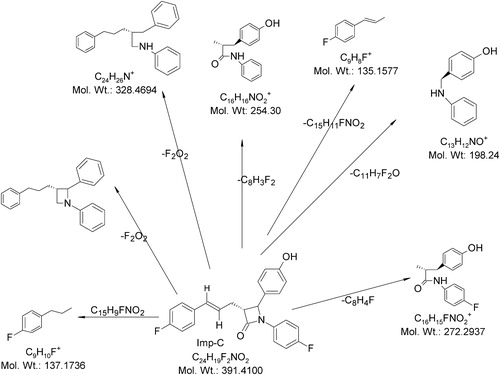
5.5 MS/MS of Imp-C (m/z-391)
The ESI-MS spectrum of the degradation product Imp-D showed an abundant molecular ion at m/z 390 ([M−H]−) under negative ionization mode. The ESI-MS/MS spectrum of m/z 390 showed an abundant product ion at m/z 271 (base peak) which may be due to the formation of N-(4-fluoro-phenyl)-3-(4-hydroxy-phenyl)-2-methyl-propionamide (due to the loss of 1-fluoro-4-propenyl-benzene followed by C–N bond cleavage in the azetedine ring from m/z 390). The spectrum also showed abundant peaks at m/z 325 (324.99), m/z 272, m/z 253, m/z 186 and m/z 134. The ion at m/z 325 may represent the protonated form of 1,2-diphenyl-3-(3-phenyl-propyl)-azetidine due to the loss of F2O2 from m/z 390). The ion at m/z 253 may be due to the formation of protonated 4-(4-hydroxy-phenyl)-3-methyl-1-phenyl-azetidin-2-one after the loss of 1-fluoro-4-propenyl benzene and subsequent C–N bond cleavage in the azetedine ring. The ion at m/z 136 indicates the formation of protonated 1-fluoro-4-propyl-benzene. The ion at m/z 134 represents the protonated form of 1-fluoro-4-propenyl benzene. In addition, the spectrum showed low-abundance peaks at m/z 327 and m/z 197. The ion at m/z 327 may be the protonated (2-benzyl-5-phenyl-pentyl)-phenyl-amine. The ion at m/z 197 may be due to the formation of protonated benzylidene-(4-fluoro-phenyl)-amine (the loss of 4-fluorobenzoylbutyric acid). shows the proposed fragmentation mechanisms for the ([M−H]−) ion from Imp-C.
Scheme 8 Proposed fragmentation mechanisms of ([M−H]−) from Imp-C.
6 Conclusions
The degradation behavior of EZB was studied under various stress conditions. Four degradation products (DPs) were formed. The formed DPs were characterized using LC–MS/MS. In addition, a selective, precise and sensitive stability-indicating RP-UPLC method was developed to identify the process-related impurities from EZB, and this method was validated based on the ICH guidelines. The developed method could be used to construct a profile for EZB.
Supplementary data
Download MS Word (16.4 KB)Notes
Peer review under responsibility of Taibah University.
References
- B.LíviaC.P.BarbosaM.A.SilvanaK.RobertoL.EmyB.AdelarA.CiomarEffects of simvastatin, atorvastatin, ezetimibe, and ezetimibe + simvastatin combination on the inflammatory process and on the liver metabolic changes of arthritic ratsFundam. Clin. Pharmacol.262012722734
- F.EzzetG.KrishnaD.B.WexlerP.StatkevichT.KosoglouV.K.BatraA population pharmacokinetic model that describes multiple peaks due to enterohepatic recirculation of ezetimibeClin. Ther.232001871885
- R.SistlaV.S.TataY.V.KashyapD.ChandrasekarP.V.DiwanDevelopment and validation of a reversed-phase HPLC method for the determination of ezetimibe in pharmaceutical dosage formsJ. Pharm. Biomed. Anal.392005517522
- H.MohamedA.MohammedJ.SaeedRapid and sensitive simultaneous determination of ezetimibe and simvastatin from their combination drug products by monolithic silica high-performance liquid chromatographic columnJ. Pharm. Biomed. Anal.502009527534
- S.SaranjitS.BaljinderB.RakeshW.LalitS.RahulStress degradation studies on ezetimibe and development of a validated stability-indicating HPLC assayJ. Pharm. Biomed. Anal.41200510371040
- S.D.AshishK.K.PankajS.J.HemendraValidation of a stability-indicating LC method for assay of ezetimibe in tablets and for determination of content uniformityChromatographia672008137142
- B.G.ChaudhariN.M.PatelP.B.ShahL.J.PatelV.P.PatelStability-indicating reversed-phase liquid chromatographic method for simultaneous determination of atorvastatin and ezetimibe from their combination drug productsJ. AOAC Int.90200715391546
- B.G.ChaudhariN.M.PatelP.B.ShahStability-indicating reversed-phase liquid chromatographic method for simultaneous determination of simvastatin and ezetimibe from their combination drug productsJ. AOAC Int.90200712421249
- M.V.MahadikS.R.DhaneshwarApplication of a stability-indicating HPTLC method for the quantitative determination of ezetimibe in pharmaceutical dosage formsAsian J. Pharm. Sci.22007182190
- L.D.SérgioR.O.PauloB.ThiagoT.VítorDevelopment and validation of a stability-indicating micellar electrokinetic chromatography method for the determination of ezetimibe in pharmaceutical formulationsAnal. Sci.242008499503
- S.ZsuzsannaK.JanosS.KatalinV.KrisztinaS.CsabaJr.Structure of the major degradant of ezetimibeJ. Pharm. Biomed. Anal.582012125129
- G.SrikanthK.UttamN.MuraliP.BadrinadhJ.VundavilliD.SatheeshI.AminulIdentification, isolation and characterization of process related impurities in ezetimibeJ. Pharm. Biomed. Anal.252014385390
- R.BhanuA.S.BrajeshB.RahulD.G.PradeepK.AshokStructural elucidation of a process-related impurity in ezetimibe by LC/MS/MS and NMRJ. Pharm. Biomed. Anal.5220107378
- International Conferences on Harmonization Q2 (R1). Validation of analytical procedures: text and methodology, 2005.
Appendix A
Supplementary data
Supplementary material related to this article can be found, in the online version, at doi:10.1016/j.jtusci.2015.08.001.