
 ?Mathematical formulae have been encoded as MathML and are displayed in this HTML version using MathJax in order to improve their display. Uncheck the box to turn MathJax off. This feature requires Javascript. Click on a formula to zoom.
Abstract
In this work, the magnesium content was determined by the solution scanometric method using titan yellow (TY) as a complexing agent in alkaline media. This method is based on scanning a solution containing the pink-coloured product of the combination of TY and the magnesium hydroxide complex. Hydroxylamine hydrochloride (HA) and starch were utilised as colour stabilizers and protective colloids, respectively. After the cells containing the sample solution were scanned, the colour of each cell was analysed with software written in Visual Basic (VB 6) in terms of the red, green and blue values. The parameters used for optimisation include the reaction time and the concentration of TY, sodium hydroxide, starch and HA. The system had a wide linear range between 0.070 and 30.000 μg mL−1 concentrations of magnesium, with a detection limit of 0.058 μg mL−1 and a relative standard deviation of 1.90% for the G colour value. In addition, the effects of some foreign species were investigated. The method was successfully applied for the determination of magnesium in almond gum and three water samples.
1 Introduction
Magnesium is the eighth most abundant element in the crust of the Earth. The determination of alkaline earth metals, particularly magnesium, is of importance for environmental, biological and industrial applications [Citation1]. Magnesium, an abundant mineral in the body, is naturally present in numerous foods, added to other food products, available as a dietary supplement, and present in some medicines (such as antiacids and laxatives). It is also a cofactor in more than 300 enzyme systems that regulate diverse biochemical reactions in the body [Citation2–Citation4].
Several reagents for the determination of magnesium have been described in the literature, such as eriochrome black T [Citation5], titan yellow (TY) [Citation6,Citation7], ammonium phosphate method [Citation8], EDTA [Citation9], paratolyl-2-thenohydroxamic acid and quinalizarin [Citation10], 4 methyl-3-((1-H-Indol-3-iyl) (phenyl) methyl)-1-H-Indol (MPBIM) [Citation11] and trizma-chloranilate [Citation12].
TY, also known as thiazole yellow, titangelb, clayton yellow and direct yellow 9, is a triazene dye that is used in display devices [Citation13], optical sensors [Citation14], lithographic processes [Citation15], inks [Citation16], paints [Citation17], and incandescent electric lamps [Citation18] as well as an albumin detector [Citation19], fluorescent indicator in microscopy, and acid–base indicator [Citation20]. It is also used as an important reagent for the detection of magnesium [Citation7,Citation21].
With the large contribution of Kolthoff [Citation21] in 1926, TY was introduced in 1926 as an outstanding reagent for the determination of Mg2+ ions, after which the detection method was further developed through the co-operation of Lehr and Wesemeale (1950) [Citation7]. Among all of the techniques for this determination, the procedure of Neil [Citation6] in 1965 was of great importance and was preferred to other methods because it provides a higher ratio of colour intensity/blank.
The solution scanometric technique was introduced recently by Abbaspour et al. [Citation22]. They used commercially available flatbed-scanners to obtain images of coloured solutions. The obtained images were transferred to a computer for an analysis and measurement of the intensity of the solution colour. The method is based on the reaction in solution phase in Plexiglas® cells. The solution was scanned, and the red, green and blue (RGB) colour model was used to analyse the solution color [Citation23–Citation25]. Afterwards, this method was coupled with cloud point extraction as a detection system in our group [Citation26].
Scanometry has several advantages, such as simplicity (handheld scanner and PC), high scanning speed, inexpensive, portability, easy immobilisation of reactants, lack of a requirement of identifying λmax, large archive of experiences, short response time, limited interference, ability to run various tests simultaneously and ability to investigate non-transparent samples by analysing the reflective properties of the surface.
In the present work, solution scanometry, as a simple, fast, and costs effective method, was developed to determine the Mg2+ ion content based on the formation of a pink coloured complex between Mg2+ ions and TY in sodium hydroxide medium and in the presence of starch as a colloidal protector and in the presence of HA as a colour stabilizer.
2 Experimental
2.1 Apparatus
The cells (with 1000 μL volume each) were built by using a sheet of Plexiglas® [Citation22]. A Canoscan LiDE 200 flatbed scanner was used to scan the Plexiglas® sheet. The horizontal and vertical resolution of the scanner was set to 300 dpi. Furthermore, the colour of each cell was analysed with respect to the red, green and blue values using software written in Visual Basic 6 (VB 6) for [Citation27,Citation28]. Three Biohit proline pipettors with different volumes between 0.5 and 1000 μL were used for injecting samples into the cells.
2.2 Chemicals and reagents
All of the chemicals used in this work were of analytical grade. In addition, double distilled water was used throughout. TY was purchased from Merck (E. Merck, Darmstadt, Germany). A laboratory stock solution (0.02%, w/v) was prepared by dissolving crystalline TY in double distilled water. The analytical-grade magnesium nitrate, sodium hydroxide, starch and hydroxylamine hydrochloride used in this study were obtained from Merck.
2.3 Principles of the red, green and blue (RGB) colour systems
The RGB colour system works on the basic principle that any colour is composed of red, green and blue. Colours are created by adding more light to a starting colour of black, and for this reason, it is also known as the additive colour system. Every colour in the RGB spectrum is made up of a different value for each of its red, green and blue components. Hence, it is used by systems that have the ability to add light, such as LCD, CRT and RGB projectors. RGB colours vary between 0 and 255, a range that a single 8-bit byte can offer by encoding 256 distinct values. In the RGB system, any colour is represented in the form of (R, G, B), in which the (0, 0, 0) and (255, 255, 255) refer to black and white, respectively. Therefore, by increasing the intensity of colours, the colour values are decreased. In this system 16,777,216 colours can be made. Any colour can be described by the following formula:where R, G and B are red, green and blue values of the main colour, respectively. For black and white, V is equal to 0 and 16,777,216, respectively. By using the following flowchart, R, G and B values of V for any colour can be extracted:
“Mod” is a numeric function which returns the remainder when dividing two numbers.
It should be mentioned that having only one of the R, G and B colour values that have the same colour as the solution is usually useless because this value is often greater than 200 and does not significantly change during the experiment. In this experiment, the effective intensity of all three parameters of the RGB changed; therefore, the one with the largest change, i.e., the “G” parameter, was chosen.
2.4 Procedure
Forty-five microlitres of 5% (w/v) HA, 25 μL of a 1% (w/v) of starch stock solution, 175 μL of a 0.02% (w/v) TY solution, 50 μL of 100 μg mL−1 magnesium nitrate and 55 μL of a 6 mol L−1 sodium hydroxide solution were transferred into each cell and an appropriate volume of deionised water added to bring the total volume in each cell to 500 μL. The cells were shaken to obtain a homogenous colour; after 5 min, the Plexiglas® sheet was scanned with the scanner, the image was transferred into the computer, and any colour changes in the cell related to the blank (a sample solution without Mg2+ ions) were analysed using a program written in VB 6. In this program, the colour of each cell is analysed based on the RGB system in terms of the R, G and B values. It should be noted that in the colour analysis programs, a specific area of approximately 10,000–300,000 was selected for analysis and the R, B and B values were averaged over pixels in this area. In this way the noise can be dramatically reduced. The effective intensity of colour values was calculated as follows:where Ar, Ag and Ab are the effective intensity for red, green and blue, respectively. Rs, Gs, Bs and Rb, Gb and Bb are the red, green and blue colour values of a sample and a blank, respectively.
2.5 Preparation of real samples
2.5.1 Water samples
The Mg2+ ion was determined using the solution scanometric method in three water samples, including tap, stream (Yasouj City) and mineral (Sepidan company) water. Forty-five microlitres of each water sample was poured into 50-mL volume flasks and then placed in a water bath at 70 °C for 20 min. Then, the solution became acidic, and sodium tungstate was added to precipitate cations that interfered with Mg2+ ion determination. The sample solution was filtered through paper filter. The volume of solution passed reached 50 mL with double distilled water, and 200 μL of the cited solution was used for determination of magnesium by the solution scanometric method.
Additionally, the Mg2+ ion content was determined in these samples by the atomic absorption spectroscopy (AAS) method. The conditions for the determination of the Mg2+ content by AAS are: wavelength; 285.2 nm, slit; 0.7 nm, flame; and C2H2–air; also a magnesium hallow cathode lamp was used.
2.5.2 Almond gum sample
For the determination of the Mg2+ ion content according to Section 2.4 by the standard addition method, 0.5 g of almond gum samples were washed with distilled water to remove dirt and impurities and dried at 120 °C for 30 min. For acid treatment, the sample was mixed with concentrated hydrochloric acid (37%) at room temperature for 24 h. The sample was filtered through filter paper and washed several times with double distilled water, after which the obtained product was transferred to a 50-mL volume flask, diluted to the mark with double distilled water, and stored in a closed container for further tests.
3 Results and discussion
This method is based on the combination of TY and magnesium hydroxide to produce a pink-coloured complex that is then scanned. Starch as a colloidal protector and HA as colour stabilizer, respectively, were added to increase the stability of the solution.
3.1 Optimisation the parameters of the system
To optimise this system, the effect of time and the concentration of chemical reagents were investigated.
3.1.1 Effect of time
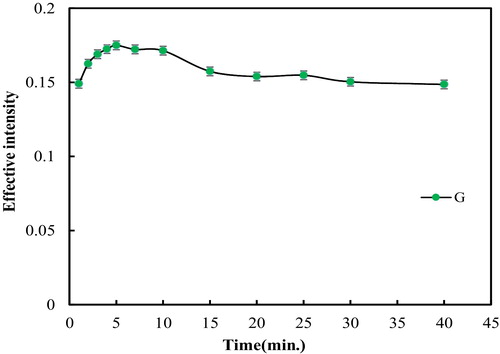
For the acquisition of the maximum signal, it was required that the interaction between reagents be complete. Reaction times in the range of 1–40 min were studied. For this purpose, the cell containing the 500 μL solution of 0.45% HA, 0.05% starch, 0.007% TY, 10 μg mL−1 magnesium and 0.66 mol L−1 sodium hydroxide was scanned at 1 or 5 min increments at room temperature, and the image of the cell was analysed using the software. The results are shown in . The best signal was obtained at 5 min. At shorter times, the reaction was not complete, and at longer times, the colour was not stable; therefore, the signal decreased.
Fig. 1 The effect of time on the effective intensity (conditions: 500 μL of a solution containing 10 μg mL−1 Mg2+ ion, 0.45% (w/v) HA, 0.05% (w/v) starch, 0.007% (w/v) of TY and 0.66 mol L−1 sodium hydroxide).
3.1.2 Effect of TY, sodium hydroxide, HA and starch concentrations
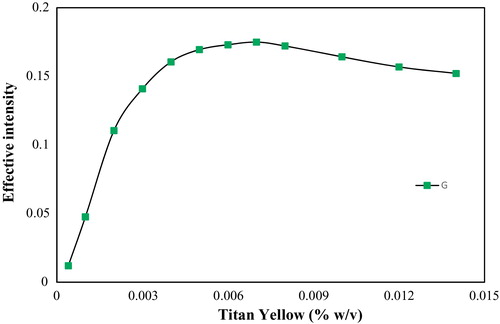
According to the procedure above, the effect of TY, HA, sodium hydroxide and starch on the effective intensity was investigated. As shows, the maximum colour intensity was observed at 0.007% (w/v) TY, the concentration at which the interaction between TY and magnesium hydroxide was completed. It is obvious that the formation of the magnesium hydroxide–TY complex is not complete at a low concentration of TY.
Fig. 2 The effect of the titan yellow concentration on the effective intensity (conditions: 500 μL of a solution containing 10 μg mL−1 Mg2+ ion, 0.45% (w/v) HA, 0.05% (w/v) starch, 0.66 mol L−1 sodium hydroxide and different amounts of TY and a reaction time of 5 min).
illustrates the effect of the sodium hydroxide, HA and starch concentrations. It is observed that the effective intensity G increased with the addition of sodium hydroxide. The highest signal was obtained at 0.66 mol L−1 of sodium hydroxide. At this concentration, the formation of magnesium hydroxide and following magnesium hydroxide–TY was completed. Thus, as it provided sufficient hydroxide, 0.66 mol L−1 was the optimum concentration.
Fig. 3 The effect of the sodium hydroxide, HA and starch concentrations on the effective intensity (conditions: 500 μL of a solution containing 10 μg mL−1 Mg2+ ion, 0.45% (w/v) HA, 0.05% (w/v) starch, 0.007% (w/v) of TY and 0.66 mol L−1 sodium hydroxide and a reaction time of 5 min). For two other parameters, the investigated parameter was changed and the others were fixed similarly.
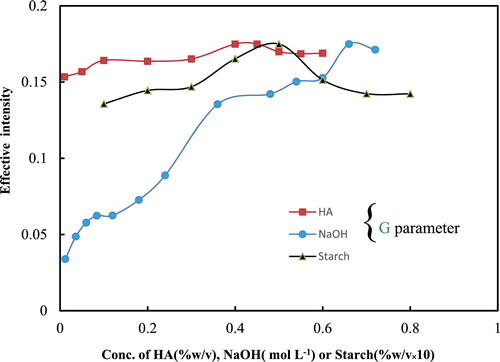
The optimisation of the concentration of starch as a colloidal protector reagent is one of the key optimisation steps. At low starch concentrations (less than 0.01%), the solution sedimented, and at high concentrations, the solution was relatively turbid; therefore, the signal decreased. As shown in , 0.045% (w/v) was the optimum concentration.
Of the mentioned interactions, HA is often added to avoid colour fading of a solution [Citation7]. In this way, this stabilizer also prevents oxidation [Citation29]; eliminates the interference from species, such as manganese and iron [Citation30]; and improves the standard curves [Citation31]. also illustrates the effect of the HA concentration on the effective intensity of G. As observed, the colour intensity increased with the increasing HA concentration, but decreased after 0.45%. Thus 0.45% was the optimum concentration. It was found that the colour faded rapidly if no stabilizer was added.
3.2 Analytical performance
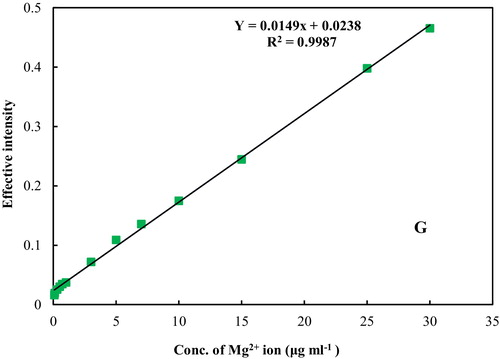
The calibration curve was plotted under optimum conditions (). A good linear relationship between the effective intensity of the product and the concentration of magnesium was obtained in the range of 0.07–30.00 μg mL−1. The equation for the regression line was Y = 0.0149 C + 0.0238 (for G), where C is the concentration of Mg2+ ions in μg mL−1. The detection limit for the G factor, based on three times the standard deviation of the blank (3Sb), was found to be 0.05 μg mL− (n = 5). To ensure the repeatability of the method, 6 sample solutions of 10 μg mL−1 Mg2+ ions were analysed and the Relative Standard Deviation % (RSD) for the G colour values, 1.9%, was obtained. Therefore, the proposed analytical method has good precision, sensitivity and a low detection limit and is suitable for the determination of Mg2+ ions in different samples.
Fig. 4 Calibration curve for the determination of the concentration of Mg2+ ions at optimum conditions.
3.3 Interference study
The influences of diverse cations and anions on the determination of magnesium were studied. Various amounts of other species were added to a 10 μg mL−1 solution of magnesium, and the recommended procedure under optimum conditions was applied. An error of less than or equal to ±5.0% in the signal reading was considered to be a tolerable value. The results are shown in . Interfering elements can be separated by precipitation with sodium tungstate.
Table 1 Effect of interfering species on the determination of 10 μg mL−1 Mg2+ ion at the optimum conditions by solution scanometric method.
3.4 Application
Magnesium, as a physiologically essential element, plays a significant role in the quality of drinking water [Citation32]. The applicability of the proposed method for determining the concentration of Mg2+ ions under optimum conditions was examined with almond gum and three different water samples, including tap, stream (Yasouj City) and mineral (Sepidan company) water. The almond gum sample was prepared according to the procedure described in the experimental section. The results are presented in . The obtained results by the proposed method were found to be in excellent agreement with those obtained by AAS.
Table 2 Determination of Mg2+ ions in water and almond gum samples by the solution scanometric method.
4 Conclusion
Trace amounts of Mg2+ ions were determined by solution scanometry as a new, simple, fast, sensitive and inexpensive detection method. In , a comparison of the characteristics of the proposed method with some of the other previously reported methods for the determination of the concentration of Mg2+ ions is presented. As shows, the proposed method not only has a wider linear range but also has a reasonable limit of detection and RSD%. In addition, it is an inexpensive, simple and rapid method for determining the concentration of Mg2+ ions. This method is applicable for the determination of the concentration of Mg2+ ions in environmental and food samples.
Table 3 A comparison between the results of solution scanometry and other methods for the determination of the concentration of Mg2+ ions by the solution scanometric method.
Acknowledgements
We gratefully acknowledge the support of Yasouj University Research for this study.
Notes
Peer review under responsibility of Taibah University.
References
- N.N.GreenwoodA.EarnshawChemistry of the Elements1984Pergamon PressNew York
- Institute of Medicine (US) Standing Committee on the Scientific Evaluation of Dietary Reference IntakesDietary Reference Intakes for Calcium, Phosphorus, Magnesium, Vitamin D, and Fluoride1997National Academies PressWashington, DC
- R.K.RudeMagnesiumP.M.CoatesJ.M.BetzM.R.BlackmanG.M.CraggM.LevineJ.MossJ.D.WhiteEncyclopedia of Dietary Supplements2nd ed.2010Informa HealthcareNew York, NY527537
- R.K.RudeMagnesiumA.C.RossB.CaballeroR.J.CousinsK.L.TuckerT.R.ZieglerModern Nutrition in Health and Disease11th ed.2012Lippincott Williams & WilkinsBaltimore, MA159175
- A.E.HarveyJr.J.M.KomarmyG.M.WyattColorimetric determination of magnesium with eriochrome black TAnal. Chem.251953498500
- D.W.NeillR.A.NeelyThe estimation of magnesium in serum using titan yellowJ. Clin. Pathol.91956162163
- J.C.van WesemaelThe determination of magnesium with titan yellowAnal. Chim. Acta251961238247
- F.W.HeatonDetermination of magnesium by the titan yellow and ammonium phosphate methodsJ. Clin. Pathol.131960358360
- L.L.LewisL.M.MelnickDetermination of calcium and magnesium with (ethylenedinitrilo) tetraacetic acid. Studies in accuracyAnal. Chem.3219603842
- N.DallaliY.K.AgrawalSolvent extraction and spectrophotometric determination of magnesium by paratolyl-2-thenohydroxamic acid and quinalizarinIran. J. Chem. Chem. Eng.2320046572
- A.ShokrollahiH.TavallaliZ.MontaseriK.NiknamUsing an indol derivative as complexing agent for cloud point preconcentration and determination of magnesium and silver ions in various samples by FAASJ. Chil. Chem. Soc.57201211341139
- D.L.GiokasE.K.PaleologosP.G.VeltsistasM.I.KarayannisMicelle mediated extraction of magnesium from water samples with trizma-chloranilate and determination by flame atomic absorption spectrometryTalanta562002415424
- T.LiuIon color controlling electrophoresis display deviceChem. Abstr.1422005363891
- A.SafaviH.AbdollahiOptical sensor for high pH valuesAnal. Chim. Acta3671998167173
- L.E.LowsonkP.J.SmithLithographic processChem. Abstr.81197497801
- S.J.CoughlinI.F.FraserT.HealyC.NivenPigment composition their production and their use in inks and coatings with improved rheologyChem. Abstr.1392003382824
- M.LmanoT.OchiaiH.MurakamiPigment compositions for nonpolluting traffics paintsChem. Abstr.1281998245242
- S.MyamotoT.ItoPale-yellow incandescent electric lamps and their manufactureChem. Abstr.1992199662
- S.K.SharmaM.BalaN.B.TulsaniN.SehgalA.KumarAlbumin test strip for quick detection of albuniuria in humanIndian J. Chem. Technol.9200296498
- E.B.OttoC.E.OttoTitan yellow qualitative test for magnesiumInd. Eng. Chem. Anal. Ed.19416566
- I.M.KolthofA new specific reaction of magnesium and a simple colorimetric method for the determination of traces of this elementBiochem. Z.1851927344348
- A.AbbaspourA.KhajehzadehA.GhaffarinejadA simple and cost-effective method, as an appropriate alternative for visible spectrophotometry: development of a dopamine biosensorAnalyst134200916921698
- A.AbbaspourA.KhajehzadehA.GhaffarinejadDevelopment of a new method based on scanner electrochemistry: applied for the speciation of iron (II) and iron (III)Anal. Methods3201122682272
- A.AbbaspourE.Talebanpour BayatE.MirahmadiA reliable and budget-friendly, solution-based analysis of multiple analytes of boiler water based on reflection scanometryAnal. Methods4201219681975
- A.AbbaspourH.ValizadehA.KhajehzadehA simple, fast and cost effective method for detection and determination of dopamine in bovine serumAnal. Methods3201114051409
- A.ShokrollahiT.RoozestanCPE-scanometry as a new technique for the determination of dyes: application for the determination of fast green FCF dye and comparison with spectrophotometric resultsAnal. Methods5201348244831
- A.AbbaspourM.A.MehrgardiA.NooriM.A.KamyabiA.Khalafi-NezhadM.N.Soltani RadSpeciation of iron (II), iron (III) and full-range pH monitoring using paptode: a simple colorimetric method as an appropriate alternative for optodesSens. Actuators B1132006857865
- A.ShokrollahiN.ShokrollahiDetermination of Mn2+ ion by solution scanometry as a new, simple and inexpensive methodQuim. Nova37201415891593
- D.S.MikkelsenS.J.TothThiazol yellow for determining the magnesium content of soil extractsAgron. J.391947165166
- M.PeechL.EnglishRapid microchemical soil testsSoil Sci.571944167196
- H.O.KunkelP.B.PersonB.S.SchweigertThe photoelectric determination of magnesium in body fluidsJ. Lab. Clin. Med.32194710271033
- P.G.WelshJ.LiptonG.A.ChapmanT.L.PodrabskyRelative importance of calcium and magnesium in hardness-based modification of copper toxicityEnviron. Toxicol. Chem.19200016241631
- M.BenamorN.AguerssifSimultaneous determination of calcium and magnesium by derivative spectrophotometry in pharmaceutical productsSpectrochim. Acta A692008676681
- Z.O.TesfaldetJ.F.Van StadenR.I.StefanSpectrophotometric determination of magnesium in pharmaceutical preparations by cost-effective sequential injection analysisTalanta642004981988
- C.E.AchikanuP.E.Eze-StevenC.M.UdeO.C.UgwuokolieDetermination of the vitamin and mineral composition of common leafy vegetables in south eastern NigeriaInt. J. Curr. Microbiol. Appl. Sci.22013347353