
 ?Mathematical formulae have been encoded as MathML and are displayed in this HTML version using MathJax in order to improve their display. Uncheck the box to turn MathJax off. This feature requires Javascript. Click on a formula to zoom.
Abstract
A series of 34 substituted purine analogues derivatives were subjected to quantitative structure-activity relationship analyses as inhibitors of c-Src tyrosine kinase. Partial least squares regression was applied to derive QSAR models, which were further validated for statistical significance by internal and external validation. The best QSAR model developed had a good predictive correlation coefficient (r2) of 0.8319, a significant cross-validated correlation coefficient (q2) of 0.7550, and an r2 for the external test set (pred_r2) of 0.7983. It was developed from the PLS method with descriptors including the SsCH3E-index, H-Donor Count, T_2_Cl_3, and negative correlation with SsOHcount. The current study provides better insight into the future design of more potent c-Src tyrosine kinase inhibitors prior to synthesis.
1 Introduction
Protein tyrosine kinases are enzymes that catalyze the transfer of the terminal ATP phosphate to specific tyrosine residues present on a target substrate [Citation1]. Protein tyrosine kinases regulate signalling pathways for a broad spectrum of cellular processes, including responses to growth factors, neurotransmitters and hormones; activation of the immune response; and the regulation of cell-cell and cell-extracellular matrix interactions, as well as development, oncogenesis, and angiogenesis [Citation2,Citation3]. The protein c-Src kinase is a nonreceptor tyrosine kinase that acts as a signal transduction inhibitor and is a critical component of multiple signalling pathways controlling cell growth, proliferation, invasion, and apoptosis. While c-Src kinase is highly regulated and active only at low levels in most normal cells, studies have shown its upregulation in many human tumour types [Citation4,Citation5]. Protein tyrosine kinases (PTKs) are enzymes responsible for the phosphorylation of other proteins and can catalyze the transfer of the γ-phosphate group of ATP to protein phenolic groups (on Tyr). PTKs play a central role in signal transduction pathways and are involved in the immune, endocrine, and nervous system physiology and pathology [Citation6]. The enzyme c-Src tyrosine kinase plays versatile roles in cell responses induced by platelet-derived growth factor (PDGF), including cell growth, cell cycle progression, cell survival, cell migration, actin cytoskeleton rearrangement, DNA synthesis and receptor endocytosis [Citation7,Citation2]. Src kinases play crucial roles in signal transduction pathways and in regulating various cellular functions such as cell proliferation and cell differentiation [Citation8]. The activity and structural conformation of the Src-family protein kinases are mainly regulated by phosphorylation events [Citation9]. Src kinase is a protooncogenic tyrosine kinase [Citation10] and has been implicated in the genesis and progression of multiple types of human cancer, including colon, breast, lung, and other cancers [Citation11]. Quantitative structure–activity relationships (QSARs) are an attempt to correlate the structural or property descriptors of compounds quantitatively with biological activities. The traditional 2D-QSAR model is only a rough approximation of the real relationships, as it mainly uses molecular descriptors. QSAR models, mathematical equations relating chemical structure to biological activity, provide useful information for drug design and medicinal chemistry [Citation12]. Quantitative structure–activity relationships (QSARs) help to predict the biological activity of new structures and may reveal useful information on structural modification at several substitutional positions of c-Src-binding molecules [Citation13–Citation16]. This work was undertaken to find a correlation between physicochemical parameters and the biological activity of a series of novel purine derivatives as c-Src tyrosine kinase analogues. This paper is an attempt at a predictive technique based on partial least squares regression, which identifies key structural features responsible for governing c-Src tyrosine kinase.
2 Materials and method
2.1 Computational method
Computational studies were performed on an HP with Windows 7 Home Basic running on an Intel® core processor. The molecular structures of the compounds in the data set were sketched using the V-life MDS (Molecular Design Suite)™ 3.5 software supplied by V-life Sciences Technologies [Citation17]. Analogues of purine derivatives reported to have potent and selective inhibitory activity against c-Src tyrosine kinase were taken from the literature [Citation18]. The biological assay used to test the activity of all of the molecules was the same, and hence, the inhibition values indicated by IC50 are comparable. The biological activities represented by IC50 were converted into the corresponding pIC50 values (−log IC50), which were used as dependent variables in the QSAR analysis. For this study, a total of 34 purine derivatives were divided into training and test sets consisting of twenty-six and eight compounds (), respectively.
Table 1 Structure, and biological activity of purine derivatives as c-Src tyrosine kinase.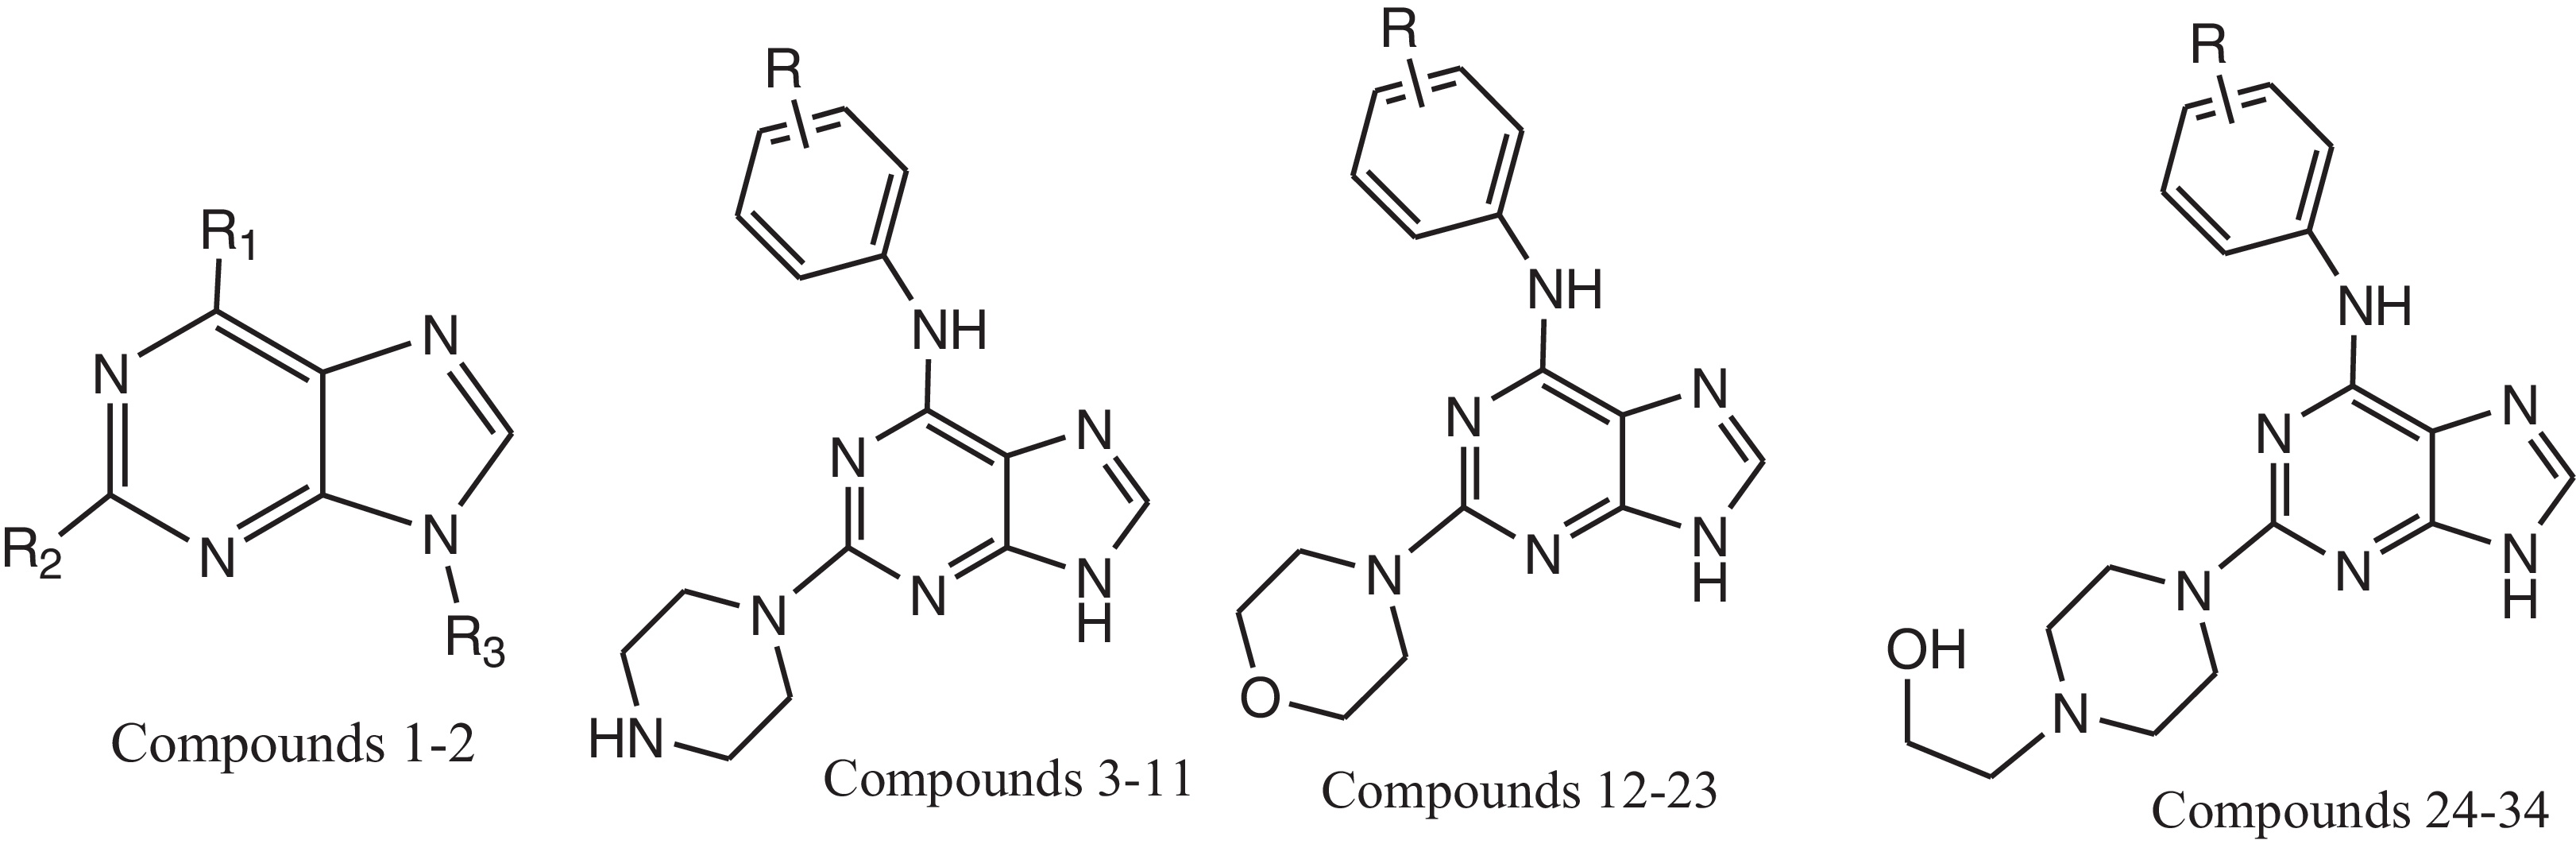 .
.
The sphere exclusion method [Citation19] was adopted to divide the training and test data set comprising of twenty-six and eight compounds, respectively, with a dissimilarity value of 8.6, where the dissimilarity value gives the sphere exclusion radius. This algorithm allows the construction of training sets covering all descriptor space areas occupied by representative points. Eight compounds, namely 3, 6, 8, 10, 19, 23, 27 and 31, were used as the test set, while the remaining molecules were used as the training set. Initially, the data set was split into training (70%) and test sets (30%) using the MDS software. Care was taken to achieve an even distribution of activities in both sets (training and test).
To perform the QSAR analysis, the structures of the compounds in the data set were sketched, and the physicochemical descriptors of the molecules were calculated using the V-life MDS (molecular design suite) software. All of the compounds were batch optimized to minimize energies and optimize the geometry using Merck molecular force fields, followed by considering the distance-dependent dielectric constant of 1.0, the convergence criterion or root mean square (RMS) gradient of 0.01 kcal/mol Å and the iteration limit of 10,000 [Citation20].
2.2 Two-dimensional QSAR
A large number of theoretical descriptors, such as SA Most Hydrophilic (most hydrophilic value on the vdW surface), SA Most Hydrophobic–Hydrophilic Distance (distance between most hydrophobic and hydrophilic point on the vdW surface), SA Hydrophilic Area (vdW surface descriptor showing hydrophilic surface area) and SK Most Hydrophilic, the radius of gyration, Wiener's index, moment of inertia, semi-empirical descriptors, HUMOEnergy (highest occupied molecular orbital), heat of formation and ionization potential, as well as constitutional, physicochemical, electrostatic, topological and semi-empirical descriptors have been computed from chemical structures with a view to developing the structure-activity relationships of purine compounds, which would, in turn, predict their biological activity.
The independent variables (i.e., descriptors) were preprocessed by removing the invariable values (constant column), which resulted in a total of 280 descriptors for use in QSAR analysis. Descriptors with the same value or almost the same value or that were highly correlated with other descriptors were removed initially.
2.3 Statistical computation
To calculate q2, each molecule in the training set was sequentially removed, the model refit using the same descriptors, and the biological activity of the removed molecule predicted using the refit model [Citation21]. The value of q2 was calculated using the following equation:(1)
(1) where yi,
are the actual and predicted activity of the ith molecule in the training set, respectively, and ymean is the average activity of all molecules in the training set. For external validation, the activity of each molecule in the test set was predicted using the model generated from the training set. The pred_r2 value is calculated as follows (Eq. Equation(2)
(2)
(2) ):
(2)
(2) where yi,
are the actual and predicted activity of the ith molecule in the test set, respectively, and ymean is the average activity of all molecules in the training set.
The developed quantitative model was evaluated using the following statistical measures: N, number of observations (molecules) in the training set; q2, cross-validated r2 (by leave one out), which is a relative measure of the quality of fit; pred_r2, r2 for the external test set; q2_se, standard error of cross-validation; and pred_r2 se, the standard error of the external test set prediction. The low standard error of pred_r2 se and q2_se show the obsolete quality of fitness of the model. The high pred_r2 and low pred_r2 se show the high predictive ability of the model. The q2 and pred_r2 values were used as deciding factors in selecting the optimal models.
3 Results and discussion
In this study, the training and test sets were generated using the sphere selection method followed by the partial least squares regression analysis. Several 2D QSAR models were constructed, and the best three regression equations obtained were as follows:Degrees of Freedom = 24, Ntraining = 26, Ntest = 8, r2 = 0.8319, q2 = 0.7550, F test = 43.148, r2 se = 0.4572, q2 se = 0.3588, pred_r2 = 0.7983, pred_r2se = 0.2432, ZScore Q^2 = 1.971, Best Rand Q^2 = 0.58238.
QSAR model (1) can explain 79% of the variance in the observed activity values. The r2_se has a low value for the regression equation, indicating goodness of fit. The major group of descriptors involved sub groups such as the SsCH3E-index contribution descriptor, the hydrogen donor count and SsOHcount that help in understanding the effect of substituents at different positions of the purine. An estate contribution descriptor, the SsCH3E-index, which represents the electro-topological state for the number of CH3 groups connected with single bonds, is inversely proportional to the activity of the R1 position, which may lead to an increase in the activity. Molecules (compounds 15 and 27) with greater numbers of methyl groups have more potent activity towards Src tyrosine kinase. The next contributing descriptor is the SsOHcount estate number (∼16%), which represents the total number of hydroxyl groups connected with single bonds, showing that hydroxyl groups should be directly attached to the purine ring for maximal activity. The alignment descriptor is T_2_Cl_3, which refers to the count of the number of double bonds separated from chlorine atoms by one bond distance in a molecule and indicates that the activity increased with the presence of a chlorine R1 position on the purine moiety, as in compounds 4, 16 and 28. The most strongly contributing descriptor is the H-donor count, the number of hydrogen bond donor atoms in a molecule, which is directly proportional to the activity and suggests that an increase in the H-donor count of the fragment's R position is favourable for its activity. The contribution chart of selected descriptors is shown in a, and plots of predicted vs. observed values of pIC50 are shown in b. The correlation matrix is shown in , demonstrating the good correlation of the selected parameters with biological activity.Degrees of Freedom = 24, Ntraining = 26, Ntest = 8, r2 = 0.7311, q2 = 0.6763, F test = 36.416, r2 se = 0.4168, q2 se = 0.3921, pred_r2 = 0.7046, pred_r2se = 0.5486, ZScore Q^2 = 2.3657, Best Rand Q^2 = 1.7685.
Fig. 1 (a) Plot of contribution chart of 2D QSAR model. (b) Graphs of observed vs. predicted activity of 2D QSAR model-1. (c) Graphs of observed vs. predicted activity of 2D QSAR model-2. (d) Graphs of observed vs. predicted activity of 2D QSAR model-3.
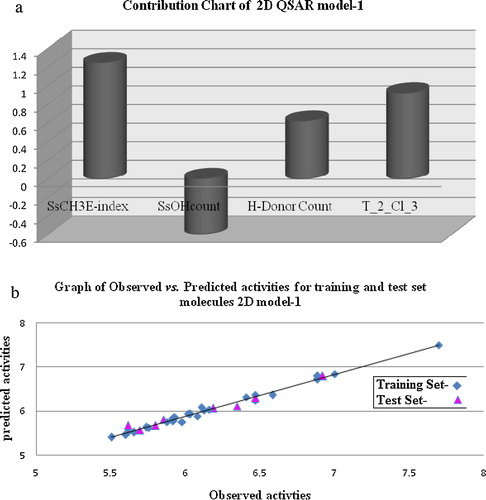
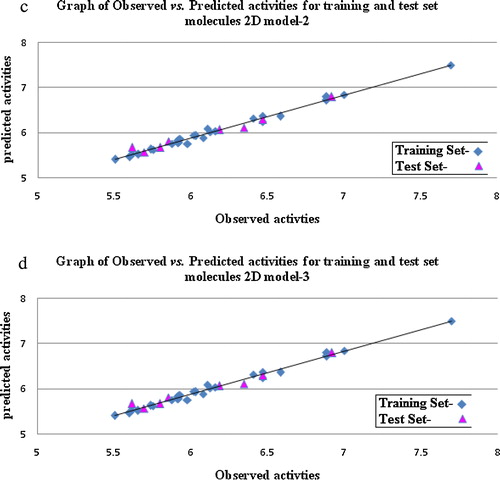
Table 2 Correlation matrix between descriptors present in the best QSAR model-1.
QSAR model-2 used the PLS analysis method and was confirmed by the statistical measures viz., the squared correlation coefficient (r2), which measures how closely the observed data track the fitted correlation line, and the standard error (r2_se), which expresses the variation of the residuals or the variation about the regression line. QSAR model 2, obtained by the PLS method, shows good correlation between biological activity and the parameters Bromine count, SsClE-index, and mol. wt. The correlation coefficient r2 = 0.7311, and the model explains approximately 73% of the variation in activity. The model was subjected to cross validation, and the value of the cross-validated squared correlation coefficient (q2 = 0.6763), the low sum of squares (pred_r2se = 0.5486) and the ZScore Q^2 of predictivity suggested good predictive ability of the biological activity of diverse structures.
The descriptor SsClE-index represents the electro-topological state indices for the number of chlorine atoms connected with one single bond, and it suggests that presence of chlorine atoms in the molecule corresponds to higher activity (compounds 4, 16 and 28). The descriptor mol.wt. indicates the presence of a bulky group at the R1 position, which is detrimental for the activity. The descriptor bromine count (∼16%) shows the role of the total number of bromine atoms in a molecule. It reveals that the presence of an electron-withdrawing group is favourable for the molecule's activity. The plots of predicted vs. observed values of pIC50 are shown in c.Degrees of Freedom = 24, Ntraining = 26, Ntest = 8, r2 = 0.7099, q2 = 0.6609, F test = 20.8543, r2 se = 0.3772, q2 se = 0.4318, pred_r2 = 0.6570, pred_r2se = 0.5218, ZScore Q^2 = 1.6542, Best Rand Q^2 = 1.1654.
Model (3) explains 70% of the variance in the observed activity values. The low standard error of r2_se = 0.3772 demonstrates the accuracy of the model, and the parameter for the predictivity of the test set compounds is high, pred_r2 = 0.6570, which shows the external predictive power of the model. The inverse relationship of this descriptor with the most hydrophobic group suggests that the presence of a hydrophobic group on the purine ring can enhance activity. The descriptor SddsN (nitro) count suggests that increasing the total number of nitro groups at the R1 position will lead to improved activity. The descriptor SdsCH count indexes the total number of CH groups connected with one double and one single bond. It shows that the presence of an aliphatic side chain at the R position of the purine is favourable for activity. The plots of predicted vs. observed values of pIC50 are shown in d. The above models are all validated by predicting the biological activities of the test molecules, as shown in .
Table 3 Observed and predicted activities with residue according to 2D QSAR models.
4 Conclusion
In this investigation, QSAR analysis was performed on a data set consisting of structurally diverse compounds to investigate the role of their structural features on their c-Src tyrosine kinase inhibitory activity. The results indicated that the topological, electronic and spatial parameters significantly influence activity. Electron-donating and electron-withdrawing groups were found to be an essential feature for c-Src tyrosine kinase. The results obtained from this study indicate the importance of SsCH3E-index, SsOHcount, H-Donor Count, SsClE-index and SddsN(nitro)count in determining the binding affinities of purine analogues for c-Src tyrosine kinase. These investigations will further help in rationalizing the design of c-Src tyrosine kinase inhibitors.
Acknowledgement
The author wishes to express gratitude to V-life Science Technologies Pvt. Ltd., for providing the trial version of the software for this study.
Notes
Peer review under responsibility of Taibah University
References
- A.UllrichJ.SchlessingerSignal transduction by receptors with tyrosine kinase activityCell611990203212
- S.M.ThomasJ.S.BruggeCellular functions regulated by Src family kinasesAnnu. Rev. Cell Dev. Biol.131997513609
- X.M.YuM.W.SalterSrc, a molecular switch governing gain control of synaptic transmission mediated by N-methyl-D-aspartate receptorsProc. Natl. Acad. Sci. U. S. A.96199976977704
- S.V.RusselloS.K.ShoreSRC in human carcinogenesisFront. Biosci.92004139144
- A.Y.TsygankovS.K.ShoreSrc: regulation, role in human carcinogenesis and pharmacological inhibitorsCurr. Pharm. Des.10200417451756
- T.HunterSignalinge 2000 and beyondCell1002000113127
- K.A.DeMaliS.L.GodwinS.P.SoltoffA.KazlauskasMultiple roles for Src in a PDGF-stimulated cellExp. Cell. Res.2531999271279
- F.A.Al-ObeidiJ.J.WuK.S.LamProtein tyrosine kinases: structure, substrate specificity, and drug discoveryBiopolymers471998197223
- R.RoskoskiJr.Src kinase regulation by phosphorylation and dephosphorylationBiochem. Biophys. Res. Commun.3312005114
- K.ParangG.SunRecent advances in the discovery of Src kinase inhibitorsExpert Opin. Ther. Patents15200511831207
- R.B.IrbyT.J.YeatmanRole of Src expression and activation in human cancerOncogene19200056365642
- A.KurupR.GragD.J.CariniC.HanschComparative QSAR: angiotensin II antagonistsChem. Rev.10120012727
- C.TintoriM.MagnaniS.SchenoneM.BottaDocking, 3D-QSAR studies and in silico ADME prediction on c-Src tyrosine kinase inhibitorsEur. J. Med. Chem.44March20099901000
- S.K.BairyB.V.Suneel KumarJ.U.BhallaA.B.PramodM.RavikumarThree dimensional quantitative structure-activity relationship studies on c-Src inhibitors based on different docking methodsChem. Biol. Drug Des.732009416427
- R.CaoN.MiH.Zhang3D-QSAR study of c-Src kinase inhibitors based on dockingJ. Mol. Model.162010361375
- H.CaoH.ZhangX.ZhengD.Gao3D QSAR studies on a series of potent and high selective inhibitors for three kinases of RTK familyJ. Mol. Graph. Model.262007236245
- VLife MDS Software Package, Version 3.52008Supplied by VLife Science Technologies Pvt. Ltd.Pune
- H.HuangJ.MaJ.ShiL.MengH.JiangJ.DingH.LiuDiscovery of novel purine derivatives with potent and selective inhibitory activity against c-Src tyrosine kinaseBioorg. Med. Chem.18201046154624
- A.GolbraikhA.TropshaPredictive QSAR modeling based on diversity sampling of experimental datasets for the training and test set selectionJ. Comput. Aided Mol. Des.162002357369
- T.A.HalgrenMerck molecular force field. III. Molecular geome-tries and vibrational frequencies for MMFF94J. Comput. Chem.171996553586
- R.D.CramerIIIJ.D.BunceD.E.PattersonCross validation, bootstrapping, and partial least squares compared with multiple regression in conventional QSAR studiesQuant. Struct. Act. Relat.719881825